Colorado's Trading Relationship Through the Ports-to-Plains Region -- 2004-2010
•
0 gostou•312 visualizações

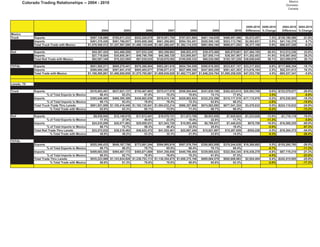
The document summarizes Colorado's trading relationships with Mexico from 2004-2010, broken down by transportation method (truck and rail) and key border crossings (Laredo, Eagle Pass, and Del Rio, TX). It shows that over this period, total trade with Mexico decreased 5.6%, with truck trade through Laredo making up the largest share but also showing the largest decline at 25.9%. Rail trade through Eagle Pass had the largest increase at 24.6%.

Recomendados
Recomendados
Mais conteúdo relacionado
Mais procurados
Mais procurados (19)
Destaque
Destaque (7)
Semelhante a Colorado's Trading Relationship Through the Ports-to-Plains Region -- 2004-2010
Semelhante a Colorado's Trading Relationship Through the Ports-to-Plains Region -- 2004-2010 (17)
Mais de Ports-To-Plains Blog
Mais de Ports-To-Plains Blog (20)
Último
Último (20)
Colorado's Trading Relationship Through the Ports-to-Plains Region -- 2004-2010
- 1. Mexico Colorado Trading Relationships -- 2004 - 2010 Domestic Canada 2009-2010 2009-2010 2004-2010 2004-2010 2004 2005 2006 2007 2008 2009 2010 Difference % Change Difference % Change Mexico Truck Exports $597,138,086 $765,811,233 $932,526,678 $819,951,754 $787,931,084 $461,144,039 $466,957,496 $5,813,457 1.3% -$130,180,590 -21.8% Imports $481,370,426 $561,786,057 $555,608,368 $661,308,693 $594,183,451 $520,550,145 $523,113,796 $2,563,651 0.5% $41,743,370 8.7% Total Truck Trade with Mexico $1,078,508,512 $1,327,597,290 $1,488,135,046 $1,481,260,447 $1,382,114,535 $981,694,184 $990,071,292 $8,377,108 0.9% -$88,437,220 -8.2% Rail Exports $54,367,425 $43,468,208 $37,833,326 $83,309,862 $66,853,475 $39,475,466 $66,879,661 $27,404,195 69.4% $12,512,236 23.0% Imports $27,719,924 $35,855,361 $49,796,709 $45,368,720 $33,805,857 $27,055,114 $38,307,567 $11,252,453 41.6% $10,587,643 38.2% Total Rail Trade with Mexico $82,087,349 $79,323,569 $87,630,035 $128,678,582 $100,659,332 $66,530,580 $105,187,228 $38,656,648 58.1% $23,099,879 28.1% TOTAL Exports $651,505,511 $809,279,441 $970,360,004 $903,261,616 $854,784,559 $500,619,505 $533,837,157 $33,217,652 6.6% -$117,668,354 -18.1% Imports $509,090,350 $597,641,418 $605,405,077 $706,677,413 $627,989,308 $547,605,259 $561,421,363 $13,816,104 2.5% $52,331,013 10.3% Total Trade with Mexico $1,160,595,861 $1,406,920,859 $1,575,765,081 $1,609,939,029 $1,482,773,867 $1,048,224,764 $1,095,258,520 $47,033,756 4.5% -$65,337,341 -5.6% Laredo, TX Truck Exports $516,003,491 $637,021,137 $755,467,803 $575,417,078 $556,504,944 $341,830,106 $362,423,814 $20,593,708 6.0% -$153,579,677 -29.8% % of Total Exports to Mexico 86.4% 83.2% 81.0% 70.2% 70.6% 74.1% 77.6% 3.5% -8.8% Imports $385,648,465 $468,395,309 $436,662,838 $519,415,136 $429,802,924 $332,232,586 $315,117,510 -$17,115,076 -5.2% -$70,530,955 -18.3% % of Total Imports to Mexico 80.1% 83.4% 78.6% 78.5% 72.3% 63.8% 60.2% -3.6% -19.9% Total Truck Trade Thru Laredo $901,651,956 $1,105,416,446 $1,192,130,641 $1,094,832,214 $986,307,868 $674,062,692 $677,541,324 $3,478,632 0.5% -$224,110,632 -24.9% % Total Trade with Mexico 83.6% 83.3% 80.1% 73.9% 71.4% 68.7% 68.4% -0.2% -15.2% Rail Exports $9,536,942 $12,146,619 $17,613,441 $19,578,741 $11,073,760 $9,053,850 $7,820,824 -$1,233,026 -13.6% -$1,716,118 -18.0% % of Total Exports to Mexico 17.5% 27.9% 46.6% 23.5% 16.6% 22.9% 11.7% -11.2% -5.8% Imports $24,035,090 $26,071,863 $29,009,031 $21,943,720 $10,993,480 $6,768,037 $7,446,835 $678,798 10.0% -$16,588,255 -69.0% % of Total Imports to Mexico 86.7% 72.7% 58.3% 48.4% 32.5% 25.0% 19.4% -5.6% -67.3% Total Rail Trade Thru Laredo $33,572,032 $38,218,482 $46,622,472 $41,522,461 $22,067,240 $15,821,887 $15,267,659 -$554,228 -3.5% -$18,304,373 -54.5% % Total Trade with Mexico 40.9% 48.2% 53.2% 32.3% 21.9% 23.8% 14.5% -9.3% -26.4% TOTAL Exports $525,540,433 $649,167,756 $773,081,244 $594,995,819 $567,578,704 $350,883,956 $370,244,638 $19,360,682 5.5% -$155,295,795 -29.5% % of Total Exports to Mexico 80.7% 80.2% 79.7% 65.9% 66.4% 70.1% 69.4% -0.7% -11.3% Imports $409,683,555 $494,467,172 $465,671,869 $541,358,856 $440,796,404 $339,000,623 $322,564,345 -$16,436,278 -4.8% -$87,119,210 -21.3% % of Total Imports to Mexico 80.5% 82.7% 76.9% 76.6% 70.2% 61.9% 57.5% -4.5% -23.0% Total Trade Thru Laredo $935,223,988 $1,143,634,928 $1,238,753,113 $1,136,354,675 $1,008,375,108 $689,884,579 $692,808,983 $2,924,404 0.4% -$242,415,005 -25.9% % Total Trade with Mexico 80.6% 81.3% 78.6% 70.6% 68.0% 65.8% 63.3% -2.6% -17.3%
- 2. Mexico Colorado Trading Relationships -- 2004 - 2010 Domestic Canada 2009-2010 2009-2010 2004-2010 2004-2010 2004 2005 2006 2007 2008 2009 2010 Difference % Change Difference % Change Eagle Pass, TX Truck Exports $2,536,232 $1,046,890 $7,822,528 $3,952,526 $17,637,459 $8,179,320 $2,074,992 -$6,104,328 -74.6% -$461,240 -18.2% % of Total Exports to Mexico 0.4% 0.1% 0.8% 0.5% 2.2% 1.8% 0.4% -1.3% 0.0% Imports $6,151,126 $6,443,254 $6,589,832 $8,764,202 $30,421,944 $56,267,083 $73,932,497 $17,665,414 31.4% $67,781,371 1101.9% % of Total Imports to Mexico 1.3% 1.1% 1.2% 1.3% 5.1% 10.8% 14.1% 3.3% 12.9% Total Truck Trade Thru Eagle Pass $8,687,358 $7,490,144 $14,412,360 $12,716,728 $48,059,403 $64,446,403 $76,007,489 $11,561,086 17.9% $67,320,131 774.9% % Total Trade with Mexico 0.8% 0.6% 1.0% 0.9% 3.5% 6.6% 7.7% 1.1% 6.9% Rail Exports $29,123,680 $29,966,052 $17,990,128 $55,114,641 $44,427,793 $22,268,126 $34,789,956 $12,521,830 56.2% $5,666,276 19.5% % of Total Exports to Mexico 53.6% 68.9% 47.6% 66.2% 66.5% 56.4% 52.0% -4.4% -1.5% Imports $0 $273,098 $684,399 $205,274 $1,088,597 $417,362 $1,500,649 $1,083,287 259.6% $1,500,649 #DIV/0! % of Total Imports to Mexico 0.0% 0.8% 1.4% 0.5% 3.2% 1.5% 3.9% 2.4% 3.9% Total Rail Trade Thru Eagle Pass $29,123,680 $30,239,150 $18,674,527 $55,319,915 $45,516,390 $22,685,488 $36,290,605 $13,605,117 60.0% $7,166,925 24.6% % Total Trade with Mexico 35.5% 38.1% 21.3% 43.0% 45.2% 34.1% 34.5% 0.4% -1.0% TOTAL Exports $31,659,912 $31,012,942 $25,812,656 $59,067,167 $62,065,252 $30,447,446 $36,864,948 $6,417,502 21.1% $5,205,036 16.4% % of Total Exports to Mexico 4.9% 3.8% 2.7% 6.5% 7.3% 6.1% 6.9% 0.8% 2.0% Imports $6,151,126 $6,716,352 $7,274,231 $8,969,476 $31,510,541 $56,684,445 $75,433,146 $18,748,701 33.1% $69,282,020 1126.3% % of Total Imports to Eagle Pass 1.2% 1.1% 1.2% 1.3% 5.0% 10.4% 13.4% 3.1% 12.2% Total Trade Thru Laredo $37,811,038 $37,729,294 $33,086,887 $68,036,643 $93,575,793 $87,131,891 $112,298,094 $25,166,203 28.9% $74,487,056 197.0% % Total Trade with Mexico 3.3% 2.7% 2.1% 4.2% 6.3% 8.3% 10.3% 1.9% 7.0% Del Rio, TX Truck Exports $245,719 $472,614 $24,444 $104,165 $112,584 $23,021 $86,010 $62,989 273.6% -$159,709 -65.0% % of Total Exports to Mexico 0.0% 0.1% 0.0% 0.0% 0.0% 0.0% 0.0% 0.0% 0.0% Imports $2,874 $0 $0 $6,880 $0 $217,050 $1,372,584 $1,155,534 532.4% $1,369,710 47658.7% % of Total Imports to Mexico 0.0% 0.0% 0.0% 0.0% 0.0% 0.0% 0.3% 0.2% 0.3% Total Truck Trade Thru Del Rio $248,593 $472,614 $24,444 $111,045 $112,584 $240,071 $1,458,594 $1,218,523 507.6% $1,210,001 486.7% % Total Trade with Mexico 0.0% 0.0% 0.0% 0.0% 0.0% 0.0% 0.1% 0.1% 0.1% Rail Exports $0 $0 $0 #DIV/0! $0 #DIV/0! % of Total Exports to Mexico 0.0% 0.0% #DIV/0! #DIV/0! #DIV/0! #DIV/0! #DIV/0! #DIV/0! Imports $0 $0 $0 #DIV/0! $0 #DIV/0! % of Total Imports to Mexico 0.0% 0.0% #DIV/0! #DIV/0! #DIV/0! #DIV/0! #DIV/0! #DIV/0! Total Rail Trade Thru Del Rio $0 $0 $0 #DIV/0! $0 #DIV/0! % Total Trade with Mexico 0.0% 0.0% $0 $0 0.0% 0.0% 0.0% 0.0% TOTAL Exports $245,719 $472,614 $24,444 $104,165 $112,584 $23,021 $86,010 $62,989 273.6% -$159,709 -65.0% % of Total Exports to Mexico 0.0% 0.1% 0.0% 0.0% 0.0% 0.0% 0.0% 0.0% 0.0% Imports $2,874 $0 $0 $6,880 $0 $217,050 $1,372,584 $1,155,534 532.4% $1,369,710 47658.7% % of Total Imports to Mexico 0.0% 0.0% 0.0% 0.0% 0.0% 0.0% 0.2% 0.2% 0.2% Total Trade Thru Del Rio $242,845 $472,614 $24,444 $111,045 $112,584 $240,071 $1,458,594 $1,218,523 507.6% $1,210,001 500.6% % Total Trade with Mexico 0.0% 0.0% 0.0% 0.0% 0.0% 0.0% 0.1% 0.1% 0.1%
- 3. Mexico Colorado Trading Relationships -- 2004 - 2010 Domestic Canada 2009-2010 2009-2010 2004-2010 2004-2010 2004 2005 2006 2007 2008 2009 2010 Difference % Change Difference % Change GPITC Truck Exports $518,785,442 $638,540,641 $763,314,775 $579,473,769 $574,254,987 $350,032,447 $364,584,816 $14,552,369 4.2% -$154,200,626 -29.7% % of Total Exports to Mexico 86.9% 83.4% 81.9% 70.7% 72.9% 75.9% 78.1% 2.2% -8.8% Imports $391,802,465 $474,838,563 $443,252,670 $528,186,218 $460,224,868 $388,716,719 $390,422,591 $1,705,872 0.4% -$1,379,874 -0.4% % of Total Imports to Mexico 81.4% 84.5% 79.8% 79.9% 77.5% 74.7% 74.6% 0.0% -6.8% Total Truck Trade Thru Alliance $910,587,907 $1,113,379,204 $1,206,567,445 $1,107,659,987 $1,034,479,855 $738,749,166 $755,007,407 $16,258,241 2.2% -$155,580,500 -17.1% % Total Trade with Mexico 84.4% 83.9% 81.1% 74.8% 74.8% 75.3% 76.3% 1.0% -8.2% Rail Exports $38,660,622 $42,112,671 $35,603,569 $74,693,382 $55,501,553 $31,321,976 $42,610,780 $11,288,804 36.0% $3,950,158 10.2% % of Total Exports to Mexico 71.1% 96.9% 94.1% 89.7% 83.0% 79.3% 63.7% -15.6% -7.4% Imports $24,035,090 $26,344,961 $29,693,430 $22,148,994 $12,082,077 $7,185,399 $8,947,484 $1,762,085 24.5% -$15,087,606 -62.8% % of Total Imports to Mexico 86.7% 73.5% 59.6% 48.8% 35.7% 26.6% 23.4% -3.2% -63.3% Total Rail Trade Thru Alliance $62,695,712 $68,457,632 $65,296,999 $96,842,376 $67,583,630 $38,507,375 $51,558,264 $13,050,889 33.9% -$11,137,448 -17.8% % Total Trade with Mexico 76.4% 86.3% 74.5% 75.3% 67.1% 57.9% 49.0% -8.9% -27.4% TOTAL Exports $557,446,064 $680,653,312 $798,918,344 $654,167,151 $629,756,540 $381,354,423 $407,195,596 $25,841,173 6.8% -$150,250,468 -27.0% % of Total Exports to Mexico 85.6% 84.1% 82.3% 72.4% 73.7% 76.2% 76.3% 0.1% -9.3% Imports $415,837,555 $501,183,524 $472,946,100 $550,335,212 $472,306,945 $395,902,118 $399,370,075 $3,467,957 0.9% -$16,467,480 -4.0% % of Total Imports to Mexico 81.7% 83.9% 78.1% 77.9% 75.2% 72.3% 71.1% -1.2% -10.5% Total Trade Thru Alliance $973,277,871 $1,181,836,836 $1,271,864,444 $1,204,502,363 $1,102,063,485 $777,256,541 $806,565,671 $29,309,130 3.8% -$166,712,200 -17.1% % Total Trade with Mexico 83.9% 84.0% 80.7% 74.8% 74.3% 74.1% 73.6% -0.5% -10.2%
- 4. Mexico Colorado Trading Relationships -- 2004 - 2010 Domestic Canada Leading Exports from Colorado to Mexico (Surface Leading Exports from Colorado to Mexico 2010 Transportation) 2010 2010 (Surface Transportation) 2010 Rank Export Rank Coahuila Export 1 2 Meat and edible meat offal $146,096,800 1 31 Fertilizers $4,603,512 2 37 Photographic or cinematographic goods $110,494,807 2 39 Plastics and Articles $1,721,372 3 84 Nuclear reactors; boilers; machinery and mechanical $31,685,882 3 84 Computer-Related Machinery and Parts $1,335,007 4 4 Dairy produce; Birds' eggs; Natural honey; Edible $30,998,995 4 27 Mineral Fuels; Oils and Waxes $1,180,157 5 27 Mineral fuels; mineral oils and products of their $29,608,019 5 73 Articles of Iron and Steel $946,912 6 39 Plastics and articles thereof $17,904,199 6 96 Miscellaneous Manufactured Articles $717,892 7 73 Articles of iron or steel $15,622,790 7 85 Electrical Machinery; Equipment and Parts $717,319 8 76 Aluminum and articles thereof $15,353,274 8 64 Footwear $707,953 9 90 Optical; photographic; cinematographic; measuring; $12,964,430 9 82 Tools of Base Metal $392,426 10 87 Vehicles; other than railway or tramway rolling stock; $12,701,378 10 87 Vehicles Other than Railway $349,743 2010 Leading Imports to Colorado from Mexico (Surface 2010 Rank Import 2010 Leading Exports from Colorado from Mexico 2010 1 87 Vehicles Other than Railway $76,172,265 Nuevo Leon Export 2 40 Rubber and Articles $76,019,703 1 2 Meat and Edible Offal $40,662,217 3 84 Computer-Related Machinery and Parts $67,822,718 2 76 Aluminum and Articles $8,765,124 4 90 Measuring and Testing Instruments $47,178,411 3 84 Computer-Related Machinery and Parts $7,420,199 5 37 Photographic Goods $43,066,434 4 10 Cereals $2,053,959 6 73 Articles of Iron and Steel $40,928,021 5 83 Miscellaneous Articles of Base Metals $1,390,653 7 85 Electrical Machinery; Equipment and Parts $40,736,667 6 85 Electrical Machinery; Equipment and Parts $1,098,956 8 94 Furniture; Lamps and Prefabricated Buildings $25,407,077 7 48 Paper and Paperboard $1,065,237 9 71 Pearls; Stones; Metals and Imitation Jewelry $18,733,855 8 21 Miscellaneous Edible Preparations $806,328 10 72 Iron and Steel $16,790,160 9 39 Plastics and Articles $597,449 10 7 Edible Vegetables and Roots $590,076 2010 Leading Exports from Colorado from Mexico 2010 Tamaulipas Export 1 2 Meat and Edible Offal $7,822,360 2 84 Computer-Related Machinery and Parts $2,044,127 3 56 Wadding; Felt and Nonwovens $999,914 4 48 Paper and Paperboard $856,777 5 96 Miscellaneous Manufactured Articles $646,514 6 73 Articles of Iron and Steel $439,503 7 39 Plastics and Articles $318,262 8 4 Dairy Products $113,976 9 70 Glass $87,135 10 87 Vehicles Other than Railway $78,046
- 5. Mexico Colorado Trading Relationships -- 2004 - 2010 Domestic Canada Rail Truck Rail Truck Change Change Domestic -- Change Change Domestic 2002 Domestic -- 2007 2002-2007 2002-2007 2015 2002-2015 2002-2015 Exports Rail Truck Exports Rail Truck Exports Rail Truck Colorado $0 Colorado Colorado Montana 76 462 9% Montana 747 7% -100% 62% Montana 13 780 7% -83% 69% Nebraska 722 12% Nebraska 1,117 11% 0% 55% Nebraska 10 2,203 19% #DIV/0! 205% New Mexico 653 11% New Mexico 1,926 18% 0% 195% New Mexico 8 1,888 16% #DIV/0! 189% North Dakota 0 0% North Dakota 120 1% 0% 100% North Dakota 123 1% #DIV/0! #DIV/0! Oklahoma 240 4% Oklahoma 420 4% 0% 75% Oklahoma 64 416 4% #DIV/0! 73% South Dakota 187 3% South Dakota 227 2% 0% 21% South Dakota 261 2% #DIV/0! 39% Texas 338 2,264 43% Texas 275 3,304 34% -19% 46% Texas 162 3,129 28% -52% 38% Wyoming 1,105 18% Wyoming 2,337 22% 0% 111% Wyoming 1 2,883 24% #DIV/0! 161% Total ($m) 414 5,633 Total ($m) 275 10,198 100% -34% 81% Total ($m) 257 11,683 100% -38% 107% 6,047 10,473 73% 11,940 97% Millions Imports Rail Truck Imports Rail Truck Imports Rail Truck Colorado Colorado Colorado Montana 46 0 1% Montana 80 1% -100% Montana 48 103 1% 5% #DIV/0! Nebraska 298 1,267 24% Nebraska 223 1,589 17% -25% 25% Nebraska 244 2,107 18% -18% 66% New Mexico 9 407 7% New Mexico 561 5% -100% 38% New Mexico 5 937 7% -41% 130% North Dakota 39 1% North Dakota 0% 0% -100% North Dakota 80 320 3% #DIV/0! 722% Oklahoma 675 11% Oklahoma 73 881 9% 100% 31% Oklahoma 76 974 8% #DIV/0! 44% South Dakota 137 2% South Dakota 249 2% 0% 82% South Dakota 3 281 2% #DIV/0! 105% Texas 167 2,653 44% Texas 84 5,488 52% -50% 107% Texas 95 6,164 47% -43% 132% Wyoming 90 603 11% Wyoming 232 1,179 13% 158% 96% Wyoming 231 1,610 14% 157% 167% Total ($m) $610 $5,781 Total ($m) 612 10,027 100% 0% 73% Total ($m) 783 12,496 100% 28% 116% $6,391 10,639 66% 13,280 108% Millions TOTALS Rail Truck TOTALS Rail Truck TOTALS Rail Truck Colorado Colorado Colorado Montana 122 462 5% Colorado 827 4% -100% 79% Colorado 883 4% -100% 91% Nebraska 298 1,989 18% Nebraska 223 2,706 14% -25% 36% Nebraska 254 4,310 18% -15% 117% New Mexico 9 1,060 9% New Mexico 2,487 12% -100% 135% New Mexico 2,825 11% -100% 167% North Dakota 39 0% North Dakota 120 1% 0% 208% North Dakota 444 2% #DIV/0! 1038% Oklahoma 915 7% Oklahoma 73 1,301 7% -100% 42% Oklahoma 140 1,390 6% #DIV/0! 52% South Dakota 324 3% South Dakota 476 2% 0% 47% South Dakota 541 2% #DIV/0! 67% Texas 505 4,917 44% Texas 359 8,792 43% -29% 79% Texas 257 9,293 38% -49% 89% Wyoming 90 1,708 14% Wyoming 232 3,516 18% 158% 106% Wyoming 232 4,493 19% 158% 163% Total ($m) $1,024 $11,414 Total ($m) 887 20,225 100% -13% 77% Total ($m) 883 24,179 100% -14% 112% $12,438 21,112 70% 25,062 101%
- 6. Mexico Colorado Trading Relationships -- 2004 - 2010 Domestic Canada 2009- 2009-2010 2010 % 2004-2010 2004-2010 2004 2005 2006 2007 2008 2009 2010 Difference Change Difference % Change Canada Truck Exports $1,337,778,190 $1,418,648,772 $1,448,187,809 $1,375,580,782 $1,600,947,218 $1,135,946,533 $1,136,831,970 $885,437 0.1% -$200,946,220 -15.0% Imports $807,034,746 $1,026,499,418 $1,022,955,601 $1,341,899,044 $1,093,022,099 $765,862,827 $843,615,754 $77,752,927 10.2% $36,581,008 4.5% Total Truck Trade with Canada $2,144,812,936 $2,445,148,190 $2,471,143,410 $2,717,479,826 $2,693,969,317 $1,901,809,360 $1,980,447,724 $78,638,364 4.1% -$164,365,212 -7.7% Rail Exports $63,037,304 $90,232,684 $190,346,988 $190,532,462 $304,885,103 $135,141,806 $91,535,129 -$43,606,677 -32.3% $28,497,825 45.2% Imports $491,471,483 $588,450,141 $486,572,576 $526,011,674 $402,082,084 $201,745,947 $230,684,240 $28,938,293 14.3% -$260,787,243 -53.1% Total Rail Trade with Canada $554,508,787 $678,682,825 $676,919,564 $716,544,136 $706,967,187 $336,887,753 $322,219,369 -$14,668,384 -4.4% -$232,289,418 -41.9% TOTAL Exports $1,400,815,494 $1,508,881,456 $1,638,534,797 $1,566,113,244 $1,905,832,321 $1,271,088,339 $1,228,367,099 -$42,721,240 -3.4% -$172,448,395 -12.3% Imports $1,298,506,229 $1,614,949,559 $1,509,528,177 $1,867,910,718 $1,495,104,183 $967,608,774 $1,074,299,994 $106,691,220 11.0% -$224,206,235 -17.3% Total Trade with Canada $2,699,321,723 $3,123,831,015 $3,148,062,974 $3,434,023,962 $3,400,936,504 $2,238,697,113 $2,302,667,093 $63,969,980 2.9% -$396,654,630 -14.7% Raymond, MT Truck Exports $2,114,767 $3,817,348 $4,834,138 $10,542,544 $11,160,573 $6,942,388 $5,971,708 -$970,680 -14.0% $3,856,941 182.4% % of Total Exports to Canada 0.2% 0.3% 0.3% 0.8% 0.7% 0.6% 0.5% -0.1% 0.4% Imports $10,885,418 $22,029,119 $26,301,061 $69,337,561 $39,279,681 $21,715,400 $48,684,149 $26,968,749 124.2% $37,798,731 347.2% % of Total Imports to Canada 1.3% 2.1% 2.6% 5.2% 3.6% 2.8% 5.8% 2.9% 4.4% Total Truck Trade Thru Raymond $13,000,185 $25,846,467 $31,135,199 $79,880,105 $50,440,254 $28,657,788 $54,655,857 $20,744,720 90.7% $41,655,672 320.4% % Total Trade with Canada 0.6% 1.1% 1.3% 2.9% 1.9% 1.5% 2.8% 1.3% 2.2% Rail Exports $0 $0 $0 #DIV/0! $0 #DIV/0! % of Total Exports to Canada 0.0% 0.0% 0.0% 0.0% 0.0% 0.0% 0.0% 0.0% 0.0% Imports $0 $0 $0 #DIV/0! $0 #DIV/0! % of Total Imports to Canada 0.0% 0.0% 0.0% 0.0% 0.0% 0.0% 0.0% 0.0% 0.0% Total Truck Trade Thru Raymond $0 $0 $0 $0 $0 $0 $0 #DIV/0! $0 #DIV/0! % Total Trade with Canada 0.0% 0.0% 0.0% 0.0% 0.0% 0.0% 0.0% 0.0% 0.0% TOTAL Exports $2,114,767 $3,817,348 $4,834,138 $10,542,544 $11,160,573 $6,942,388 $5,971,708 -$970,680 -14.0% $3,856,941 182.4% % of Total Exports to Canada 0.2% 0.3% 0.3% 0.7% 0.6% 0.5% 0.5% -0.1% 0.3% Imports $10,885,418 $22,029,119 $26,301,061 $69,337,561 $39,279,681 $21,715,400 $48,684,149 $26,968,749 124.2% $37,798,731 347.2% % of Total Imports to Canada 0.8% 1.4% 1.7% 3.7% 2.6% 2.2% 4.5% 2.3% 3.7% Total Trade Thru Raymond $13,000,185 $25,846,467 $31,135,199 $79,880,105 $50,440,254 $28,657,788 $54,655,857 $20,744,720 90.7% $41,655,672 320.4% % Total Trade with Canada 0.5% 0.8% 1.0% 2.3% 1.5% 1.3% 2.4% 1.1% 1.9%
- 7. Mexico Colorado Trading Relationships -- 2004 - 2010 Domestic Canada 2009- 2009-2010 2010 % 2004-2010 2004-2010 2004 2005 2006 2007 2008 2009 2010 Difference Change Difference % Change Sweet Grass, MT Truck Exports $166,037,392 $101,300,639 $126,171,357 $142,233,429 $155,903,677 $119,109,854 $141,927,729 $22,817,875 19.2% -$24,109,663 -14.5% % of Total Exports to Canada 12.4% 7.1% 8.7% 10.3% 9.7% 10.5% 12.5% 2.0% 0.1% Imports $166,269,963 $253,011,190 $322,036,110 $554,925,178 $405,452,097 $199,825,669 $190,703,628 -$9,122,041 -4.6% $24,433,665 14.7% % of Total Imports to Canada 20.6% 24.6% 31.5% 41.4% 37.1% 26.1% 22.6% -3.5% 2.0% Total Truck Trade Thru Sweet Grass $332,307,355 $354,311,829 $448,207,467 $697,158,607 $561,355,774 $318,935,523 $332,631,357 $222,643,544 4.3% $324,002 0.1% % Total Trade with Canada 15.5% 14.5% 18.1% 25.7% 20.8% 16.8% 16.8% 0.0% 1.3% Rail Exports $200,101 $185,912 $3,433,293 $5,441,705 $8,387,930 $12,386,208 $16,958,495 $4,572,287 36.9% $16,758,394 8375.0% % of Total Exports to Canada 0.3% 0.2% 1.8% 2.9% 2.8% 9.2% 18.5% 9.4% 18.2% Imports $46,254,973 $43,969,655 $26,082,075 $73,928,126 $24,930,431 $18,069,641 $33,684,411 $15,614,770 86.4% -$12,570,562 -27.2% % of Total Imports to Canada 9.4% 7.5% 5.4% 14.1% 6.2% 9.0% 14.6% 5.6% 5.2% Total Rail Trade Thru Sweet Grass $46,455,074 $44,155,567 $29,515,368 $79,369,831 $33,318,361 $30,455,849 $50,642,906 $22,641,928 66.3% $4,187,832 9.0% % Total Trade with Canada 8.4% 6.5% 4.4% 11.1% 4.7% 9.0% 15.7% 6.7% 7.3% TOTAL Exports $166,237,493 $101,486,551 $129,604,650 $147,675,134 $164,291,607 $131,496,062 $158,886,224 $27,390,162 20.8% -$7,351,269 -4.4% % of Total Exports to Canada 11.9% 6.7% 7.9% 9.4% 8.6% 10.3% 12.9% 2.6% 1.1% Imports $212,524,936 $296,980,845 $348,118,185 $628,853,304 $430,382,528 $217,895,310 $224,388,039 $6,492,729 3.0% $11,863,103 5.6% % of Total Imports to Canada 16.4% 18.4% 23.1% 33.7% 28.8% 22.5% 20.9% -1.6% 4.5% Total Trade Thru Sweet Grass $378,762,429 $398,467,396 $477,722,835 $776,528,438 $594,674,135 $349,391,372 $383,274,263 $245,285,472 9.7% $4,511,834 1.2% % Total Trade with Canada 14.0% 12.8% 15.2% 22.6% 17.5% 15.6% 16.6% 1.0% 2.6% Portal, ND Truck Exports $18,094,321 $49,836,713 $96,311,604 $73,267,550 $176,161,505 $257,015,286 $132,704,744 -$124,310,542 -48.4% $114,610,423 633.4% % of Total Exports to Canada 1.4% 3.5% 6.7% 5.3% 11.0% 22.6% 11.7% -11.0% 10.3% Imports $10,975,196 $23,714,096 $20,863,660 $32,653,675 $27,021,253 $16,086,418 $32,207,301 $16,120,883 100.2% $21,232,105 193.5% % of Total Imports to Canada 1.4% 2.3% 2.0% 2.4% 2.5% 2.1% 3.8% 1.7% 2.5% Total Truck Trade Thru Portal $29,069,517 $73,550,809 $117,175,264 $105,921,225 $203,182,758 $273,101,704 $164,912,045 -$108,224,124 -39.6% $135,842,528 467.3% % Total Trade with Canada 1.4% 3.0% 4.7% 3.9% 7.5% 14.4% 8.3% -6.0% 7.0% Rail Exports $21,863,019 $34,323,996 $30,290,980 $37,310,017 $84,150,181 $30,325,811 $3,937,798 -$26,388,013 -87.0% -$17,925,221 -82.0% % of Total Exports to Canada 34.7% 38.0% 15.9% 19.6% 27.6% 22.4% 4.3% -18.1% -30.4% Imports $34,378,309 $8,750,519 $5,731,277 $9,496,557 $18,861,897 $2,819,844 $4,610,480 $1,790,636 63.5% -$29,767,829 -86.6% % of Total Imports to Canada 7.0% 1.5% 1.2% 1.8% 4.7% 1.4% 2.0% 0.6% -5.0% Total Rail Trade Thru Portal $56,241,328 $43,074,515 $36,022,257 $46,806,574 $103,012,078 $33,145,655 $8,548,278 -$23,568,169 -74.2% -$47,693,050 -84.8% % Total Trade with Canada 10.1% 6.3% 5.3% 6.5% 14.6% 9.8% 2.7% -7.2% -7.5% TOTAL Exports $39,957,340 $84,160,709 $126,602,584 $110,577,567 $260,311,686 $287,341,097 $136,642,542 -$150,698,555 -52.4% $96,685,202 242.0% % of Total Exports to Canada 2.9% 5.6% 7.7% 7.1% 13.7% 22.6% 11.1% -11.5% 8.3% Imports $45,353,505 $32,464,615 $26,594,937 $42,150,232 $45,883,150 $18,906,262 $36,817,781 $17,911,519 94.7% -$8,535,724 -18.8% % of Total Imports to Canada 3.5% 2.0% 1.8% 2.3% 3.1% 2.0% 3.4% 1.5% -0.1% Total Trade Thru Portal $85,310,845 $116,625,324 $153,197,521 $152,727,799 $306,194,836 $306,247,359 $173,460,323 -$131,792,293 -43.4% $88,149,478 103.3% % Total Trade with Canada 3.2% 3.7% 4.9% 4.4% 9.0% 13.7% 7.5% -6.1% 4.4%
- 8. Mexico Colorado Trading Relationships -- 2004 - 2010 Domestic Canada 2009- 2009-2010 2010 % 2004-2010 2004-2010 2004 2005 2006 2007 2008 2009 2010 Difference Change Difference % Change Wild Horse 0 Truck Exports $0 $0 $0 $0 $0 $0 $0 $0 #DIV/0! $0 #DIV/0! % of Total Exports to Canada 0.0% 0.0% 0.0% 19.4% 0.0% 0.0% 0.0% 0.0% 0.0% Imports $61,889 $161,646 $234,364 $114,476 $0 $68,524 $68,524 #DIV/0! $68,524 #DIV/0! % of Total Imports to Canada 0.0% 0.0% 0.0% 0.0% 0.0% 0.0% 0.0% 0.0% 0.0% Total Truck Trade Thru GPITC $0 $61,889 $161,646 $234,364 $114,476 $0 $68,524 $0 #DIV/0! $68,524 #DIV/0! % Total Trade with Canada 0.0% 0.0% 0.0% 0.0% 0.0% 0.0% 0.0% 0.0% 0.0% Rail Exports $0 $0 $0 $0 #DIV/0! $0 #DIV/0! % of Total Exports to Canada 0.0% 0.0% 0.0% 0.0% 0.0% 0.0% 0.0% 0.0% 0.0% Imports $0 $0 $0 $0 #DIV/0! $0 #DIV/0! % of Total Imports to Canada 0.0% 0.0% 0.0% 0.0% 0.0% 0.0% 0.0% 0.0% 0.0% Total Rail Trade Thru GPITC $0 $0 $0 $0 $0 $0 $0 $0 #DIV/0! $0 #DIV/0! % Total Trade with Canada 0.0% 0.0% 0.0% 0.0% 0.0% 0.0% 0.0% 0.0% 0.0% TOTAL Exports $0 $0 $0 $0 $0 $0 $0 $0 #DIV/0! $0 #DIV/0! % of Total Exports to Canada 0.0% 0.0% 0.0% 0.0% 0.0% 0.0% 0.0% 0.0% 0.0% Imports $0 $61,889 $161,646 $234,364 $114,476 $0 $68,524 $68,524 #DIV/0! $68,524 #DIV/0! % of Total Imports to Canada 0.0% 0.0% 0.0% 0.0% 0.0% 0.0% 0.0% 0.0% 0.0% Total Trade Thru GPITC $0 $61,889 $161,646 $234,364 $114,476 $0 $68,524 $0 #DIV/0! $68,524 #DIV/0! % Total Trade with Canada 0.0% 0.0% 0.0% 0.0% 0.0% 0.0% 0.0% 0.0% 0.0% GPITC #DIV/0! Truck Exports $186,246,480 $154,954,700 $227,317,099 $226,043,523 $343,225,755 $383,067,528 $280,604,181 -$102,463,347 -26.7% $94,357,701 50.7% % of Total Exports to Canada 13.9% 10.9% 15.7% 16.4% 21.4% 33.7% 24.7% -9.0% 10.8% Imports $179,359,926 $280,604,523 $347,895,554 $598,355,761 $443,748,399 $222,854,475 $228,951,161 $6,096,686 2.7% $49,591,235 27.6% % of Total Imports to Canada 22.2% 27.3% 34.0% 44.6% 40.6% 29.1% 27.1% -2.0% 4.9% Total Truck Trade Thru GPITC $365,606,406 $435,559,223 $575,212,653 $824,399,284 $786,974,154 $605,922,003 $509,555,342 $120,391,128 -15.9% $143,948,936 39.4% % Total Trade with Canada 17.0% 17.8% 23.3% 30.3% 29.2% 31.9% 25.7% -6.1% 8.7% Rail Exports $22,063,120 $34,509,908 $33,724,273 $42,751,722 $92,538,111 $42,712,019 $20,896,293 -$21,815,726 -51.1% -$1,166,827 -5.3% % of Total Exports to Canada 1.6% 2.4% 2.3% 3.1% 5.8% 3.8% 1.8% -1.9% 0.2% Imports $80,633,282 $52,720,174 $31,813,352 $83,424,683 $43,792,328 $20,889,485 $38,294,891 $17,405,406 83.3% -$42,338,391 -52.5% % of Total Imports to Canada 10.0% 5.1% 3.1% 6.2% 4.0% 2.7% 4.5% 1.8% -5.5% Total Rail Trade Thru GPITC $102,696,402 $87,230,082 $65,537,625 $126,176,405 $136,330,439 $63,601,504 $59,191,184 -$926,241 -6.9% -$43,505,218 -42.4% % Total Trade with Canada 4.8% 3.6% 2.7% 4.6% 5.1% 3.3% 3.0% -0.4% -1.8% TOTAL Exports $208,309,600 $189,464,608 $261,041,372 $268,795,245 $435,763,866 $425,779,547 $301,500,474 -$124,279,073 -29.2% $93,190,874 44.7% % of Total Exports to Canada 14.9% 12.6% 15.9% 17.2% 22.9% 33.5% 24.5% -9.0% 9.7% Imports $259,993,208 $333,324,697 $379,708,906 $681,780,444 $487,540,727 $243,743,960 $267,246,052 $23,502,092 9.6% $7,252,844 2.8% % of Total Imports to Canada 20.0% 20.6% 25.2% 36.5% 32.6% 25.2% 24.9% -0.3% 4.9% Total Trade Thru GPITC $468,302,808 $522,789,305 $640,750,278 $950,575,689 $923,304,593 $669,523,507 $568,746,526 $119,464,887 -15.1% $100,443,718 21.4% % Total Trade with Canada 17.3% 16.7% 20.4% 27.7% 27.1% 29.9% 24.7% -5.2% 7.4%
- 9. Mexico Colorado Trading Relationships -- 2004 - 2010 Domestic Canada Leading Exports from Colorado to Canada 2010 Leading Exports from Colorado to Canada (Su 2009 2010 (Surface Transportation) 2010 Rank Export Rank Alberta Export 1 2 Meat and Edible Offal $235,999,449 1 84 Computer-Related Machinery and Parts $51,563,345 2 27 Mineral Fuels; Oils and Waxes $201,498,538 2 73 Articles of Iron and Steel $20,561,915 3 84 Computer-Related Machinery and Parts $182,928,842 3 63 Other Made up Textile Articles $14,580,004 4 90 Measuring and Testing Instruments $80,561,414 4 90 Measuring and Testing Instruments $13,008,959 5 73 Articles of Iron and Steel $63,568,312 5 87 Vehicles Other than Railway $12,386,479 6 85 Electrical Machinery; Equipment and Parts $63,081,310 6 39 Plastics and Articles $11,704,855 7 39 Plastics and Articles $39,914,931 7 29 Organic Chemicals $9,521,293 8 87 Vehicles Other than Railway $36,586,199 8 2 Meat and Edible Offal $7,875,930 9 63 Other Made up Textile Articles $30,235,324 9 28 Inorganic Chemicals $7,024,720 10 76 Aluminum and Articles $25,847,110 10 85 Electrical Machinery; Equipment and Parts $6,725,852 2010 Leading Imports to Colorado from Canada 2010 Rank Import 2010 Leading Exports from Colorado to Canada 2010 1 27 Mineral Fuels; Oils and Waxes $2,343,388,848 Rank British Colombia Export 2 84 Computer-Related Machinery and Parts $129,738,541 1 84 Computer-Related Machinery and Parts $37,849,575 3 1 Live Animals $109,247,800 2 2 Meat and Edible Offal $16,312,425 4 73 Articles of Iron and Steel $103,196,106 3 73 Articles of Iron and Steel $9,067,706 5 44 Wood and Articles $84,061,106 4 39 Plastics and Articles $7,524,122 6 98 Special Classification Provisions $68,375,211 5 85 Electrical Machinery; Equipment and Parts $7,319,124 7 39 Plastics and Articles $63,670,218 6 21 Miscellaneous Edible Preparations $6,789,272 8 36 Explosives $60,007,739 7 87 Vehicles Other than Railway $6,500,841 9 85 Electrical Machinery; Equipment and Parts $58,674,982 8 72 Iron and Steel $6,227,873 10 48 Paper and Paperboard $52,266,866 9 94 Furniture; Lamps and Prefabricated $3,869,941 Rank Import 10 90 Measuring and Testing Instruments $3,780,405 1 27 Mineral Fuels; Oils and Waxes $2,343,388,848 2 84 Computer-Related Machinery and Parts $129,738,541 2010 Leading Exports from Colorado to Canada 2010 3 1 Live Animals $109,247,800 Rank Saskatchewan Export 4 73 Articles of Iron and Steel $103,196,106 1 84 Computer-Related Machinery and Parts $37,849,575 5 44 Wood and Articles $84,061,106 2 2 Meat and Edible Offal $16,312,425 6 98 Special Classification Provisions $68,375,211 3 73 Articles of Iron and Steel $9,067,706 7 39 Plastics and Articles $63,670,218 4 39 Plastics and Articles $7,524,122 8 36 Explosives $60,007,739 5 85 Electrical Machinery; Equipment and Parts $7,319,124 9 85 Electrical Machinery; Equipment and Parts $58,674,982 6 21 Miscellaneous Edible Preparations $6,789,272 10 48 Paper and Paperboard $52,266,866 7 87 Vehicles Other than Railway $6,500,841 8 72 Iron and Steel $6,227,873 9 94 Furniture; Lamps and Prefabricated $3,869,941 10 90 Measuring and Testing Instruments $3,780,405