
Recomendados
Mais conteúdo relacionado
Semelhante a Planitulsa Southwest Screen
Semelhante a Planitulsa Southwest Screen (20)
Mais de Janet Tharp
Último
Último (20)
Planitulsa Southwest Screen
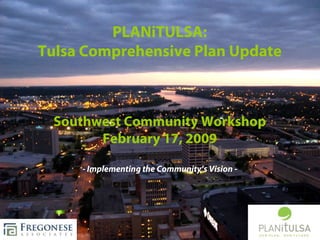
- 1. PLANiTULSA: Tulsa Comprehensive Plan Update Southwest Community Workshop February 17, 2009 - Implementing the Community’s Vision -
- 2. PLANiTULSA Process 1 2 3 4 Citizen Committee Citizen input is Residents and Citizens participate establishes Guiding captured on maps in citywide and stakeholders Principles and to show desired community-based are polled meets regularly to future development workshops to review progress about their gather input for shared vision ideas for PLANiTULSA
- 3. PLANiTULSA Process 5 6 7 8 Indicators are Scenarios are A shared vision for Citizens review established to the future is scenarios and vote created that evaluate each created reflecting on their desired answer the scenario’s impact citizen input future question, “If we do on Tulsa’s future this, what would happen?”
- 4. PLANiTULSA Process Tulsa moves to a 9 10 11 12 great future! Open Houses Public Hearings A plan is built Strategies held to gain and around the are Adoption strategies – with public review developed implementation and comment measures, funding to move strategies and a Tulsa monitoring plan towards the shared vision
- 6. What happens after the workshop? Each table’s plan is analyzed… ….and all notes and comments are recorded
- 7. GIS Analysis Each map was photographed, digitized, and entered into GIS
- 8. From Workshop to Plan From multiple workshop To our analysis maps… software…
- 9. From Workshop to Plan … to a concept plan for the area.
- 10. Sample Digitized Map University of Tulsa Zoo Downtown Urban Airport Main Street Transit Development I-244 Village Business Park Downtown Commercial Center Strip Center Light Industrial Urban Neighborhood Refineries Small Lot Subdivision Residential Subdivision Large Lot Subdivision Peoria Skelly Drive
- 11. All Chips Placed University of Tulsa Zoo Downtown Urban Airport Main Street Transit Development I-244 Village Business Park Downtown Commercial Center Strip Center Light Industrial Urban Neighborhood Refineries Small Lot Subdivision Residential Subdivision Large Lot Subdivision Peoria Skelly Drive
- 12. Total Number of “Hits” Any Chip University of Tulsa Zoo Frequency Airport 1 2-4 I-244 5-8 9 - 12 Downtown 13 - 18 19 - 24 25 - 49 Refineries Peoria Skelly Drive
- 13. Total Number of Households University of Tulsa Zoo Total Households Airport 1 - 150 151 - 300 I-244 301 - 900 901 - 2,400 Downtown 2,401- 7,500 Refineries *Total Peoria housing chips placed on a Skelly Drive cell
- 14. Total Number of Employment Chips University of Tulsa Zoo Airport I-244 Downtown Refineries *Total jobs Peoria chips placed on a cell Skelly Drive
- 15. Transportation: Input from Workshop Bicycle & Pedestrian Networks Transit Roadways & Highways Participants drew in new New bus route transportation infrastructure These were then New roads New digitized, like the bike chips paths
- 16. Transportation: All Lines Drawn University of Tulsa Zoo Frequency All Airport 1 -4 5-8 I-244 9 - 16 17 - 24 Downtown 25 - 41 Refineries Peoria Skelly Drive
- 17. Transportation: Roads University of Tulsa Zoo Road Frequency Airport 1-2 3-4 I-244 5-6 Downtown Refineries Peoria Skelly Drive
- 18. Transportation: Transit University of Tulsa Zoo Transit Frequency Airport 1-4 5-8 I-244 9 -15 17 - 24 Downtown 25 - 39 Refineries Transit investment was by far the most popular Peoria transportation investment Skelly Drive
- 19. Transportation: Bike and Walk Trails University of Tulsa Zoo Trails Frequency Airport 1-2 3-4 I-244 5 -6 7-9 Downtown Refineries Peoria Skelly Drive
- 20. Tonight’s Goals for the Workshop • We are learning from you: How future growth should take shape in this small area Open space and environmental conservation Urban and transportation design Housing and economic development
- 21. Workshop Overview Interactive Mapping Exercise • Focuses on land use and development patterns • Teams of 6-10 citizens will create a vision of how this neighborhood could look in the future • Create a map for the future of your neighborhood • Share results with your neighbors and the rest of the group
- 22. Example: Preliminary Results From the North Tulsa Community Workshop
- 23. North Tulsa – All Chips State Hwy 75
- 24. North Tulsa – All Chips (2 Hits) State Hwy 75
- 25. North Tulsa – Hits State Hwy 75
- 26. North Tulsa – Mixed-Use State Hwy 75
- 27. North Tulsa – Employment State Hwy 75
- 28. North Tulsa – Commercial State Hwy 75
- 29. North Tulsa – Residential State Hwy 75
- 30. North Tulsa – Civic State Hwy 75
- 31. North Tulsa – Open Space State Hwy 75
- 33. North Tulsa Land Use & Constraints
- 36. Today
- 37. Conceptual Design Based on Workshop
- 38. The Future?
- 43. Southwest Workshop Base Map Components
- 44. Southwest Tulsa Aerial Southwest Blvd I 244 Crystal City Shopping Center
- 45. Southwest Tulsa Streams Southwest Blvd I 244 Crystal City Shopping Center
- 46. Southwest Tulsa Floodplain Southwest Blvd I 244 Crystal City Shopping Center
- 47. Southwest Tulsa Bus Lines Southwest Blvd I 244 Crystal City Shopping Center
- 48. Southwest Tulsa Trails Southwest Blvd I 244 Crystal City Shopping Center Planned Bikeway
- 49. Southwest Tulsa Workshop Map
- 50. Southwest Tulsa Demographic and Housing figures were taken from the 2000 Census Block Groups around the Study Area
- 51. Southwest Tulsa Some Basic Demographic Info Citywide Southwest Tulsa Study Area Total Population 7,342 Households 3,026 Average Household Size 2.4 2.2 Source: US Census Bureau 2000
- 52. Southwest Tulsa Household Income $100,000 + $75,000 to $99,999 $50,000 to $74,999 $40,000 to $49,999 Households $30,000 to $39,999 $20,000 to $29,999 $0 to $19,999 0 200 400 600 800 1000 Source: US Census Bureau 2000
- 53. Southwest Tulsa Housing Units in Structure 50 + 10 - 49 5-9 Renter Owner 2-4 1 attached 1 detached 0 500 1,000 1,500 2,000 2,500 Source: US Census Bureau 2000
- 54. Southwest Tulsa Housing Profile Southwest Tulsa Study Area Number % City- wide Owner-Occupied 2,206 74% 55% Renter-Occupied 788 26% 45% Total Occupied Housing Units 2,994 100% 100% Source: US Census Bureau 2000, ACS 2006 (citywide)
- 55. Southwest Tulsa Owner households paying 30% or more of income to housing 1200 1000 800 Affordable 600 Unaffordable 400 22% 200 0 Owners with Mortgages Source: US Census Bureau 2000
- 56. Southwest Tulsa Renter households paying 30% or more of income to housing 200 180 160 Households 140 120 Affordable 100 Unaffordable 80 60 40 20 0 0 e 00 99 99 99 Household or 00 ,0 ,9 ,9 ,9 m 0, 19 34 49 74 Income $1 or -$ -$ -$ -$ < 0 00 0 0 0 00 00 00 00 0 5, 0, 0, 5, 0, $7 $1 $2 $3 $5 Source: US Census Bureau 2000
- 57. Infill opportunities are all around us!
- 58. How does a place change?
- 59. Infill opportunities are all around us! El Centro, California
- 60. Infill opportunities are all around El Centro, California
- 65. northrup commons portland, oregon
- 70. What makes people walk? – Walkable Distances
- 71. What makes people walk? – Practical Destinations
- 72. What makes people walk? – Pleasant and interesting environment at a human scale
- 73. Walkable Neighborhoods In most conventional suburban Walkable neighborhoods have development, streets separate uses, streets that connect uses, with discouraging walking and forcing even arterials reserved for through local trips onto arterial roads. traffic.
- 74. Pedestrians in the Conventional Suburban Development supporting alternative modes through urban design
- 75. Small Area Workshop Process • Teams of 6-10 persons • Develop your vision • Share results with the group and look for common themes
- 76. The Workshop Exercise You will build your own scenario for this area 1. Decide where NOT to grow 2. Arrange chips on map in areas of change 3. Draw in roads, paths, trails and transit needed 4. Draw open space, parks and plazas needed 5. Present Map to Group
- 77. Workshop Map
- 78. The Game Pieces Las piezas del Juego Commercial Mixed Use Employment Comercial Uso Mixto Empleo Civic Open Space Residential Uso Cívico Espacios Abiertos Residencial
- 79. Mixed Use Housing Over Retail
- 80. Mixed Use Housing Over Retail
- 81. Mixed Use – Office & Residential Over Retail
- 82. Mixed Use – Office Over Retail
- 83. Mixed Use – Live-Work Units Texas Pic?
- 84. Employment – Research & Development / Office
- 86. Commercial – Restaurant, Fitness Center, Bed & Breakfast
- 87. Commercial - Restaurant, Fitness Center, Bed & Breakfast
- 88. Commercial – Grocery, Deli/Bakery, Café/Coffee Shop
- 89. Commercial – Retail Shops, Book Store, Art Gallery Dallas, TX
- 90. Residential – Standard Single Family
- 91. Residential – Residencial Small Lot Single Family Casas separadas en terrero pequeño
- 92. Residential – Green-Court Single Family
- 94. Civic – Parking Lot or Structure
- 95. Civic - Transit Station, Park & Ride Plano, TX
- 96. Civic - Day Care, Recreation Center, Library, Senior Center
- 97. Civic - Day Care, Recreation Center, Library, Senior Center
- 98. Landscape & Streetscape – Plaza, Fountain, Pocket Park, Gateway, Village Green
- 99. Landscape & Streetscape – Bus Shelter, Crosswalk, Trail, Sidewalk Improvement
- 100. Landscape & Streetscape – Bus Shelter, Crosswalk, Trail, Sidewalk Improvement
- 101. Connectivity - Pedestrian, Bicycle, and Auto
- 102. Connectivity - Pedestrian, Bicycle, and Auto
- 103. Step 1: Introduce yourself! Set goals for your table
- 104. Step 2: Familiarize yourself with the workshop materials The Chips The Workshop Map Scissors Sharpie Pens
- 105. Step 3: Review the map and your goals
- 106. Step 4: Decide where NOT to grow Designate desired: • Open space, green corridors and conservation areas • Historic districts and other significant areas
- 107. Step 5: Experiment with Chip Arrangements • Cut out your chips and begin placing them in strategic locations – but don’t glue them down yet!
- 108. Step 6: Draw transportation infrastructure Bicycle & Pedestrian Networks Transit Roadways & Highways New roads Especially le in areas p you am expect to S have new jobs or housing! New bus route
- 109. Step 7: Stick down your chips Once you have all come to an agreement on the vision, glue your chips down
- 110. Step 8: Name your map and choose a presenter
- 111. Step 9: Present your vision
- 112. Step 10: Workshop & scenario results will be placed on PLANiTULSA website • Everyone will be able to review the workshop map results and scenarios on the web: www.planitulsa.org
- 113. Let the Workshop Begin…