SlideShare uma empresa Scribd logo
1 de 226
Baixar para ler offline
D 2.2 Analysis of Innovative Challenges
1/226
ECP-2008-GEO-318007
Plan4all
Analysis of Innovative Challenges
Deliverable number D2.2
Dissemination level Public
Delivery date 16th
November 2009
Status Final
Authors
Clemens Beyer (CEIT Alanova)
Wolfgang W. Wasserburger (CEIT Alanova)
Runar Bergheim (AviNet), Pēteris Brūns (TDF),
Karel Charvat (HSRS), Miroslav Dvorak
(Olomouc), Petr Horak (HF), Julia Neuschmid
(CEIT Alanova), Dimitrov Stelian (EPF), Norma
Zanetti (Hyperborea)
eContentplus
This project is funded under the eContentplus programme1,
a multiannual Community programme to make digital content in Europe more accessible, usable and exploitable.
1
OJ L 79, 24.3.2005, p. 1.
D 2.2 Analysis of Innovative Challenges
2/226
1 Abstract
Plan4all is a European project dealing with spatial planning data interoperability, har-
monisation and Spatial Data Infrastructure building. The project is organised in nine
work packages (WP), which are further structured into several tasks. This deliverable
presents the results of task 2.2 which is part of WP2 – the state of the art analysis –
and has the objective to analyse latest developments and innovative challenges in
SDI building for spatial planning in Europe. The objective of this deliverable is to
assist to pilot partners deploy their infrastructure in WP6.1, to prepare recommenda-
tion for possible platforms. The deliverable use results of other two deliverables D 2.1
―Identification of leading regional and local administration in building SDI for spatial
planning‖ describing the detailed situation in single European countries (the report
provides a general survey on SDI and spatial planning data in each partner country)
and D 2.3 ―INSPIRE Requirements Analysis‖, which analyses requirements coming
from INSPIRE directive. The results are based on an analysis of information about
relevant software classified according a framework for software classification based
on INSPIRE architecture, spataial planning needs and a collection of best practice
projects.
D 2.2 Analysis of Innovative Challenges
3/226
2 Contents
1 Abstract.............................................................................................................. 2
2 Contents............................................................................................................. 3
3 Introduction ....................................................................................................... 7
3.1 Objectives............................................................................................................. 7
3.2 Structure............................................................................................................... 7
3.3 Methodology......................................................................................................... 7
4 From Geographic Information Systems to Spatial Data Infrastructure
building...................................................................................................................... 9
4.1 History and state of the art.................................................................................. 9
4.1.1 Computer Aided Design (CAD).......................................................................................... 9
4.1.2 Geographic Information Systems (GIS)........................................................................... 10
4.1.3 Web Mapping................................................................................................................... 10
4.1.4 Service-Oriented Architecture.......................................................................................... 12
4.1.5 Web 2.0............................................................................................................................ 13
4.2 Standards ............................................................................................................13
4.2.1 W3C................................................................................................................................. 13
4.2.1.1 Extensible Markup Language (XML)....................................................................... 13
4.2.1.2 Simple Object Access Protocol (SOAP) ................................................................. 14
4.2.1.3 Web Service Description Language (WSDL).......................................................... 14
4.2.2 OASIS .............................................................................................................................. 15
4.2.2.1 ebXML..................................................................................................................... 15
4.2.2.2 UDDI........................................................................................................................ 15
4.2.3 OGC................................................................................................................................. 15
4.2.3.1 Geography Markup Language (GML) ..................................................................... 16
4.2.3.2 KML......................................................................................................................... 18
4.2.3.3 Web mapping services (WMS) ............................................................................... 18
4.2.3.4 Web Map Tile Server (WMTS)................................................................................ 18
4.2.3.5 Web feature services (WFS)................................................................................... 19
4.2.3.6 Web coverage services (WCS)............................................................................... 19
4.2.3.7 Styled Layer Descriptor (SLD) ................................................................................ 20
4.2.3.8 Web Map Context ................................................................................................... 20
4.2.3.9 Catalogue Service (CSW)....................................................................................... 20
4.2.3.10 Web Processing Services (WPS) ........................................................................... 21
4.2.4 ISO (International Standardisation Organisation) Metadata standards........................... 22
4.2.5 De Facto Standards......................................................................................................... 23
4.3 Policy...................................................................................................................23
4.3.1 INSPIRE........................................................................................................................... 23
4.4 Initiatives .............................................................................................................24
4.4.1 UNSDI.............................................................................................................................. 24
4.4.2 GMES .............................................................................................................................. 25
4.4.3 GEOSS ............................................................................................................................ 25
D 2.2 Analysis of Innovative Challenges
4/226
5 Framework for classifying technologies and services ................................ 26
5.1 Classification given by Plan4all extension of INSPIRE Networking
Architecture ....................................................................................................................26
5.2 Classification by standards................................................................................26
5.3 Classification by technology..............................................................................26
5.3.1 Client-Side (User Interface) ............................................................................................. 27
5.3.1.1 File transfer technology........................................................................................... 27
5.3.1.2 Thin Client Web Maps............................................................................................. 27
5.3.1.3 Thick Client Web Maps ........................................................................................... 27
5.3.1.4 Standalone Web Map Applications ......................................................................... 28
5.3.1.5 GIS with ability to use online data........................................................................... 28
5.3.1.6 Browser Extensions ................................................................................................ 28
5.3.1.7 Web-based 3D graphics.......................................................................................... 29
5.3.1.8 Web Browser with scripting extensions .................................................................. 30
5.3.2 Serverside........................................................................................................................ 30
5.3.2.1 Application server.................................................................................................... 30
5.3.2.2 Tile server and ―cookie cutter‖................................................................................. 30
5.3.2.3 File interpreting ....................................................................................................... 30
5.3.2.4 Mapserver with database backend ......................................................................... 31
5.3.2.5 Mapserver with more intelligent functions............................................................... 31
5.3.2.6 Middleware.............................................................................................................. 31
5.3.2.7 Geodatabases......................................................................................................... 31
5.4 Classification by Service....................................................................................31
5.4.1 State of the art ................................................................................................................. 31
5.4.1.1 Proprietary mapping services.................................................................................. 31
5.4.1.2 Direct SQL Requests to Geodatabases.................................................................. 31
5.5 Products ..............................................................................................................32
5.5.1 Template with answering suggestions............................................................................. 32
5.6 Selected Product overview.................................................................................33
6 Chances, potentials, risks of data infrastructure applications ................... 39
6.1 Data Storage........................................................................................................39
6.1.1 Any time access and combined access........................................................................... 39
6.1.2 Redundancy..................................................................................................................... 39
6.2 Data Display ........................................................................................................41
6.2.1 Generalisation.................................................................................................................. 41
6.2.2 Web mapping vs. cartography......................................................................................... 42
6.3 Legal obligation ..................................................................................................43
6.4 Incorrect data use...............................................................................................43
6.5 Derived datasets .................................................................................................43
6.6 Metadata ..............................................................................................................44
6.6.1 Metadata quality............................................................................................................... 44
7 Data evaluation and quality criteria ............................................................... 45
D 2.2 Analysis of Innovative Challenges
5/226
7.1 Why Data Quality? ..............................................................................................45
7.2 Aspects of Data Quality......................................................................................45
7.2.1 Accuracy .......................................................................................................................... 46
7.2.2 Completeness.................................................................................................................. 46
7.2.3 Consistency ..................................................................................................................... 47
7.2.4 Currency .......................................................................................................................... 47
7.2.5 Timeliness........................................................................................................................ 48
7.2.6 Volatility............................................................................................................................ 48
7.2.7 Accessibility ..................................................................................................................... 48
7.2.8 Interpretability .................................................................................................................. 48
7.3 How to Achieve Data Quality..............................................................................49
7.4 Summary .............................................................................................................49
8 Detailed examination of existing related EU initiatives and projects ......... 51
8.1 Initiatives, Projects and Best Practises in detail ..............................................51
8.1.1 Overview.......................................................................................................................... 51
8.1.2 Collection ......................................................................................................................... 53
8.2 Overview of the European Initiatives, Projects and Best Practise
Documentation .............................................................................................................103
8.2.1 Analysis of European Initiatives, Projects and Best Practise Documentation............... 103
8.2.1.1 Thematic Groups of projects................................................................................. 103
8.2.1.2 Used technology/software..................................................................................... 105
8.2.1.3 Accessibility........................................................................................................... 105
8.2.1.4 Weaknesses and challenges ................................................................................ 105
8.2.2 Comparison of Best Practise projects with Plan4all ...................................................... 108
8.3 Summary ...........................................................................................................110
9 Conclusion – Innovative Challenges ........................................................... 112
9.1 Complexity of planning process......................................................................112
9.2 Different legal context ......................................................................................113
9.3 Cross-border accuracy.....................................................................................113
9.4 Differences in the use of terms........................................................................114
9.5 Differences between cultures ..........................................................................114
9.6 Lack of topology ...............................................................................................114
9.7 Geodata and time..............................................................................................115
9.8 Technology........................................................................................................116
9.8.1 General .......................................................................................................................... 116
9.8.2 Alternative Methods ....................................................................................................... 116
9.8.2.1 Collaborative Mapping .......................................................................................... 116
9.8.2.2 Crowdsourcing ...................................................................................................... 117
9.9 Sustainability.....................................................................................................117
D 2.2 Analysis of Innovative Challenges
6/226
9.10 Organisational Challenges...............................................................................117
10 Sources and short Glossary ..................................................................... 118
10.1 Sources..............................................................................................................118
10.2 Glossary ............................................................................................................118
11 Annex A: Known Software ........................................................................ 119
11.1 Graphic Standards............................................................................................119
11.2 Commercial Software .......................................................................................121
11.3 Commercial Software (partly without costs)...................................................150
11.4 Open Source Software......................................................................................153
11.5 Portals ...............................................................................................................198
11.6 Popular services without costs........................................................................199
11.7 Open data projects............................................................................................201
12 Annex B: Survey results ........................................................................... 202
12.1 Assessment of national and regional policies................................................202
12.1.1 Legal Situation........................................................................................................... 202
12.1.2 Data Management..................................................................................................... 207
12.1.3 Survey answers regarding metadata......................................................................... 208
12.2 Spatial Data Infrastructures: State of the Art (survey evaluation).................211
12.2.1 SDI Organisation ....................................................................................................... 212
12.2.2 Interoperability and Metadata.................................................................................... 215
12.2.3 SDI Coordination ....................................................................................................... 218
12.2.4 National Geodatabases............................................................................................. 220
12.2.5 Conclusion from this section of the survey................................................................ 222
12.3 Used software ...................................................................................................223
D 2.2 Analysis of Innovative Challenges
7/226
3 Introduction
3.1 Objectives
Plan4all focuses on the interoperability and harmonisation of spatial planning data
based on the existing best practises in European regions and municipalities and the
results of current research projects. The project involves a detailed description and
summary of the current situation and standards, proposal, testing and implementation
of spatial planning metadata profile, common data model and harmonisation
procedures. The important parts of Plan4all are networking standards of spatial plan-
ning data, based on previously collected and analysed experiences. Furthermore,
common procedures and methods for spatial data sharing will be defined as well as
the use of new pan-European standards for spatial planning data within the EU.
Expected results from Plan4all are European forums for SDI (Spatial Data Infra-
structure) in spatial planning, a database and analysis in terms of organisation,
sharing and harmonisation as well as SDI recommendations for spatial planning.
Plan4all also focuses on implementing the INSPIRE Directive into the spatial plan-
ning process, mainly based on building spatial planning data models and metadata
profiles.
The project is structured into nine work packages. The aim of Work Package 2 (WP2)
is to analyse the current state of the art in spatial planning, the used technologies,
INSPIRE requirements and also to identify the requirements that affect the imple-
mentation of spatial planning SDI. Into more detail, the objective of the present Task
2.2 out of WP2 is to analyze latest developments and innovative challenges of SDI
for spatial planning in Europe.
3.2 Structure
This deliverable presents the results of WP2 Task 2.2 and aims to identify innovative
challenges in data harmonisation. The first step is to establish a framework for classi-
fying technologies and services with focus on technology convergence and the emer-
gence of applications. To test that framework a selection of known software packa-
ges was described (page 9). The detailed software descriptions are part of Annex A
(page 119). The two following chapters deal with the chances, potentials, risks of
data infrastructure applications (page 39) as well as data evaluation and quality
criteria (page 45). In addition there is a detailed examination of existing related EU
projects and a comparison of Best Practise Projects with Plan4all, identifying
strengths and weaknesses of spatial planning SDI implementation (page 51). For the
assessment of national and regional policies we refer to Deliverable 2.1. On this
basis we try to find a conclusion that defines the most innovative challenges on SDI
for the future (page 112).
3.3 Methodology
The results of Task 2.2 are based on a survey among both, all project partners and
the European members of the Paln4all partner ISOCARP. The survey is shared with
D 2.2 Analysis of Innovative Challenges
8/226
Task 2.1. Besides, there is a documentation of well known software and of best
practise projects that have been collected providing a template questionnaire.
Into more detail the survey covers a wide range of topics describing the present
situation in spatial planning in each partner country and its subsidiaries. It includes
basic information like the availability of plans and the legal situation, cross-border
initiatives, data availability and data management, metadata collection, web mapping
activities, spatial data infrastructures, national geodatabases and data license
models. The survey was also forwarded to the large number of international mem-
bers of the project partner ISOCARP so that valuable information could be also
retrieved from outside the Plan4all consortium, too. The results of this survey are
used in task 2.1 and 2.2 to find out about correlations between the legal situation, the
availability of plans and the accessibility of data, in terms of harmonising activities
and efforts in building a national SDI.
The classification and description of software was done according to a developed
framework containing information about the product version, manufacturer, develop-
ping period, type, approach, interactivity, technology, metadata management, usage
in planning and challenges. A table with the collected software information provides
an overview of existing spatial planning related software and classifies suitable soft-
ware for Plan4all.
The documentation of the best practise projects contains detailed information about
the project type, dimension, start, end, partners, goals and content, used technology,
strengths and weaknesses, accessibility, user interface and challenges. All together
more than 40 best practise projects in Europe could be identified, described and
analysed.
The complete list of best practise projects and the software classifications can be
found in the Annex A (page 119) and also on the internal project wiki. The wiki serves
as an online platform that gives access to all project partners and contains all papers,
documents, surveys that have been produced so far. In addition to communication
via web seminars and workshops are organised, especially the meeting in Schwechat
on September 14th
and 15th
, 2009 and the external Expert Workshop hosted by the
University of Rome on October, 5th
2009. The purpose on the one hand was to share
information and results on WP2 among the partners on the other hand to get
feedback by an external consultation of experts to avoid blindness by routine.
Experts especially invited to review this deliverable were Michele Campagna (I),
Pawel Decewicz (PL) and Gabor Remetey-Fülöpp (H).
D 2.2 Analysis of Innovative Challenges
9/226
4 From Geographic Information Systems to Spatial Data
Infrastructure building
A spatial data infrastructure (SDI) is a framework of spatial data, metadata, users and
tools that are interactively connected in order to use spatial data. Current Spatial
Data Infrastructure (SDI) development is combination of data, technologies and
standards and legislation and also by implementation initiatives. On the technological
side current SDI is mainly based on Web Mapping and Service Oriented Architecture
(SOA) and currently also by newly coming Web 2.0 approach. Some of the main
principles are that data and metadata should not be managed centrally, but by the
data originator respectively owner, and that tools and services connect via computer
networks to the various sources. A GIS is often the platform for deploying an
individual node within an SDI. To achieve these objectives, good coordination
between all the actors is necessary and the definition of standards is very important.
Spatial data infrastructure (SDI) is a kind of a service oriented architecture (SOA) and
covers a variety of services: discovery services, view services, download services,
transformation services and services allowing spatial data services to be invoked.
Spatial Data Infrastructure is service based combination of Web Mapping, but also
standalone GIS and eventually CAD applications. So there is a short introduction
about the development and history of such systems.
From the point of view of standardisation the most adequate are effort of Open
Geospatial Consortium, ISO, W3C and OASIS. Legislation is defined by INSPIRE
directive and implementation of SDI is supported by different European and World
wide initiatives as GMES, UNSDI and GEOSS.
4.1 History and state of the art
Since web mapping is very much based on ideas used by CAD and GIS there is a
short introduction about the development and history of such systems.
4.1.1 Computer Aided Design (CAD)
First Computer Aided Design systems came up in the 1970s. In its first days it only
served as an equivalent for manual drawing and construction desks. Whereas in the
late 1980s with the change to Personal Computers and the addition of 3d Functions
CAD Systems got more and more the function of integrated construction systems not
only as a graphical representation of already constructed parts.
Beginning with the late 1980s in some places still in use, CAD systems were also
used to store geographical data. As the needs to represent the earth surface (e. g.
different projections) differ a little bit from mechanical parts and geographic users
also wanted to store database entries with their features and use some basic
geographic functions. Consequently new, so called Geographic Information Systems
were developed based upon CAD and database principles.
CAD systems typically follow the motto that every feature is drawn in its final
representation (‗What you see is what you get‘ – ‗Wysiwyg‘) whereas the upcoming
D 2.2 Analysis of Innovative Challenges
10/226
Geographic systems store features without a special graphical representation and
produce that upon database items.
In the time being some complex CAD systems integrated also GIS functions or put
hybrid systems into market. A typical system that follows this approach is Autodesk
Map which combines the fully featured 3d AutoCAD with 2d GIS functions.
4.1.2 Geographic Information Systems (GIS)
It is difficult to be defined when exactly the contemporary GIS technology was estab-
lished, because GIS technology evolved through multiple parallel but separate appli-
cations across numerous disciplines and researchers. One of the most important
facts of the GIS history was the development of the GBF-DIME files by the U.S. Cen-
sus Bureau in the 1960s which is one of the first examples of governmental initiative,
using digital mapping and digital spatial data. Later that initiative led to the develop-
ment of the Census TIGER files, which are in use today. In the 1970s the further
development of the GIS technology continued mainly within the universities, where
the first approaches and prototypes for the later so called Geographic Information
Systems were developed. Such prototype is the program SYMAP, developed at the
Laboratory for Computer Graphics and Spatial Analysis at the Harvard Graduate
School of Design in 1966, which was widely distributed and served as a model for
later systems. One of the most important pioneering projects from that period is the
so called Canada Geographic Information System (CGIS). It was developed in the
1960s and 1970s to assist in regulatory procedures of land-use management and
resource monitoring. This simple automated computer processes designed to store
and process large amounts of spatial data enabled Canada to begin a national land-
use management program and become a foremost promoter of geographic informa-
tion systems (GIS).
With the upcoming graphical user interfaces these systems were first used outside of
universities and programming companies in the late 1980s. Opposite to CAD
systems their advantage was that features could be printed (to screen or paper) in
different variations depending from database entries. Besides, these new geographic
functions allowed the overlay of different datasets and the automatic creation of
combined datasets. Later on also map projections of the earth were fully integrated
and graphical retrieving data became more and more easy.
Whereas these systems followed the CAD approach to store explicitly borders
between features (Vector GIS), alternatives were developed in Raster GIS which
stored all values for every single cell. At first this approach was mainly used because
of memory and CPU restrictions. However, nowadays such systems are mainly used
for remote sensing data or to represent continuous changing data.
Today nearly all systems allow the use of both approaches.
4.1.3 Web Mapping
With the upcoming of the World Wide Web (WWW), first ideas came up how to
represent maps in the Web. As a first approach pictures were placed in HTML pages
originating from scans of paper material or electronic drawings.
D 2.2 Analysis of Innovative Challenges
11/226
Shortly after the web gathered momentum, first applications were developed which
generated HTML pages on the fly based upon database entries. Shortly afterwards
people also began to think about dynamically generated maps for the web.
First approaches used manually tiled maps and combined them e. g. dynamically
with points of interest. While this was based upon manual work it was rarely used for
more than one city.
Because of very complex developments it took some years before the first
commercially programmed web map servers were introduced to the public in the late
1990s. Most of them follow the approach to tile pre produced huge bitmaps on the fly
or produce small tiles out of vector data dynamically (e. g. ArcView IMS). Only few
other products tried to serve vector data to dedicated HTML clients (e. g. Arc-
Explorer) or browser extensions (Java Applets, Netscape PlugIns or Microsoft
Internet Explorer ActiveX; e. g. Autodesk MapGuide). Whereas the first approach
was restricted by serverside CPUs and the size because of small bandwidths, the
second approach had the disadvantage of downloading (or getting on disks) and
installing extensions.
Based on today‘s bandwidths these problems no longer exist in many countries and
developers got the chance to decide which approach to use upon user and
application requirements.
As another indirect change in the information business open source technologies
became more important. Nowadays open source products are market leader in web
mapping.
Web mapping is understood as implementation of automatically generated maps
through internet infrastructure. The term web GIS is often used simultaneously but
the meaning of web GIS is much wider as it also includes analysis and geoproces-
sing functions whereas web mapping just deals with map generation, display and
navigation within the map. As web mapping tools become more and more powerful,
the border between web mapping and web GIS is, however, not always clear. Further
on, only the term ―web mapping‖ (or ―web map‖) will be used.
Web maps are mainly dissemination media, i. e. they serve as visualisation tool for
geodata which are queried from one or more (also distributed) servers. One of the
huge advantages of this technology is the fact that data updates are very simple: As
the source data on a map server is altered, all web mapping clients will instantly also
receive the updated datasets, having no need to update every single client on its
own.
Beside that modern upcoming web services are enabled to use disperse stored data.
D 2.2 Analysis of Innovative Challenges
12/226
A short overview:
Fig. 1: Web Mapping Application Overview
A spatial data infrastructure (SDI) is a framework of spatial data, metadata, users and
tools that are interactively connected in order to use spatial data.
Some of the main principles are that data and metadata should not be managed
centrally, but by the data originator respectively owner, and that tools and services
connect via computer networks to the various sources. A GIS is often the platform for
deploying an individual node within an SDI. To achieve these objectives, good
coordination between all the actors is necessary and the definition of standards is
very important.
Spatial data infrastructure (SDI) is a kind of a service oriented architecture (SOA) and
covers a variety of services: discovery services, view services, download services,
transformation services and services allowing spatial data services to be invoked.
4.1.4 Service-Oriented Architecture
In computing, service-oriented architecture (SOA) provides a set of principles of
governing concepts used during phases of system development and integration.
Such an architecture will package functionality as interoperable services: software
modules provided as a service can be integrated or used by several organisations,
even if their respective client systems are substantially different.
Web services can implement a service-oriented architecture. Web services make
functional building-blocks accessible over standard Internet protocols independent of
Web Mapping Server
Users Database
Geodatabases
Geodata file archive
Mobile Users
Web Mapping Application Overview
Application Server
D 2.2 Analysis of Innovative Challenges
13/226
platforms and programming languages. These services can be new applications or
just wrapped around existing legacy systems to make them network-enabled.
Each SOA building block can play one or both of two roles:
a) server;
b) server and client;
c) client.
The current development of SOA is mainly defined by consortiums W3C, OASIS and
in SDI by Open Geospatial Consortium.
4.1.5 Web 2.0
Web 2.0 is commonly associated with web applications which facilitate interactive
information sharing, interoperability, user-centered design and collaboration on the
World Wide Web. Examples of Web 2.0 include web-based communities, hosted
services, web applications, social-networking sites, video-sharing sites, wikis, blogs,
mashups and folksonomies. A Web 2.0 site allows its users to interact with other
users or to change website content, in contrast to non-interactive websites where
users are limited to the passive viewing of information that is provided to them. As
example of Web 2.0 application could be mentioned GoogleMaps or OpenStreetMap.
Google Maps also offer full interactivity as users can draw their own content directly
into the map. In contrast to WFS-T, Google has a strict distinction between user
generated content and original content provided by the company itself which is also a
form of a digital rights management. However, Google Maps are not fully OGC
compliant: WMS can be shown in Google applications but Google data cannot be
accessed via WMS requests.
OpenStreetMap: Beside the Google Applications OpenStreetMap offers its own
standards as an open alternative; since more than 100,000 contributors work on the
maps it is emerging like Wikipedia and cannot be ignored in some situations where
planning data is rare.
4.2 Standards
4.2.1 W3C
The World Wide Web Consortium (W3C) is an international community based on
member participation, which defines the standard for World Wide Web. Currently, the
most relevant standards for SDI building are XML, SOAP and WSDL.
4.2.1.1Extensible Markup Language (XML)
XML (Extensible Markup Language) is a set of rules for encoding documents
electronically. It is a textual data format, with strong support via Unicode for the
languages of the world. XML is used as common interface for many applications,
there also exist several schema systems designed to aid in the definition of XML-
based languages.
D 2.2 Analysis of Innovative Challenges
14/226
A XML document is a string of characters. The characters could be markup or
content. They are distinguished by the application of simple syntactic rules. Markup
either begin with the character "<" and end with a ">", or begin with the character "&"
(ampersand) and end with a ";" (semicolon). Strings of characters which are not
markup are content. Tags are a markup beginning with "<" and ending with ">".
Elements are a logical component of a document which either begins with a start-tag
and ends with a matching end-tag, or consists only of an empty-element tag. The
characters between the start- and end-tags are content. Attribute are a markup
construct consisting of a name/value pair that exists within a start-tag or empty-
element tag.
Software which processes an XML document are called processor. It works in the
service of an application. The processor is often referred to colloquially as an XML
parser.
4.2.1.2Simple Object Access Protocol (SOAP)
SOAP is a basic protocol supporting exchange of structured information for Web
Services. It is based on Extensible Markup Language (XML) as its message format.
SOAP provides a basic messaging framework for Web service.
SOAP is composed from several layers:
 message exchange patterns (MEP),
 underlying transport protocol bindings,
 message processing models,
 protocol extensibility.
Both SMTP and HTTP are valid application layer protocols used as transport for
SOAP, but HTTP has gained wider acceptance as it works well with today's Internet
infrastructure; specifically, HTTP works well with network firewalls. SOAP may also
be used over HTTPS.
XML is used as the standard message format because of its widespread use by
major corporations and open source development efforts.
4.2.1.3Web Service Description Language (WSDL)
WSDL is an XML format for describing network services as a set of endpoints
operating on messages containing either document-oriented or procedure-oriented
information. The operations and messages are described abstractly, and then bound
to a concrete network protocol and message format to define an endpoint. Related
concrete endpoints are combined into abstract endpoints (services). WSDL is
extensible to allow description of endpoints and their messages regardless of what
message formats or network protocols are used to communicate, however, the only
bindings described in this document describe how to use WSDL in conjunction with
SOAP 1.1, HTTP GET/POST, and MIME.
WSDL is an XML format for describing network services as a set of endpoints
operating on messages containing either document-oriented or procedure-oriented
D 2.2 Analysis of Innovative Challenges
15/226
information. The operations and messages are described abstractly, and then bound
to a concrete network protocol and message format to define an endpoint. Related
concrete endpoints are combined into abstract endpoints (services). WSDL is
extensible to allow description of endpoints and their messages regardless of what
message formats or network protocols are used to communicate, however, the only
bindings described in this document describe how to use WSDL in conjunction with
SOAP 1.1, HTTP GET/POST, and MIME.
4.2.2 OASIS
OASIS (Organisation for the Advancement of Structured Information Standards) is a
non-profit consortium that drives the development, convergence and adoption of
open standards for the global information society. The consortium produces more
Web service standards than any other organisation along with standards for security,
eBusiness, and standardisation efforts in the public sector and for application-specific
markets. Two main relevant standards of OASIS are ebXML and UDDI.
4.2.2.1ebXML
Electronic Business using eXtensible Markup Language, commonly known as e-
business XML a family of XML based standards sponsored by OASIS and
UN/CEFACT. There exist 6 specifications, 5 parts of the work were submitted to ISO
TC 154 for approval. The International Organization for Standardization (ISO) has
approved the following five ebXML specifications as the ISO 15000 standard, under
the general title, Electronic business eXtensible markup language:
 ISO 15000-1: ebXML Collaborative Partner Profile Agreement
 ISO 15000-2: ebXML Messaging Service Specification
 ISO 15000-3: ebXML Registry Information Model
 ISO 15000-4: ebXML Registry Services Specification
 ISO 15000-5: ebXML Core Components Technical Specification
4.2.2.2UDDI
Universal Description, Discovery and Integration (UDDI) is a platform-independent,
Extensible Markup Language (XML)-based registry for businesses worldwide to list
themselves on the Internet. The UDDI was integrated into the Web Services Intero-
perability (WS-I) standard as a central pillar of web services infrastructure. The UDDI
specifications supported a publicly accessible Universal Business Registry in which a
naming system was built around the UDDI-driven service broker.
4.2.3 OGC
The Open Geospatial Consortium, Inc (OGC) is an international industry consortium
of companies, government agencies and universities participating in a consensus
process to develop publicly available interface standards. OpenGIS® Standards
support interoperable solutions that "geo-enable" the Web, wireless and location-
based services, and mainstream IT. The standards empower technology developers
D 2.2 Analysis of Innovative Challenges
16/226
to make complex spatial information and services accessible and useful with all kinds
of applications. The OGC adopted sets of standards, which are important for Plan4all
implementation.
4.2.3.1Geography Markup Language (GML)
The Geography Markup Language (GML) is an XML grammar for expressing
geographical features. It serves as a modelling language for geographic systems as
well as an open interchange format for geographic transactions on the internet. As
with most XML based grammars, there are two parts to the grammar – the schema
that describes the document and the instance document that contains the actual
data, i. e. the spatial and non-spatial properties of geographic features. The encoding
is done in compliance with ISO 19118 for the transport and storage of geographic
information modeled according to the conceptual modeling framework used in the
ISO 19100 series of International Standards and including both the spatial and non-
spatial properties of geographic features. GML serves as a modelling language for
geographic systems as well as an open interchange format for geographic
transactions on the Internet. The concept of features in GML is a very general one
and includes not only conventional ―vector" or discrete objects, but also coverage and
sensor data. The ability to integrate all forms of geographic information is a key
element for the use of GML.
Since 2007 GML is published as ISO standard ISO 19136:2007.
The previous version (2.1.2) of GML was concerned with what the OGC calls simple
features: features whose geometric properties are restricted to ―simple‖ geometries.
For example, a city could be represented as a feature collection where the individual
features represent such things as rivers, roads and colleges. Each of these feature
types would have named and typed properties.
The 3.0 version of GML addresses needs that were not addressed or adequately met
in previous versions, and in particular:
 simple 2D linear features come with enhanced features including temporal
properties, coverages, dynamic features, complex, non-linear, 3D geometry
features, 2D topology;
 representation of spatial and temporal reference systems, units of measure
and standards information;
 use reference system, units and standards information in the representation of
geospatial phenomena, observations and values;
 representation of default styles for feature and coverage visualisation;
GML 3.0 specification defines the XML Schema syntax, mechanisms, and
conventions that:
 Provide an open, vendor-neutral framework for the definition of geospatial
application schemas and objects;
 Allow profiles that support proper subsets of GML framework descriptive
capabilities;
D 2.2 Analysis of Innovative Challenges
17/226
 Support the description of geospatial application schemas for specialised
domains and information communities;
 Enable the creation and maintenance of linked geographic application
schemas and datasets;
 Support the storage and transport of application schemas and data sets;
 Increase the ability of organisations to share geographic application schemas
and the information they describe.
Last versions of GML (3.1.1 and 3.2.1) add new geometries, are more compliant with
the ISO/TC 211 family of specifications and contain some items for increased
efficiency and simplicity. The last versions maintain backward compatibility for GML
version 3.0.0 and 2.1.2 instance documents by preserving, but deprecating, some
schema components that have been replaced by different constructs in the current
version.
Last enhancements, include:
 The Temporal Reference Systems schema for GML 3.1 provides constructs
for handling various styles of temporal reference system. This schema reflects
a partial implementation of the model described in ISO 19108:2002.
 Temporal topology schema for ISO19136 provides constructs for handling
topological complexes and temporal feature relationships. Temporal geometric
characteristics of features are represented as instants and periods. While,
temporal context of features that does not relate to the position of time is
described as connectivity relationships among instants and periods. These
relationships are called temporal topology, as they do not change in time, as
long as the direction of time does not change. It is used effectively in the case
of describing a family tree expressing evolution of species, an ecological cycle,
a lineage of lands or buildings, or a history of separation and merger of
administrative boundaries. This schema reflects a partial yet consistent
implementation of the model described in ISO 19108:2002.
 Support for Void (ISO/IEC 11404)
 Symbols for units of measurements. In addition to using names of commonly
accepted units (e. g. ISO 31) references to application domain specific unit
definitions are required. To support commonly used unit symbols like ―s‖ for
seconds, unit references now are a union of:
o a reference to an application defined units dictionary (like in GML 3.1.1)
o a string that follows the UCUM rules for naming units using the case
sensitive symbol labels.
 By value and by reference encoding and ownership of a property value. By-
value or by-reference in a GML property and ―ownership‖ (deep-copy, deep-
delete) are different concepts. This was clarified.
 Element substitutability vs type derivation. In GML 3.1, requirements were
often focused on content model definitions (e. g. ―feature-type types must be
D 2.2 Analysis of Innovative Challenges
18/226
ultimately derived from gml:AbstractFeatureType‖) which are an artefact of the
W3C XML Schema language and are thus normally invisible. The
requirements did not focus on components that can appear in instance
documents, i. e. elements representing features whose name is the feature
type and which are substitutable for gml:AbstractFeature. This has been
changed.
 Collection types. All existing collection types in GML including the feature
collection types have been deprecated.
4.2.3.2KML
KML is an XML language focused on geographic visualisation, including annotation
of maps and images. Geographic visualisation includes not only the presentation of
graphical data on the globe, but also the control of the user's navigation in the sense
of where to go and where to look.
Google submitted KML (formerly Keyhole Markup Language) to the Open Geospatial
Consortium (OGC) to be evolved within the OGC consensus process with the
following goal: KML Version 2.2 has been adopted as an OGC implementation
standard.
4.2.3.3Web mapping services (WMS)
A Web Map Service (WMS) is a standard protocol for serving map images over the
internet that are generated by a map server using data from a geographic data
resource or raster images. The specification was developed and first published by the
OGC in 1999.
The classic web map service (WMS) today is the most important technology in this
group for planning purposes. It passes the user‘s requests to the map server and
receives an image file which is generated by the map server on the fly upon request.
The map which is displayed to the user consists of one or more images depending on
the clients requests.
An OGC Web Map Service (WMS) produces maps of spatially referenced data
dynamically from geographic information. This international standard defines a "map"
to be a portrayal of geographic information as a digital image file suitable for display
on a computer screen. A map is not the data itself. WMS-produced maps are
generally rendered in a pictorial format such as PNG, GIF or JPEG, or occasionally
as vector-based graphical elements in Scalable Vector Graphics (SVG) or Web
Computer Graphics Metafile (WebCGM) formats. This is in contrast to a Web Feature
Service (WFS) – which returns actual vector data – and a Web Coverage Service
(WCS) – which returns actual raster data.
4.2.3.4Web Map Tile Server (WMTS)
The candidate WMTS Interface Standard is much like the OGC's popular Web Map
Server (WMS) Interface Standard, but it enables better server performance in
applications that involve many simultaneous requests. To improve performance,
instead of creating a new image for each request, it returns small pre-generated
D 2.2 Analysis of Innovative Challenges
19/226
images (e. g., PNG or JPEG) or reuses identical previous requests that follow a
discrete set of tile matrices. This proposed standard provides support for multiple
architectural patterns - KVP, REST and SOAP.
4.2.3.5Web feature services (WFS)
The Open Geospatial Consortium Web Feature Service Interface Standard (WFS)
provides an interface allowing requests for geographical features across the web
using platform-independent calls. WFS is oriented for vector data exchange on the
Internet. It uses GML format for data transfer. Both geometric and attribute informa-
tion are transferred with GML. Also OGC Web gazetteer Service profile is derived
from this service. An extended capability of the service enables transactional opera-
tions like insert/update/delete features on remote servers. WFS uses also Filter
Encoding for querying.
The 1.0 version of the Web Feature Service Interface Specification (WFS) was
published by the Open Geospatial Consortium on September 2002. This specification
purpose is to describe data manipulation operation on OpenGIS Simple Features
(feature instances) allowing servers and clients to ―communicate‖ on the feature
level. A WFS-compliant service provides client applications with real spatial data (i. e.
OGC geospatial Features), typically expressed as an XML-encoded file.
The WFS Transaction (WFS-T) operation is used to describe data transformation
operations that are to be applied to web accessible feature instances. A web feature
service may process a Transaction operation directly or possibly translate it into the
language of a target datastore to which it is connected and then have the datastore
execute the transaction. When the transaction has been completed, a web feature
service will generate an XML response document indicating the completion status of
the transaction.
The Transaction operation is optional and a WFS implementation does not need to
support it to conform to this specification. If the Transaction operation is supported
then this fact must be advertised in GetCapabilities results.
4.2.3.6Web coverage services (WCS)
The WCS may be compared to the OGC Web Map Service (WMS) and the Web
Feature Service (WFS); like them it allows clients to choose portions of a server's
information holdings based on spatial constraints and other criteria, but the WCS
deals with raster data instead of vector data (WFS). WCS supports electronic
retrieval of geospatial data as "coverages" – which is digital geospatial information
representing space-varying phenomena. This service enables data transfer in native
format together with metadata needed for data interpretation. Only raster data are
currently supported, vector data are planed to be incorporated in the future. This
service plays important role for satellite data transfer in the system.
The Web Coverage Service provides three operations: GetCapabilities (typical to all
OGC WxS standards), GetCoverage, and DescribeCoverage.
D 2.2 Analysis of Innovative Challenges
20/226
4.2.3.7Styled Layer Descriptor (SLD)
A Styled Layer Descriptor (SLD) is an XML schema specified by the Open
Geospatial Consortium (OGC) for describing the appearance of map layers. It is
capable of describing the rendering of vector and raster data. A typical use of SLDs
is to instruct a Web Map Service (WMS) of how to render a specific layer.
Since 2007 the SLD specification has been split up into two new OGC specifications:
 Symbology Encoding Implementation Specification (SE)
 Styled Layer Descriptor
Styled Layer Descriptor Specification now only contains the protocol for
communicating with a WMS about how to style a layer. The actual description of the
styling is now exclusively described in the Symbology Encoding Implementation
Specification.
4.2.3.8Web Map Context
WMS 1.1.1 specifies how individual map servers describe and provide their map
content. The Context specification states how a specific grouping of one or more
maps from one or more map servers can be described in a portable, platform-inde-
pendent format for storage in a repository or for transmission between clients. This
description is known as a "Web Map Context Document", or simply a "Context".
Presently, context documents are primarily designed for WMS bindings. However,
extensibility is envisioned for binding to other services.
A Context document includes information about the server(s) providing layer(s) in the
overall map, the bounding box and map projection shared by all the maps, sufficient
operational metadata for Client software to reproduce the map, and ancillary meta-
data used to annotate or describe the maps and their provenance for the benefit of
human viewers.
4.2.3.9Catalogue Service (CSW)
Catalogue services support the ability to publish and search collections of descriptive
information (metadata) for data, services, and related information objects. Metadata
in catalogues represent resource characteristics that can be queried and presented
for evaluation and further processing by both humans and software. Catalogue
services are required to support the discovery and binding to registered information
resources within an information community. Metadata act as generalised properties
that can be queried and returned through catalogue services for resource evaluation
and, in many cases, invocation or retrieval of the referenced resource. Catalogue
services support the use of one of several identified query languages to find and
return results using well-known content models (metadata schemas) and encodings.
Catalogue services are the key technology for locating, managing and maintaining
distributed geo-resources (i. e. geospatial data, applications and services). With OGC
catalogue services, client applications are capable of searching for geo-resources in
a standardised way (i. e. through standardised interfaces and operations) and,
ideally, they are based on a well-known information model, which includes spatial
D 2.2 Analysis of Innovative Challenges
21/226
references and further descriptive (thematic) information that enables client
applications to search for geo-resources in very efficient ways.
Whereas interfaces and operations of OGC catalogue services are well defined, it is
left up to the developer of the system to define a specific information model which a
catalogue service instance provides. This includes, but is not limited to, the
information which can be inserted in the catalogue, supported query languages,
available search terms, response/result sets, etc. This point is of major importance
with respect to interoperability between different catalogue service instances.
The CSW information model is based on the international standard for metadata
description ISO 19115:2003/Cor.1:20066. In addition, the catalogue uses a metadata
description for service metadata based on the ISO 19119:2005/PDAM 17 standard
[ISO 19119] to facilitate the management of service metadata. The encoding of any
information object in this profile is based on ISO/TS19139. The main purpose of the
information model is to provide a formal structure for the description of information
resources that can be managed by a catalogue service that complies with the
application profile.
The current standard is CSW 2.0.2, which is supported by metadata system ―Micka‖
and also an implementation in ―GeoNetwork opensource‖ is expected.
4.2.3.10 Web Processing Services (WPS)
The OpenGIS Web Processing Service (WPS) Interface Standard from Open Geo-
spatial Consortium defines a standardised interface that facilitates the publishing of
geospatial processes on the web and the discovery of and binding to those proces-
ses by clients. ―Processes‖ include any algorithm, calculation or model that operates
on spatially referenced data. ―Publishing‖ means making available machine-readable
binding information as well as human-readable metadata that allows service disco-
very and use. A WPS can be configured to offer any sort of GIS functionality to
clients across a network, including access to pre-programmed calculations respec-
tivly computation models that operate on spatially referenced data. The data required
by the WPS can be delivered across a network, or is available on a server. This inter-
face specification provides mechanisms to identify the spatially referenced data re-
quired by the calculation, initiate the calculation and manage the output so that the
client can access it. This Web Processing Service is targeted at processing both
vector and raster data. The WPS specification is designed to allow a service provider
to expose a web accessible process, such as polygon intersection, in a way that
allows clients to input data and execute the process with no specialised knowledge of
the underlying physical process interface or API. The WPS interface standardises the
way processes and their inputs/outputs are described, how a client can request the
execution of a process, and how the output from a process is handled. Because WPS
offers a generic interface, it can be used to wrap other existing and planned OGC
services that focus on providing geospatial processing services. For instance Python
Web Processing Service is an implementation of the Web processing Service
standard.
D 2.2 Analysis of Innovative Challenges
22/226
The specified Web Processing Service (WPS) provides client access to pre-pro-
grammed calculations and/or computation models that operate on spatially referen-
ced data. The data required by the service can be delivered across a network, or
available at the server. This data can use image data formats or data exchange stan-
dards such as Geography Markup Language (GML) or Geolinked Data Access Ser-
vice (GDAS). The calculation can be as simple as subtracting one set of spatially
referenced numbers from another (e.g. determining the difference in influenza cases
between two different seasons), or as complicated as a global climate change model.
The WPS interface specifies three operations that can be requested by a client and
performed by a WPS server, all mandatory implementation by all servers. Those
operations are:
4.2.4 ISO (International Standardisation Organisation) Metadata
standards
ISO 19115:2003 defines the schema required for describing geographic information
and services. It provides information about the identification, the extent, the quality,
the spatial and temporal schema, spatial reference, and distribution of digital
geographic data.
ISO 19115:2003 is applicable to:
 the cataloguing of datasets, clearinghouse activities, and the full description of
datasets;
 geographic datasets, dataset series, and individual geographic features and
feature properties.
ISO 19115:2003 defines:
 mandatory and conditional metadata sections, metadata entities, and
metadata elements;
 the minimum set of metadata required to serve the full range of metadata
applications (data discovery, determining data fitness for use, data access,
data transfer, and use of digital data);
 optional metadata elements - to allow for a more extensive standard
description of geographic data, if required;
 a method for extending metadata to fit specialised needs.
Though ISO 19115:2003 is applicable to digital data, its principles can be extended
to many other forms of geographic data such as maps, charts, and textual documents
as well as non-geographic data.
ISO 19119:2005 identifies and defines the architecture patterns for service interfaces
used for geographic information, defines its relationship to the Open Systems
Environment model, presents a geographic services taxonomy and a list of example
geographic services placed in the services taxonomy. It also prescribes how to create
a platform-neutral service specification, how to derive conformant platform-specific
D 2.2 Analysis of Innovative Challenges
23/226
service specifications, and provides guidelines for the selection and specification of
geographic services from both platform-neutral and platform-specific perspectives.
ISO/TS 19139:2007 defines Geographic MetaData XML (gmd) encoding, an XML
Schema implementation derived from ISO 19115.
4.2.5 De Facto Standards
 GeoRSS
 GeoJSON
4.3 Policy
4.3.1 INSPIRE
INSPIRE (Infrastructure for Spatial Information in Europe) is the name of an EU
directive for the development of an European Spatial Data Infrastructure. INSPIRE
Directive 2007/2/EC of the European Parliament and of the Council of 14th
March
2007 establishing an Infrastructure for Spatial Information in the European Commu-
nity (INSPIRE) entered into force on the 15th
May 2007. Member States have until
15th
May 2009 to transpose the Directive into their legislative systems. INSPIRE lays
down general rules to establish an infrastructure for spatial information in Europe for
the purposes of Community environmental policies, and policies or activities which
may have an impact on the environment. The goal of the infrastructure is to support
the European Environmental policy and decision-making. The directive is legally
binding for EU member states and includes explicit deadlines for its implementation.
The detail description of INSPIRE rules is in D 2.3 INSPIRE Requirements Analysis
The implementing rules will be of major relevance for the implementation of the
INSPIRE directive. They are currently developed and specified by five drafting teams.
The drafting teams cover the following topics:
 Metadata
 Data specifications
 Network services
 Data and service sharing
 Monitoring and reporting
INSPIRE Network Services Architecture is based on the description provided in the
INSPIRE Technical Architecture Overview document. At the core of the architecture
are the INSPIRE Service Types:
 Discovery
 View
 Download
 Transform
 Invoke
2
2
See D2.3 INSPIRE Requirements Analysis
D 2.2 Analysis of Innovative Challenges
24/226
4.4 Initiatives
4.4.1 UNSDI
Formed in 2000, UNGIWG (United Nations Geospatial Information Working Group)
comprises a network of UN professionals and others, working in the fields of carto-
graphy and geospatial information management science to address common geo-
spatial issues - maps, boundaries, data exchange, standards, naming conventions,
and location. It also works directly with nongovernmental organisations, research
institutions and industry to develop and maintain common geographic databases and
geospatial technologies to enhance guidance and operational capabilities. Since its
inception, UNGIWG has been laying the foundations for a UNSDI (United Nations
Spatial Data Infrastructure). The accomplishments of its Task Groups in particular
indicated that refinement and refocusing of current activities and UNGIWG organi-
sation could deliver the components for such a system. During the 7th UNGIWG
Plenary meeting held in Santiago in November 2006, it has been recognised that the
development of a common vision and understanding on UNSDI was a priority. In
order to build on common interests, the UNGIWG Secretariat consulted the UN
agencies on the activities carried out within the agency that could benefit from the
UNSDI. Four primary UN business cases drive the need for a UNSDI:
1. Provision of spatial data and information
2. Development of common data services
3. Capacity building
4. Promotion of partnerships and cooperation
The UNSDI Vision is for a comprehensive, decentralised geospatial information fra-
mework that facilitates decision-making at various levels by enabling access, retrieval
and dissemination of geospatial data and information in a rapid and secure way.
Achieving this vision in the milieu of UN reform, delivering on the MDGs (Millennium
Development Goals) and attending to the remits of evolving global governance requi-
res a mechanism to establish system coherence for the applications and exchange of
geospatial data for UN activities.
The UNSDI is such a mechanism. It enables interoperability between spatial data
infrastructures developed for specific purposes that operate within UN agencies,
among groups of UN agencies sharing common interests, and between the UN,
Member States and their regional and thematic groupings, and partners. To achieve
this the UNSDI provides a base collection of technologies, datasets, human resour-
ces, policies, institutional arrangements, and partnerships that facilitate the availa-
bility, exchange of, access to and use of geographically-related information using
standard practices, protocols, and specifications. Where SDI's do not yet exist -
within or beyond the bounds of the UN - it is in the UN's interest to foster their deve-
lopment as a means of encouraging improved ease of access and re-use of spatial
data to support the MDGs, the UN reform agenda and the tenets of the UN Charter.
At its core, the UNSDI will contribute substantively to the million of the United Nations
by engaging member states, regional organisations and partners in building consen-
D 2.2 Analysis of Innovative Challenges
25/226
sus, policy and governance mechanisms to ensure that geospatial data and informa-
tion sharing practices are used widely in social, economic and environmental deve-
lopment.
Access, retrieval, and dissemination of geospatial data and services will be enabled
in an easy and secure way by the UNSDI, avoiding duplication in data collection and
management within the United Nations, and with and between its member states and
partners.
By facilitating efficient global and local access, exchange and utilisation of geospatial
information to both developed and developing countries, the UNSDI will enhance
decision-making on a global basis and at all levels of societies and thus contribute
substantively to the achievement of the Millennium Development Goals (MDGs).The
UNSDI will also provide opportunities to increase UN efficiencies and effectiveness in
the context of the recent UN reform agenda and by facilitating the demands of increa-
sing global governance.
4.4.2 GMES
The objective of GMES is to provide, on a sustained basis, reliable and timely servi-
ces related to environmental and security issues in support of public policy makers‘
needs. GMES is an EU-led initiative, in which ESA implements the space component
and the Commission manages actions for identifying and developing services relying
both on in-situ and space-borne remote sensing data. GMES will use, to the maxi-
mum extent possible, existing capacities, weather they are national or European.
This entails cooperation between the European Community, ESA and their Member
States.
4.4.3 GEOSS
The Global Earth Observation System of Systems will provide decision-support tools
to a wide variety of users. As with the Internet, GEOSS will be a global and flexible
network of content providers allowing decision makers to access an extraordinary
range of information at their desk.
This ‗system of systems‘ will proactively link together existing and planned observing
systems around the world and support the development of new systems where gaps
currently exist. It will promote common technical standards so that data from the
thousands of different instruments can be combined into coherent data sets. The
‗GEOPortal‘ offers a single Internet access point for users seeking data, imagery and
analytical software packages relevant to all parts of the globe. It connects users to
existing data bases and portals and provides reliable, up-to-date and user friendly
information – vital for the work of decision makers, planners and emergency mana-
gers. For users with limited or no access to the Internet, similar information is
available via the ‗GEONETCast‘ network of telecommunication
D 2.2 Analysis of Innovative Challenges
26/226
5 Framework for classifying technologies and services
An important part of the state of the art analysis is to identify relevant GIS techno-
logies and services. To make them more structured, we described a framework to
classify software products, which was tested by classifying a couple of existing
products. The framework includes minimum requirements for software and services
in SDI and several classifications (classification by technology, by interactivity, by
approach). First of all we need this framework to test it and to see if it is useful in SDI
context (or will be within the project time). Second, we need detailed software
description to decide which software could be used for the development of Plan4all
prototype.
5.1 Classification given by Plan4all extension of INSPIRE Networ-
king Architecture
The INSPIRE networking Architecture define next five types of basic services:
• Discovery
• View
• Downloading
• Transformation
• Invoke
The definition of this services is described detail in D 2.3 INSPIRE Requirements
Analysis. This services are defined mainly for sharing data and services across
Europe. INSPIRE services doesn‘t include such functionality like digitalisation, data
collection, data analysis, routing, design and planning. So for classification of soft-
ware we will use next additional type of services:
• Digitalisation
• Data collection
• Digital cartography
• Data analysis
• Routing
• Design and planning activity
5.2 Classification by standards
Classification by standards is given by OGC and ISO standards described in the pre-
vious chapter.
5.3 Classification by technology
There are various types of web mapping applications which have different goals, use
different technologies and are addressing different target groups. Therefore, we set
up a number of groups to classify web mapping and online geo data manipulation by
used technology.
D 2.2 Analysis of Innovative Challenges
27/226
5.3.1 Client-Side (User Interface)
5.3.1.1File transfer technology
The simpliest form of map acquisition through the web is a download-only map where
you can view and/or download any static map (image file or pdf). There is no
interactivity and no direct connection to a map server or geodatabase. The download
can only be updated by replacing the downloadable file. Because files may be very
large in size someone should mention that this download may use the more robust
FTP protocol too. In such a case all intelligence of the application must be provided
server side. Such systems are outdated in the SDI context.
5.3.1.2Thin Client Web Maps
In a time when it was quite unsafe that browsers could interpret JavaScript typical
web mapping clients consisted of a serverside calculated map picture surrounded by
many hyperlinks (e. g. for zoom, pan, switch layers, query attribute data), and
probably also reacting on clicks within the image as they were embedded in a HTML
form. On click the whole HTML page as well as the embedded image was reloaded
from the server where it also was regenerated just in the client requested size. Such
systems are working with nearly any graphical browser, even very outdated versions.
First versions of web mapping servers from the commercial GIS companies worked
in that way in the late 1990s just like the mapserver from the University of Minnesota
(In the time being this server component has also grown at a similar pace as its
commercial counterparts and offer all the OGC interfaces to a similar or higher
degree of conformance.), where this behaviour is still in use nowadays. Since first
mobile devices, especially mobile phones, had low technical possibilities this
technology was also reused for the first mobile applications, e. g. with WAP. Such
systems will be used in the SDI context only within special circumstances.
5.3.1.3Thick Client Web Maps
Since the comfort of thin client web maps is undesirable, developers created new
interfaces which allow more comfortable usability. Typically these clients request
either vector data from the server and interpret it client side or raster tiles (e. g.
images with 256 * 256 pixels, mostly fractions of 1024). On zoom events these data
are recalculated in a first step (even if the pixels get huge) and reloaded in a second
step. In pan events the vectors or rasters are moved and the missing parts requested
in another step. This technology ensures that maps can be displayed quickly as well
as more comfortably than with simple one image applications.
Since the scripting technology of browsers in the mid 1990s was in its infancy, first
attempts of creating better interfaces were setup upon browser add-ons or http using
standalone applications. Later on scripting languages especially JavaScript were
impressively extended and so newer interfaces use this technology. Specific
technologies of that type are:
D 2.2 Analysis of Innovative Challenges
28/226
5.3.1.4Standalone Web Map Applications
Since browsers bring a lot of functionality which is not needed for geographical
applications, it may be a good concept to provide special web map client
applications. On the other hand restrictions caused by applets and all applications
capable of residing within browsers made it reasonable to create standalone
applications. The standalone applications also allowed re-use of code for the creation
of simple clients based on their mainstream commercial products. In the time being
new standalone applications were developed for mobile devices as these give the
possibility to override restrictions of mobile browsers.
5.3.1.5GIS with ability to use online data
Beside other standalone applications some GIS (and even CAD) systems are
enabled also to use web maps in the meantime.
5.3.1.6Browser Extensions
Typically geographic applications used the following way to extend the browser‘s
possibilities. A huge common disadvantage of nearly all these technologies is that
the user has to install something, which is problematic especially in company
networks with restricted rights. Some of these extensions only work as an extended
user interface to load images more comfortable, others bring real vector data to the
user and interpret it there. Nevertheless also public viewable maps were published
with such systems in former days.
Proprietary ActiveX
This technology had a very comfortable download but was limited to Microsoft
Internet Explorer and therefore lost importance by the time. Some applications which
used that way of extension are:
Java Applets
Java applets are very comfortable because the user does not have to download
anything. But on the other hand in times of (respectively on systems with) small
bandwidth it needs a long time to start the application. In some cases, developers
also created installable applets, whereby one disadvantage was solved by getting
another one. Another disadvantage was the poor graphical interface of early Java
applets. Some applicationsthat used this approach are:
Netscape PlugIns/Firefox AddOns
Whereas the fist PlugIns for Netscape were used for overriding built-in technical
restrictions of the early versions, in the time being, modern extensions for Firefox are
offered mainly to improve the usability.
Flash, Silverlight and OpenLazlo Applications
To avoid downloading of proprietary extensions some developers used the widely
installed Flash PlugIn (or its uncommon used counterparts Silverlight and OpenLazlo)
which are nowadays often installed with one‘s browser standard installation. Since
D 2.2 Analysis of Innovative Challenges
29/226
Flash applications with many elements have a poor performance and the server side
development is not quite easy, this technology was used only rarely and for smaller
projects in a geographical context.
SVG Applications
While SVG (Scalable Vector Graphics) is a W3C standard since 2001 some
developers tried to use it for geographic applications too. But SVG never became
really accepted. On one hand it is implemented in Firefox natively, but with poor
functionality for zooming and panning, on the other hand Microsoft invented its own
standard (ovl?) and a SVG-PlugIn was needed. At last Adobe ended the support of
its market leading PlugIn. In the meantime most of the features of SVG are also
possible with HTML and JavaScript directly. A huge advantage of SVG is the full
implementation of the DOM (document object model).
5.3.1.7Web-based 3D graphics
X3D (Extensible 3D) is an open standard XML-based language successor to the
popular VRML (Virtual Reality Modelling Language) the original ISO standard for
web-based 3D graphics (ISO/IEC 14772). In particular, the XML encoding enables
3D to be incorporated into web services architectures and distributed environments
allowing 3D data moving between applications. X3D has been officially incorporated
within MPEG-4 multimedia standard and it is compatible with SVG.
X3D has a rich set of features to support applications such as engineering and
scientific visualisation, multimedia presentations, entertainment and educational
titles, web pages, and shared virtual worlds.
In particular X3D feature set includes:
 3D graphics: Polygonal geometry, parametric geometry, hierarchical
transformations, lighting, materials and multi-pass/multi-stage texture mapping
 2D graphics: Text, 2D vector and planar shapes displayed within the 3D
transformation hierarchy
 Animation: Timers and interpolators to drive continuous animations
 Spatial audio and video: Audiovisual sources mapped onto geometry in the
scene
 User interaction: Mouse-based picking and dragging; keyboard input
 Navigation: Cameras; user movement within the 3D scene; collision, proximity
and visibility detection
 User-defined objects: Ability to extend built-in browser functionality by creating
user-defined data types
 Scripting: Ability to dynamically change the scene via programming and
scripting languages
D 2.2 Analysis of Innovative Challenges
30/226
 Networking: Ability to compose a single X3D scene out of assets located on a
network; hyperlinking of objects to other scenes or assets located on the
World Wide Web
 Physical simulation: Humanoid animation; geospatial datasets; integration with
Distributed Interactive Simulation (DIS) protocols
5.3.1.8Web Browser with scripting extensions
With the further development of browsers and the extended scripting languages,
application developers were enabled to construct user interfaces directly within the
browser using that scripting technologies and avoiding extensions, which have to be
installed. Some of them – like OpenLayers – are even enabled to interpret vector
layers directly.
Others – like Mapbender which also includes a backend application– have a rich
interface which reminds of desktop mapping applications.
There is no need to install any additional software on the client‘s (i. e. the user‘s) PC.
The scripts are embedded in the HTML pages or separate files and loaded on
demand without user interaction.
5.3.2 Serverside
5.3.2.1Application server
There is a certain number of powerful web mapping clients available; they are
predominantly open source software and they all work through the user‘s web
browser. Although called client, the web mapping client software is installed on a
server and loaded to the client.
Whereas server modules which deliver maps to clients, derive from a handful
products on market, surrounding applications are often individually programmed.
Most of these applications are written in PHP, sometimes also in Python, Perl or
Java. Beside that, there are some products on the market which even include a
backend for special purposes, e. g. Mapbender.
While most of the application servers allow only the interpretation of zoom and pan
requests or even feature information requests, some applications are able to react to
further GIS functions starting with drawing requests and lasting to real GIS functions
like polygon overlays.
5.3.2.2Tile server and ―cookie cutter‖
While the first products on market mainly served tiles or created them out of huge
bitmaps on the fly, this rather simple solution is still used for mass user applications.
5.3.2.3File interpreting
The first more sophisticated attempt used vector files (mainly ESRI shape files) and
created bitmaps on the fly. Really early applications even used desktop applications
running on the server and sent screenshots to the user.
D 2.2 Analysis of Innovative Challenges
31/226
First products in the market like the mapserver of the university of Minnesota or
ArcIMS used their proprietary set of request parameters nowadays most services
work OGC compliant so that client applications have no need to know the server side
product in detail.
5.3.2.4Mapserver with database backend
With the upcoming geodatabases products were enabled to interpret data from these
databases directly. In the time being these products were also enhanced to produce
maps upon requirements with user driven design.
5.3.2.5Mapserver with more intelligent functions
Driven by the Open Source Community with the latest products it is also possible to
use some GIS functions like manipulating data or retrieving data to use it with
intelligent clients so that mapservers act like a middle tier to the geodatabase.
5.3.2.6Middleware
Middleware products with special geographic functions may be for example servers
which request data or images from another map server and reproject these on the fly
to send it to clients.
5.3.2.7Geodatabases
Geodatabases are commonly SQL extensions which allow the request of
geographical data from SQL databases based on geographical items. Some of them
are also able to achieve GIS functions. In early days of development some of them
used also proprietary protocols.
5.4 Classification by Service
5.4.1 State of the art
State of the art is on the one side defined by technology development, which is cur-
rently mainly predicted by service oriented architecture and currently also Web 2.0
development. On the other side current state of the art is defined by European legis-
lation given by the INSPIRE directive. Parallel to the INSPIRE initiative the initiatives
GMES and GEOSS could be mentioned and word wide also the UNSDI initiative.
5.4.1.1Proprietary mapping services
First products on market used their own proprietary request protocols which are even
in use nowadays by many map distributors. Most mapping clients are able to request
maps from the most established mapservers in their specific proprietary protocol.
5.4.1.2Direct SQL Requests to Geodatabases
Geodatabases usually can be requested following the Simple Feature Specification
for SQL defined by the Open GIS Consortium (OGC).
D 2.2 Analysis of Innovative Challenges
32/226
5.5 Products
5.5.1 Template with answering suggestions
Plan4all Product/Service description #...
Productname/Version Full name (short name, actual/last Version)
Manufacturer
Developed from/to
Contact Name (email)
Short Description
Type  commercial
 OpenSource
 Standard (OGC, W3C, …)
 Commercial, but free of cost (for …)
Approach  Graphic Display
 Web Mapping
 Web Mapping (Globe)
 Web Cartography
 Web GIS
 Geodatabase
 Location-based services
 Routing
Interactivity  Only Viewing
 Semi interactive
 Fully interactive
Technology Server side  Application Server
 Tile Server/…
 File Interpreting
 Database Access
 WebGIS functions
Client side  standalone
 ActiveX
 PlugIn/AddOn
 Applet
 Scripts
 HTML only
Used Services/
Protocols
 proprietary
 WMS (OGC conform)
 WFS (OGC conform)
 WFS-T (OGC conform)
 WCS (OGC conform)
 SLD/… (OGC conform)
 Simple Feature Specification for SQL (OGC)
 GeoRSS
 KML
 GML
 SVG
 Others (specify …)
Operating System Server side
Client side
Webtechnology Webserver
Browsers
Projections Which
Where  Server side
 Client side
D 2.2 Analysis of Innovative Challenges
33/226
Metadata management
Known usage in planning
Challenges
Collected by
Additions by
Remarks
Manufacturers remarks
5.6 Selected Product overview
This table provides classification of selected products, which was recognised as most
relevant for Plan4all pilot implementations. The full list of products and detailed
information about all software is provided in Annex A.
Products Classification Comments
Type Manufacturer Product Plan4all
classification
Standards
CommercialSofteware
AbacoGroup DbMap2D View
Downloading
Transformation
Digitalisation
Data collection
Digital cartography
Data analysis
Routing
WMS (OGC
conform)
Simple Feature
Specification for
SQL (OGC)
GeoRSS
KML
Autodesk Inc. Autodesk Map Digitalisation
Data collection
Data analysis
Design and
planning activity
WMS?
Autodesk
MapGuide
View WMS?, WFS? Until 2005;
Client-Server-
Application; still
in use;
Bentley Systems Bentley Cadastre Design and
planning activity
KML
Bentley Map Digitalisation
Data collection
Design and
planning activity
KML
WMS
GeoWebPublisher View
Downloading
WMS **
MicroStation Digitalisation
Data collection
Design and
planning activity
KML
WMS
proprietary
projections
Conterra terraCatalog Discovery CSW
ISO19115/19119)
Connectivity to
ArcGIS
D 2.2 Analysis of Innovative Challenges
34/226
Products Classification Comments
Type Manufacturer Product Plan4all
classification
Standards
ERDAS Apollo Image
Manager
Discovery
View
Downloading
Digital cartography
Data analysis
WSDL/SOAP/UDD
I, WRS 0.0.2
WMS-WSDL,
WMS POS,
WMS, WMC,
WCS-WSDL,
WCS, URN,
SOAP, SLD,
OWS common,
Filter,
CAT2 AP, ebRIM,
CAT CS/W
Metadata ISO
19115/ 19119/
19139
Included
Metadata-
Management
Apollo Server Discovery
View
Downloading
Digital cartography
Data analysis
WSDL/SOAP/UDD
I, WRS 0.0.2
WMS-WSDL,
WMS POS,
WMS, WMC,
WCS-WSDL,
WCS, URN,
SOAP, SLD,
OWS common,
Filter,
CAT2 AP, ebRIM,
CAT CS/W
Metadata ISO
19115/ 19119/
19139
ERDAS Catalog Discovery
View
Downloading
Digital cartography
Data analysis
Routing
WSDL/SOAP/UDD
I, WRS 0.0.2
WMS-WSDL,
WMS POS,
WMS, WMC,
WCS-WSDL,
WCS, URN,
SOAP, SLD,
OWS common,
Filter,
CAT2 AP, ebRIM,
CAT CS/W
Metadata ISO
19115/ 19119/
19139
ESRI ArcCatalog Discovery 19115/19119/1913
9, CSW?
Meta Data Editor
ArcGIS Explorer View WMS Free of cost
ArcIMS / ArcGIS
Server
View
Downloading
Digital cartography
Data analysis
WMS, WFS Various
Applications
D 2.2 Analysis of Innovative Challenges
35/226
Products Classification Comments
Type Manufacturer Product Plan4all
classification
Standards
ArcSDE (Spatial
Data Engine)
View
Downloading
Digital cartography
Data analysis
WMS, WFS
HSRS Micka Discovery CSW, ISO 19115/
19119/ 19139
URM Geoportal Discovery
View
Downloading
Transformation
Digitalisation
Data collection
Digital cartography
Data analysis
WMS, WFS, WCS,
WPS, CSW, ISO
19115/ 19119/
19139
Intergraph GeoMedia
WebMap
View
Downloading
Transformation
Digitalisation
Data collection
Digital cartography
Data analysis
WMS, WFS, WFS-
T, GM, SVG, CSW
MapInfo Mapinfo
Professional
Digitalisation
Data collection
Digital cartography
Data analysis
WMS, WFS,
WFS-T, KML
MapXtreme View
Routing
WMS, GML
Oracle Oracle Spatial &
Locator
View
Routing
WMS, LBS
Topol s.r.o Topol xT 9.0 View
Transformation
Digitalisation
Data collection
Digital cartography
Data analysis
WMS
Topol xT Internet
server
View
Transformation
WMS,
WPS
OpenSourceSoftwareorfreeware
Advanced Informa-
tion Systems
Group of the Uni-
versity of Zaragoza
and GeoSpatium-
Lab
CATMDEdit Discovery ISO 19115/ 19119/
19139
Camptocamp SA CartoWeb View
Routing
WMS, WFS
Cenia Janitor View
Digitalisation
Data collection
Digital cartography
Data analysis
WMS, CSW
DM Solutions
Group
Chameleon View WMS, WMC
Ka-map View WMS, WFS
D 2.2 Analysis of Innovative Challenges
36/226
Products Classification Comments
Type Manufacturer Product Plan4all
classification
Standards
Fraunhofer Institu-
te for Computer
Graphics Research
(IGD)
HALE –
HUMBOLDT
Alignment Editor
Transformation GML, WFS
Gigateway - AGI MetaGenie Discovery ISO 19115/ 19119/
19139
Help Forest,
Wirelessinfo
DataMan Downloading
Discovery
ISO 19115/ 19119/
19139, GML
Help Forest,
Wirelessinfo
HSRS
MapMan View
Discovery
Digital cartography
WMS, WFS, ISO
19115/ 19119/
19139, GML
Teredit System View
Discovery
Digitalisation
Data collection
WMS, WFS,
WCS, CSW
Gemet Client thesaurus SOAP **
HSRS
IDEC Spain
HSLayers View WMS, WFS OpenLayers
based
PyWPS Transformation WPS
MetaD Discovery ISO 19115/ 19119/
19139
Immanuel Scholz,
Dirk Stöcker
JOSM Digital cartography No standard?
Intelec
Geomatique
M³CAT Discovery ISO 19115/ 19119/
19139
MetaDataEditor**
Intevation GmbH
and TechniData
AG
Thuban View
Digitalisation
Data collection
Digital cartography
Data analysis
WMS
SWG
IVER Technologias gvSIG View
Digitalisation
Data collection
Digital cartography
Data analysis
WMS, WFS WCS
SLD/… GeoRSS,
KML
GML
SVG
lat/lon degree View
Digitalisation
Data collection
Digital cartography
Data analysis
WMS, WFS,WFS-
T, WCS, pre-stan-
dards of Sensor
Observation Servi-
ce (SOS), Web
Terrain Service/
Web Perspective
and View Service,
(WTS/ WPVS),
WPS, SLD, SFS
for SQL, KML,
GML (3.1 with a
complex Feature
Model and 3D-
geometries), SVG
D 2.2 Analysis of Innovative Challenges
37/226
Products Classification Comments
Type Manufacturer Product Plan4all
classification
Standards
Ministerio de Fo-
mento, Admon
Públicas, Industria
y Turismo, Econo-
mía y Hacienda
GeoPista Municipality GIS WMS, WFS,
SLD/… ,GML, SVG
OSGeo
Foundation
GDAL/OGR Transformation WMSTS? Additional
commandline
tools
GeoNetwork Discovery CSW Inkl. Meta Data
Editor
Grass Gis Analysis
Digitalisation
SWG ?
MapBender View WMS, WFS, WFS,
SLD/…
MapServer View WMS, WFS
client/server,
WMC, WCS, Filter
Encoding SLD,
GML, SOS, OM,
SFS for SQL,
GeoRSS, KML,
SVG
May be
combined with
other client soft-
ware; former:
Map-Server
Foundation,
former: Universi-
ty of Minnesota
OpenLayers View WMS, WFS Client side
projections
PortalU InGrid Editor View
Discovery
ISO 19115 /
ISO 19119,
OGC-CSW-2-0,
WMS
Meta Data
Editor**
QGIS Project
Steering Comitee
QGIS
(QuantumGIS)
View
Digitalisation
Data collection
Digital cartography
Data analysis
WMS, WFS, SFS
for SQL, GML
Refractions Inc. GeoServer View
Downloading
WMS, WFS, WFS-
T, WCS
PostGIS Geodatabase, WMS, WFS, WFS-
T, WCS, GML,
WKT, SVG, SFS
for SQL
uDig View
Digitalisation
Data collection
Digital cartography
Data analysis
WMS, WFS,
SLD/…,
GeoRSS, KML,
GML, SVG
SAIG KOSMO GIS View
Digitalisation
Data collection
Digital cartography
Data analysis
WMS, WFS,
SLD/…, GML, SVG
T-Systems
España, SAU
MonoGIS View
Digital Cartography
Routing
GML
D 2.2 Analysis of Innovative Challenges
38/226
Products Classification Comments
Type Manufacturer Product Plan4all
classification
Standards
Vivid Solutions JUMP View
Digitalisation
Data collection
Digital cartography
Data analysis
WMS, SLD/…,
GML, SVG
D 2.2 Analysis of Innovative Challenges
39/226
6 Chances, potentials, risks of data infrastructure
applications
Based on the framework of technologies and services we give a theoretic view on
their chances, potentials and risks concerning data storage, data display, legislation,
insufficient data use, derived datasets and the quality of metadata.
6.1 Data Storage
6.1.1 Any time access and combined access
Any time and any where access is one of the main advantages of online data
infrastructures. The user is not dependent on certain office hours nor does he or she
have to collect datasets on offline devices to have an every time access. The
problem of having offline datasets which are out of date because an update has been
missed does not exist in this case because there is always access to the latest
version of all data.
Any time and any where access does not necessarily mean that the datasets are
shared via internet or similar, potentially insecure channels. A connection can also be
made through a secured or private network and can even be encrypted so that only
privileged users can access the data. Therefore, confidential datasets can be
accessed this way, too.
Combined access means that datasets from different sources can be accessed in the
same way because everything is part of the spatial data infrastructure (SDI).This is a
huge advantage opposite to datasets which are kept without an SDI (see also
―incorrect data use‖ and the figure below). Since this ambition may be overruled by
browser security features, using more than one source with browser extensions may
work only via reverse proxy servers or middleware.
6.1.2 Redundancy
A huge problem of distributed data management is redundancy. This term refers to
double storage of identical datasets as well as multiple storage of similar datasets
due to erroneous or negligent survey or a lack of coordination. There may be several
reasons for redundancy:
 quicker access: If all relevant datasets are stored at the same place,
disregarding the fact that they are also available elsewhere, the user does not
have to think of different sources but can always rely on the same data source.
 independency: One data store is not dependent on another data store if it
keeps all relevant datasets in its own place.
 ignorance: The datasets are kept in multiple places because one data
manager simply does not know that another data manager maintains the same
datasets. This is a common effect in tangled and outdated infrastructure
networks of big administrational clusters. Technical ignorance may also be a
D 2.2 Analysis of Innovative Challenges
40/226
consequence of legal ignorance, which is often followed by redundant
datasets.
Apart from safety issues which see redundancy as a matter of purpose for security
reasons (backup), classic redundancy often leads to problems: More than one
instance of a dataset is available, and each claims to be the latest – but the user
does not really know which one is the one he or she should choose to work with.
Central data storage or an up-to-date data infrastructure network helps to solve
redundancy problems which are not only a matter of work efficiency but also a matter
of wasted disk space.
D 2.2 Analysis of Innovative Challenges
41/226
6.2 Data Display
6.2.1 Generalisation
Cartographic generalisation is the process of selecting and representing information
of a map in a way that adapts to the scale of the display medium of the map. Printed
maps are always provided in fixed scales whereas digital maps are scalable. This
can lead to presentation problems because geodata are always stored in a resolution
which is proper for a certain scale range. Zooming out of this range may result in
inaccurate, wrong, or at least strange data display. An alternative could be to store
geodata only at their best available resolution and apply automatic generalisation
dependent on the requested map scale. However, generalisation is a balancing
process. Automatic generalisation still leads to problems as different researchers
invented conceptual models for automated generalisation, but still there is no clear
classification of operators available, It is doubtful if a comprehensive classification will
evolve in future. This leads directly to the next point:
Fig. 2: Problems of GIS applications in huge (administrational) network structures
Problems of GIS applications in huge (administrational) network structures
VVaarriieettyy ooff iinnffoorrmmaattiioonn aanndd ddaattaa
DDaattaa aanndd iinnffoorrmmaattiioonn aacccceessss
AApppplliiccaattiioonn   uusseerr
Big, heterogeneous data amount
 official statistics
 transportation, distance
 biota, protection areas
 imagery, base maps
 land use data
 …
Cooperation, joint solution
 identical data for identical
problems in all divisions
 data interpretation
 overall goals
Application needs
 simple handling
 hardly used  daily used
 user-oriented access
 space for derived datasets
D2.2 analysis of_innovative_challenges

Mais conteúdo relacionado

Semelhante a D2.2 analysis of_innovative_challenges

WSIS+10: Overall Review of the Implementation of the WSIS Outcomes Action Lin...
WSIS+10: Overall Review of the Implementation of the WSIS Outcomes Action Lin...WSIS+10: Overall Review of the Implementation of the WSIS Outcomes Action Lin...
WSIS+10: Overall Review of the Implementation of the WSIS Outcomes Action Lin...Dr Lendy Spires
 
Wsis10 alf reporting-c2.v2
Wsis10 alf reporting-c2.v2Wsis10 alf reporting-c2.v2
Wsis10 alf reporting-c2.v2Dr Lendy Spires
 
LinkedTV D6.4 Scenario Demonstrators v2
LinkedTV D6.4 Scenario Demonstrators v2LinkedTV D6.4 Scenario Demonstrators v2
LinkedTV D6.4 Scenario Demonstrators v2LinkedTV
 
Integrated Smart Controller Implementation
Integrated  Smart Controller ImplementationIntegrated  Smart Controller Implementation
Integrated Smart Controller ImplementationEU ARCADIA PROJECT
 
3D-ICONS -D21: Digitisation Planning Report
3D-ICONS -D21: Digitisation Planning Report3D-ICONS -D21: Digitisation Planning Report
3D-ICONS -D21: Digitisation Planning Report3D ICONS Project
 
D6.2 pan european_plan4all_platform
D6.2 pan european_plan4all_platformD6.2 pan european_plan4all_platform
D6.2 pan european_plan4all_platformKarel Charvat
 
D6.2 Pan European Plan4all Platform
D6.2 Pan European Plan4all PlatformD6.2 Pan European Plan4all Platform
D6.2 Pan European Plan4all Platformplan4all
 
3D-ICONS - D3 2: Final Report on Data Acquisition
3D-ICONS - D3 2: Final Report on Data Acquisition3D-ICONS - D3 2: Final Report on Data Acquisition
3D-ICONS - D3 2: Final Report on Data Acquisition3D ICONS Project
 
LinkedTV Deliverable D2.6 LinkedTV Framework for Generating Video Enrichments...
LinkedTV Deliverable D2.6 LinkedTV Framework for Generating Video Enrichments...LinkedTV Deliverable D2.6 LinkedTV Framework for Generating Video Enrichments...
LinkedTV Deliverable D2.6 LinkedTV Framework for Generating Video Enrichments...LinkedTV
 
LinkedTV Deliverable D3.7 User Interfaces selected and refined (version 2)
LinkedTV Deliverable D3.7 User Interfaces selected and refined (version 2)LinkedTV Deliverable D3.7 User Interfaces selected and refined (version 2)
LinkedTV Deliverable D3.7 User Interfaces selected and refined (version 2)LinkedTV
 
Microsoft® Exchange 2000 Conferencing Server
Microsoft® Exchange 2000 Conferencing ServerMicrosoft® Exchange 2000 Conferencing Server
Microsoft® Exchange 2000 Conferencing ServerVideoguy
 
Microsoft® Exchange 2000 Conferencing Server
Microsoft® Exchange 2000 Conferencing ServerMicrosoft® Exchange 2000 Conferencing Server
Microsoft® Exchange 2000 Conferencing ServerVideoguy
 
e-SENS D3.6 Scenarios for governance models on short medium and long term_v1
e-SENS D3.6 Scenarios for governance models on short medium and long term_v1e-SENS D3.6 Scenarios for governance models on short medium and long term_v1
e-SENS D3.6 Scenarios for governance models on short medium and long term_v1Monica ANGHEL
 
3D-ICONS - D4.1: Interim Report on Post-processing
3D-ICONS - D4.1: Interim Report on Post-processing3D-ICONS - D4.1: Interim Report on Post-processing
3D-ICONS - D4.1: Interim Report on Post-processing3D ICONS Project
 
Urd dioscuri kbna_v1_1_en_2
Urd dioscuri kbna_v1_1_en_2Urd dioscuri kbna_v1_1_en_2
Urd dioscuri kbna_v1_1_en_2seakquechchhan
 
Requirements document for LinkedTV user interfaces
Requirements document for LinkedTV user interfacesRequirements document for LinkedTV user interfaces
Requirements document for LinkedTV user interfacesLinkedTV
 

Semelhante a D2.2 analysis of_innovative_challenges (20)

WSIS+10: Overall Review of the Implementation of the WSIS Outcomes Action Lin...
WSIS+10: Overall Review of the Implementation of the WSIS Outcomes Action Lin...WSIS+10: Overall Review of the Implementation of the WSIS Outcomes Action Lin...
WSIS+10: Overall Review of the Implementation of the WSIS Outcomes Action Lin...
 
Wsis10 alf reporting-c2.v2
Wsis10 alf reporting-c2.v2Wsis10 alf reporting-c2.v2
Wsis10 alf reporting-c2.v2
 
LinkedTV D6.4 Scenario Demonstrators v2
LinkedTV D6.4 Scenario Demonstrators v2LinkedTV D6.4 Scenario Demonstrators v2
LinkedTV D6.4 Scenario Demonstrators v2
 
Integrated Smart Controller Implementation
Integrated  Smart Controller ImplementationIntegrated  Smart Controller Implementation
Integrated Smart Controller Implementation
 
3D-ICONS -D21: Digitisation Planning Report
3D-ICONS -D21: Digitisation Planning Report3D-ICONS -D21: Digitisation Planning Report
3D-ICONS -D21: Digitisation Planning Report
 
D6.2 pan european_plan4all_platform
D6.2 pan european_plan4all_platformD6.2 pan european_plan4all_platform
D6.2 pan european_plan4all_platform
 
D6.2 Pan European Plan4all Platform
D6.2 Pan European Plan4all PlatformD6.2 Pan European Plan4all Platform
D6.2 Pan European Plan4all Platform
 
3D-ICONS - D3 2: Final Report on Data Acquisition
3D-ICONS - D3 2: Final Report on Data Acquisition3D-ICONS - D3 2: Final Report on Data Acquisition
3D-ICONS - D3 2: Final Report on Data Acquisition
 
LinkedTV Deliverable D2.6 LinkedTV Framework for Generating Video Enrichments...
LinkedTV Deliverable D2.6 LinkedTV Framework for Generating Video Enrichments...LinkedTV Deliverable D2.6 LinkedTV Framework for Generating Video Enrichments...
LinkedTV Deliverable D2.6 LinkedTV Framework for Generating Video Enrichments...
 
LinkedTV Deliverable D3.7 User Interfaces selected and refined (version 2)
LinkedTV Deliverable D3.7 User Interfaces selected and refined (version 2)LinkedTV Deliverable D3.7 User Interfaces selected and refined (version 2)
LinkedTV Deliverable D3.7 User Interfaces selected and refined (version 2)
 
dc09ttp-2011-thesis
dc09ttp-2011-thesisdc09ttp-2011-thesis
dc09ttp-2011-thesis
 
Microsoft® Exchange 2000 Conferencing Server
Microsoft® Exchange 2000 Conferencing ServerMicrosoft® Exchange 2000 Conferencing Server
Microsoft® Exchange 2000 Conferencing Server
 
Microsoft® Exchange 2000 Conferencing Server
Microsoft® Exchange 2000 Conferencing ServerMicrosoft® Exchange 2000 Conferencing Server
Microsoft® Exchange 2000 Conferencing Server
 
thesis_SaurabhPanda
thesis_SaurabhPandathesis_SaurabhPanda
thesis_SaurabhPanda
 
report
reportreport
report
 
e-SENS D3.6 Scenarios for governance models on short medium and long term_v1
e-SENS D3.6 Scenarios for governance models on short medium and long term_v1e-SENS D3.6 Scenarios for governance models on short medium and long term_v1
e-SENS D3.6 Scenarios for governance models on short medium and long term_v1
 
3 g m gw
3 g m gw3 g m gw
3 g m gw
 
3D-ICONS - D4.1: Interim Report on Post-processing
3D-ICONS - D4.1: Interim Report on Post-processing3D-ICONS - D4.1: Interim Report on Post-processing
3D-ICONS - D4.1: Interim Report on Post-processing
 
Urd dioscuri kbna_v1_1_en_2
Urd dioscuri kbna_v1_1_en_2Urd dioscuri kbna_v1_1_en_2
Urd dioscuri kbna_v1_1_en_2
 
Requirements document for LinkedTV user interfaces
Requirements document for LinkedTV user interfacesRequirements document for LinkedTV user interfaces
Requirements document for LinkedTV user interfaces
 

Mais de plan4all

Agrihub INSPIRE HAckathon 2021: Extreme weather
Agrihub INSPIRE HAckathon 2021: Extreme weather Agrihub INSPIRE HAckathon 2021: Extreme weather
Agrihub INSPIRE HAckathon 2021: Extreme weather plan4all
 
Agrihub INSPIRE Hackathon 2021: Challenge #7: Analysis, processing and standa...
Agrihub INSPIRE Hackathon 2021: Challenge #7: Analysis, processing and standa...Agrihub INSPIRE Hackathon 2021: Challenge #7: Analysis, processing and standa...
Agrihub INSPIRE Hackathon 2021: Challenge #7: Analysis, processing and standa...plan4all
 
Agrihub INSPIRE Hackathon 2021: Challenge #6 Drones Utilization for Crop Prot...
Agrihub INSPIRE Hackathon 2021: Challenge #6 Drones Utilization for Crop Prot...Agrihub INSPIRE Hackathon 2021: Challenge #6 Drones Utilization for Crop Prot...
Agrihub INSPIRE Hackathon 2021: Challenge #6 Drones Utilization for Crop Prot...plan4all
 
Agrihub INSPIRE Hackathon 2021: Challenge #4 Irrigation Management
Agrihub INSPIRE Hackathon 2021: Challenge #4 Irrigation ManagementAgrihub INSPIRE Hackathon 2021: Challenge #4 Irrigation Management
Agrihub INSPIRE Hackathon 2021: Challenge #4 Irrigation Managementplan4all
 
Agrihub INSPIRE Hackathon 2021: Challenge #2 Crop status monitoring
Agrihub INSPIRE Hackathon 2021: Challenge #2 Crop status monitoringAgrihub INSPIRE Hackathon 2021: Challenge #2 Crop status monitoring
Agrihub INSPIRE Hackathon 2021: Challenge #2 Crop status monitoringplan4all
 
Agrihub INSPIRE Hackathon 2021: Challenge #1 Crop detection
Agrihub INSPIRE Hackathon 2021: Challenge #1 Crop detectionAgrihub INSPIRE Hackathon 2021: Challenge #1 Crop detection
Agrihub INSPIRE Hackathon 2021: Challenge #1 Crop detectionplan4all
 
Challenge #3 agro environmental services final presentation
Challenge #3 agro environmental services final presentationChallenge #3 agro environmental services final presentation
Challenge #3 agro environmental services final presentationplan4all
 
Sieusoil e-brochure (Feb 2021)
Sieusoil e-brochure (Feb 2021)Sieusoil e-brochure (Feb 2021)
Sieusoil e-brochure (Feb 2021)plan4all
 
Webinar 4 Agronode - autonomni telemetricka io t stanice
Webinar 4  Agronode - autonomni telemetricka io t staniceWebinar 4  Agronode - autonomni telemetricka io t stanice
Webinar 4 Agronode - autonomni telemetricka io t staniceplan4all
 
Webinar 3 senslog-otevrene reseni pro integraci senzoru a spravu senzorovyc...
Webinar 3   senslog-otevrene reseni pro integraci senzoru a spravu senzorovyc...Webinar 3   senslog-otevrene reseni pro integraci senzoru a spravu senzorovyc...
Webinar 3 senslog-otevrene reseni pro integraci senzoru a spravu senzorovyc...plan4all
 
Webinar 2 sdileni prostorovych dat
Webinar 2 sdileni prostorovych datWebinar 2 sdileni prostorovych dat
Webinar 2 sdileni prostorovych datplan4all
 
Calculation of agro climatic factors from global climatic data
Calculation of agro climatic factors from global climatic dataCalculation of agro climatic factors from global climatic data
Calculation of agro climatic factors from global climatic dataplan4all
 
Digitalization of indigenous knowledge in African agriculture for fostering f...
Digitalization of indigenous knowledge in African agriculture for fostering f...Digitalization of indigenous knowledge in African agriculture for fostering f...
Digitalization of indigenous knowledge in African agriculture for fostering f...plan4all
 
Atlas of Best Practice
Atlas of Best PracticeAtlas of Best Practice
Atlas of Best Practiceplan4all
 
Euxdat newsletter 10_2020
Euxdat newsletter 10_2020Euxdat newsletter 10_2020
Euxdat newsletter 10_2020plan4all
 
Karel charvat map-compositions-format-intro-presentation-by-karel (1)
Karel charvat map-compositions-format-intro-presentation-by-karel (1)Karel charvat map-compositions-format-intro-presentation-by-karel (1)
Karel charvat map-compositions-format-intro-presentation-by-karel (1)plan4all
 
Karel charvat map-whiteboard-collaborative-map-making-breakout-session
Karel charvat map-whiteboard-collaborative-map-making-breakout-sessionKarel charvat map-whiteboard-collaborative-map-making-breakout-session
Karel charvat map-whiteboard-collaborative-map-making-breakout-sessionplan4all
 
Bridging the Digital Divide Through Consumer Driven Agricultural FarmHub Data...
Bridging the Digital Divide Through Consumer Driven Agricultural FarmHub Data...Bridging the Digital Divide Through Consumer Driven Agricultural FarmHub Data...
Bridging the Digital Divide Through Consumer Driven Agricultural FarmHub Data...plan4all
 
Codes of conduct for farm data sharing
Codes of conduct for farm data sharing Codes of conduct for farm data sharing
Codes of conduct for farm data sharing plan4all
 
Mobilizing Capacity Development in Agriculture for Smallholder Farmers - How ...
Mobilizing Capacity Development in Agriculture for Smallholder Farmers - How ...Mobilizing Capacity Development in Agriculture for Smallholder Farmers - How ...
Mobilizing Capacity Development in Agriculture for Smallholder Farmers - How ...plan4all
 

Mais de plan4all (20)

Agrihub INSPIRE HAckathon 2021: Extreme weather
Agrihub INSPIRE HAckathon 2021: Extreme weather Agrihub INSPIRE HAckathon 2021: Extreme weather
Agrihub INSPIRE HAckathon 2021: Extreme weather
 
Agrihub INSPIRE Hackathon 2021: Challenge #7: Analysis, processing and standa...
Agrihub INSPIRE Hackathon 2021: Challenge #7: Analysis, processing and standa...Agrihub INSPIRE Hackathon 2021: Challenge #7: Analysis, processing and standa...
Agrihub INSPIRE Hackathon 2021: Challenge #7: Analysis, processing and standa...
 
Agrihub INSPIRE Hackathon 2021: Challenge #6 Drones Utilization for Crop Prot...
Agrihub INSPIRE Hackathon 2021: Challenge #6 Drones Utilization for Crop Prot...Agrihub INSPIRE Hackathon 2021: Challenge #6 Drones Utilization for Crop Prot...
Agrihub INSPIRE Hackathon 2021: Challenge #6 Drones Utilization for Crop Prot...
 
Agrihub INSPIRE Hackathon 2021: Challenge #4 Irrigation Management
Agrihub INSPIRE Hackathon 2021: Challenge #4 Irrigation ManagementAgrihub INSPIRE Hackathon 2021: Challenge #4 Irrigation Management
Agrihub INSPIRE Hackathon 2021: Challenge #4 Irrigation Management
 
Agrihub INSPIRE Hackathon 2021: Challenge #2 Crop status monitoring
Agrihub INSPIRE Hackathon 2021: Challenge #2 Crop status monitoringAgrihub INSPIRE Hackathon 2021: Challenge #2 Crop status monitoring
Agrihub INSPIRE Hackathon 2021: Challenge #2 Crop status monitoring
 
Agrihub INSPIRE Hackathon 2021: Challenge #1 Crop detection
Agrihub INSPIRE Hackathon 2021: Challenge #1 Crop detectionAgrihub INSPIRE Hackathon 2021: Challenge #1 Crop detection
Agrihub INSPIRE Hackathon 2021: Challenge #1 Crop detection
 
Challenge #3 agro environmental services final presentation
Challenge #3 agro environmental services final presentationChallenge #3 agro environmental services final presentation
Challenge #3 agro environmental services final presentation
 
Sieusoil e-brochure (Feb 2021)
Sieusoil e-brochure (Feb 2021)Sieusoil e-brochure (Feb 2021)
Sieusoil e-brochure (Feb 2021)
 
Webinar 4 Agronode - autonomni telemetricka io t stanice
Webinar 4  Agronode - autonomni telemetricka io t staniceWebinar 4  Agronode - autonomni telemetricka io t stanice
Webinar 4 Agronode - autonomni telemetricka io t stanice
 
Webinar 3 senslog-otevrene reseni pro integraci senzoru a spravu senzorovyc...
Webinar 3   senslog-otevrene reseni pro integraci senzoru a spravu senzorovyc...Webinar 3   senslog-otevrene reseni pro integraci senzoru a spravu senzorovyc...
Webinar 3 senslog-otevrene reseni pro integraci senzoru a spravu senzorovyc...
 
Webinar 2 sdileni prostorovych dat
Webinar 2 sdileni prostorovych datWebinar 2 sdileni prostorovych dat
Webinar 2 sdileni prostorovych dat
 
Calculation of agro climatic factors from global climatic data
Calculation of agro climatic factors from global climatic dataCalculation of agro climatic factors from global climatic data
Calculation of agro climatic factors from global climatic data
 
Digitalization of indigenous knowledge in African agriculture for fostering f...
Digitalization of indigenous knowledge in African agriculture for fostering f...Digitalization of indigenous knowledge in African agriculture for fostering f...
Digitalization of indigenous knowledge in African agriculture for fostering f...
 
Atlas of Best Practice
Atlas of Best PracticeAtlas of Best Practice
Atlas of Best Practice
 
Euxdat newsletter 10_2020
Euxdat newsletter 10_2020Euxdat newsletter 10_2020
Euxdat newsletter 10_2020
 
Karel charvat map-compositions-format-intro-presentation-by-karel (1)
Karel charvat map-compositions-format-intro-presentation-by-karel (1)Karel charvat map-compositions-format-intro-presentation-by-karel (1)
Karel charvat map-compositions-format-intro-presentation-by-karel (1)
 
Karel charvat map-whiteboard-collaborative-map-making-breakout-session
Karel charvat map-whiteboard-collaborative-map-making-breakout-sessionKarel charvat map-whiteboard-collaborative-map-making-breakout-session
Karel charvat map-whiteboard-collaborative-map-making-breakout-session
 
Bridging the Digital Divide Through Consumer Driven Agricultural FarmHub Data...
Bridging the Digital Divide Through Consumer Driven Agricultural FarmHub Data...Bridging the Digital Divide Through Consumer Driven Agricultural FarmHub Data...
Bridging the Digital Divide Through Consumer Driven Agricultural FarmHub Data...
 
Codes of conduct for farm data sharing
Codes of conduct for farm data sharing Codes of conduct for farm data sharing
Codes of conduct for farm data sharing
 
Mobilizing Capacity Development in Agriculture for Smallholder Farmers - How ...
Mobilizing Capacity Development in Agriculture for Smallholder Farmers - How ...Mobilizing Capacity Development in Agriculture for Smallholder Farmers - How ...
Mobilizing Capacity Development in Agriculture for Smallholder Farmers - How ...
 

D2.2 analysis of_innovative_challenges

  • 1. D 2.2 Analysis of Innovative Challenges 1/226 ECP-2008-GEO-318007 Plan4all Analysis of Innovative Challenges Deliverable number D2.2 Dissemination level Public Delivery date 16th November 2009 Status Final Authors Clemens Beyer (CEIT Alanova) Wolfgang W. Wasserburger (CEIT Alanova) Runar Bergheim (AviNet), Pēteris Brūns (TDF), Karel Charvat (HSRS), Miroslav Dvorak (Olomouc), Petr Horak (HF), Julia Neuschmid (CEIT Alanova), Dimitrov Stelian (EPF), Norma Zanetti (Hyperborea) eContentplus This project is funded under the eContentplus programme1, a multiannual Community programme to make digital content in Europe more accessible, usable and exploitable. 1 OJ L 79, 24.3.2005, p. 1.
  • 2. D 2.2 Analysis of Innovative Challenges 2/226 1 Abstract Plan4all is a European project dealing with spatial planning data interoperability, har- monisation and Spatial Data Infrastructure building. The project is organised in nine work packages (WP), which are further structured into several tasks. This deliverable presents the results of task 2.2 which is part of WP2 – the state of the art analysis – and has the objective to analyse latest developments and innovative challenges in SDI building for spatial planning in Europe. The objective of this deliverable is to assist to pilot partners deploy their infrastructure in WP6.1, to prepare recommenda- tion for possible platforms. The deliverable use results of other two deliverables D 2.1 ―Identification of leading regional and local administration in building SDI for spatial planning‖ describing the detailed situation in single European countries (the report provides a general survey on SDI and spatial planning data in each partner country) and D 2.3 ―INSPIRE Requirements Analysis‖, which analyses requirements coming from INSPIRE directive. The results are based on an analysis of information about relevant software classified according a framework for software classification based on INSPIRE architecture, spataial planning needs and a collection of best practice projects.
  • 3. D 2.2 Analysis of Innovative Challenges 3/226 2 Contents 1 Abstract.............................................................................................................. 2 2 Contents............................................................................................................. 3 3 Introduction ....................................................................................................... 7 3.1 Objectives............................................................................................................. 7 3.2 Structure............................................................................................................... 7 3.3 Methodology......................................................................................................... 7 4 From Geographic Information Systems to Spatial Data Infrastructure building...................................................................................................................... 9 4.1 History and state of the art.................................................................................. 9 4.1.1 Computer Aided Design (CAD).......................................................................................... 9 4.1.2 Geographic Information Systems (GIS)........................................................................... 10 4.1.3 Web Mapping................................................................................................................... 10 4.1.4 Service-Oriented Architecture.......................................................................................... 12 4.1.5 Web 2.0............................................................................................................................ 13 4.2 Standards ............................................................................................................13 4.2.1 W3C................................................................................................................................. 13 4.2.1.1 Extensible Markup Language (XML)....................................................................... 13 4.2.1.2 Simple Object Access Protocol (SOAP) ................................................................. 14 4.2.1.3 Web Service Description Language (WSDL).......................................................... 14 4.2.2 OASIS .............................................................................................................................. 15 4.2.2.1 ebXML..................................................................................................................... 15 4.2.2.2 UDDI........................................................................................................................ 15 4.2.3 OGC................................................................................................................................. 15 4.2.3.1 Geography Markup Language (GML) ..................................................................... 16 4.2.3.2 KML......................................................................................................................... 18 4.2.3.3 Web mapping services (WMS) ............................................................................... 18 4.2.3.4 Web Map Tile Server (WMTS)................................................................................ 18 4.2.3.5 Web feature services (WFS)................................................................................... 19 4.2.3.6 Web coverage services (WCS)............................................................................... 19 4.2.3.7 Styled Layer Descriptor (SLD) ................................................................................ 20 4.2.3.8 Web Map Context ................................................................................................... 20 4.2.3.9 Catalogue Service (CSW)....................................................................................... 20 4.2.3.10 Web Processing Services (WPS) ........................................................................... 21 4.2.4 ISO (International Standardisation Organisation) Metadata standards........................... 22 4.2.5 De Facto Standards......................................................................................................... 23 4.3 Policy...................................................................................................................23 4.3.1 INSPIRE........................................................................................................................... 23 4.4 Initiatives .............................................................................................................24 4.4.1 UNSDI.............................................................................................................................. 24 4.4.2 GMES .............................................................................................................................. 25 4.4.3 GEOSS ............................................................................................................................ 25
  • 4. D 2.2 Analysis of Innovative Challenges 4/226 5 Framework for classifying technologies and services ................................ 26 5.1 Classification given by Plan4all extension of INSPIRE Networking Architecture ....................................................................................................................26 5.2 Classification by standards................................................................................26 5.3 Classification by technology..............................................................................26 5.3.1 Client-Side (User Interface) ............................................................................................. 27 5.3.1.1 File transfer technology........................................................................................... 27 5.3.1.2 Thin Client Web Maps............................................................................................. 27 5.3.1.3 Thick Client Web Maps ........................................................................................... 27 5.3.1.4 Standalone Web Map Applications ......................................................................... 28 5.3.1.5 GIS with ability to use online data........................................................................... 28 5.3.1.6 Browser Extensions ................................................................................................ 28 5.3.1.7 Web-based 3D graphics.......................................................................................... 29 5.3.1.8 Web Browser with scripting extensions .................................................................. 30 5.3.2 Serverside........................................................................................................................ 30 5.3.2.1 Application server.................................................................................................... 30 5.3.2.2 Tile server and ―cookie cutter‖................................................................................. 30 5.3.2.3 File interpreting ....................................................................................................... 30 5.3.2.4 Mapserver with database backend ......................................................................... 31 5.3.2.5 Mapserver with more intelligent functions............................................................... 31 5.3.2.6 Middleware.............................................................................................................. 31 5.3.2.7 Geodatabases......................................................................................................... 31 5.4 Classification by Service....................................................................................31 5.4.1 State of the art ................................................................................................................. 31 5.4.1.1 Proprietary mapping services.................................................................................. 31 5.4.1.2 Direct SQL Requests to Geodatabases.................................................................. 31 5.5 Products ..............................................................................................................32 5.5.1 Template with answering suggestions............................................................................. 32 5.6 Selected Product overview.................................................................................33 6 Chances, potentials, risks of data infrastructure applications ................... 39 6.1 Data Storage........................................................................................................39 6.1.1 Any time access and combined access........................................................................... 39 6.1.2 Redundancy..................................................................................................................... 39 6.2 Data Display ........................................................................................................41 6.2.1 Generalisation.................................................................................................................. 41 6.2.2 Web mapping vs. cartography......................................................................................... 42 6.3 Legal obligation ..................................................................................................43 6.4 Incorrect data use...............................................................................................43 6.5 Derived datasets .................................................................................................43 6.6 Metadata ..............................................................................................................44 6.6.1 Metadata quality............................................................................................................... 44 7 Data evaluation and quality criteria ............................................................... 45
  • 5. D 2.2 Analysis of Innovative Challenges 5/226 7.1 Why Data Quality? ..............................................................................................45 7.2 Aspects of Data Quality......................................................................................45 7.2.1 Accuracy .......................................................................................................................... 46 7.2.2 Completeness.................................................................................................................. 46 7.2.3 Consistency ..................................................................................................................... 47 7.2.4 Currency .......................................................................................................................... 47 7.2.5 Timeliness........................................................................................................................ 48 7.2.6 Volatility............................................................................................................................ 48 7.2.7 Accessibility ..................................................................................................................... 48 7.2.8 Interpretability .................................................................................................................. 48 7.3 How to Achieve Data Quality..............................................................................49 7.4 Summary .............................................................................................................49 8 Detailed examination of existing related EU initiatives and projects ......... 51 8.1 Initiatives, Projects and Best Practises in detail ..............................................51 8.1.1 Overview.......................................................................................................................... 51 8.1.2 Collection ......................................................................................................................... 53 8.2 Overview of the European Initiatives, Projects and Best Practise Documentation .............................................................................................................103 8.2.1 Analysis of European Initiatives, Projects and Best Practise Documentation............... 103 8.2.1.1 Thematic Groups of projects................................................................................. 103 8.2.1.2 Used technology/software..................................................................................... 105 8.2.1.3 Accessibility........................................................................................................... 105 8.2.1.4 Weaknesses and challenges ................................................................................ 105 8.2.2 Comparison of Best Practise projects with Plan4all ...................................................... 108 8.3 Summary ...........................................................................................................110 9 Conclusion – Innovative Challenges ........................................................... 112 9.1 Complexity of planning process......................................................................112 9.2 Different legal context ......................................................................................113 9.3 Cross-border accuracy.....................................................................................113 9.4 Differences in the use of terms........................................................................114 9.5 Differences between cultures ..........................................................................114 9.6 Lack of topology ...............................................................................................114 9.7 Geodata and time..............................................................................................115 9.8 Technology........................................................................................................116 9.8.1 General .......................................................................................................................... 116 9.8.2 Alternative Methods ....................................................................................................... 116 9.8.2.1 Collaborative Mapping .......................................................................................... 116 9.8.2.2 Crowdsourcing ...................................................................................................... 117 9.9 Sustainability.....................................................................................................117
  • 6. D 2.2 Analysis of Innovative Challenges 6/226 9.10 Organisational Challenges...............................................................................117 10 Sources and short Glossary ..................................................................... 118 10.1 Sources..............................................................................................................118 10.2 Glossary ............................................................................................................118 11 Annex A: Known Software ........................................................................ 119 11.1 Graphic Standards............................................................................................119 11.2 Commercial Software .......................................................................................121 11.3 Commercial Software (partly without costs)...................................................150 11.4 Open Source Software......................................................................................153 11.5 Portals ...............................................................................................................198 11.6 Popular services without costs........................................................................199 11.7 Open data projects............................................................................................201 12 Annex B: Survey results ........................................................................... 202 12.1 Assessment of national and regional policies................................................202 12.1.1 Legal Situation........................................................................................................... 202 12.1.2 Data Management..................................................................................................... 207 12.1.3 Survey answers regarding metadata......................................................................... 208 12.2 Spatial Data Infrastructures: State of the Art (survey evaluation).................211 12.2.1 SDI Organisation ....................................................................................................... 212 12.2.2 Interoperability and Metadata.................................................................................... 215 12.2.3 SDI Coordination ....................................................................................................... 218 12.2.4 National Geodatabases............................................................................................. 220 12.2.5 Conclusion from this section of the survey................................................................ 222 12.3 Used software ...................................................................................................223
  • 7. D 2.2 Analysis of Innovative Challenges 7/226 3 Introduction 3.1 Objectives Plan4all focuses on the interoperability and harmonisation of spatial planning data based on the existing best practises in European regions and municipalities and the results of current research projects. The project involves a detailed description and summary of the current situation and standards, proposal, testing and implementation of spatial planning metadata profile, common data model and harmonisation procedures. The important parts of Plan4all are networking standards of spatial plan- ning data, based on previously collected and analysed experiences. Furthermore, common procedures and methods for spatial data sharing will be defined as well as the use of new pan-European standards for spatial planning data within the EU. Expected results from Plan4all are European forums for SDI (Spatial Data Infra- structure) in spatial planning, a database and analysis in terms of organisation, sharing and harmonisation as well as SDI recommendations for spatial planning. Plan4all also focuses on implementing the INSPIRE Directive into the spatial plan- ning process, mainly based on building spatial planning data models and metadata profiles. The project is structured into nine work packages. The aim of Work Package 2 (WP2) is to analyse the current state of the art in spatial planning, the used technologies, INSPIRE requirements and also to identify the requirements that affect the imple- mentation of spatial planning SDI. Into more detail, the objective of the present Task 2.2 out of WP2 is to analyze latest developments and innovative challenges of SDI for spatial planning in Europe. 3.2 Structure This deliverable presents the results of WP2 Task 2.2 and aims to identify innovative challenges in data harmonisation. The first step is to establish a framework for classi- fying technologies and services with focus on technology convergence and the emer- gence of applications. To test that framework a selection of known software packa- ges was described (page 9). The detailed software descriptions are part of Annex A (page 119). The two following chapters deal with the chances, potentials, risks of data infrastructure applications (page 39) as well as data evaluation and quality criteria (page 45). In addition there is a detailed examination of existing related EU projects and a comparison of Best Practise Projects with Plan4all, identifying strengths and weaknesses of spatial planning SDI implementation (page 51). For the assessment of national and regional policies we refer to Deliverable 2.1. On this basis we try to find a conclusion that defines the most innovative challenges on SDI for the future (page 112). 3.3 Methodology The results of Task 2.2 are based on a survey among both, all project partners and the European members of the Paln4all partner ISOCARP. The survey is shared with
  • 8. D 2.2 Analysis of Innovative Challenges 8/226 Task 2.1. Besides, there is a documentation of well known software and of best practise projects that have been collected providing a template questionnaire. Into more detail the survey covers a wide range of topics describing the present situation in spatial planning in each partner country and its subsidiaries. It includes basic information like the availability of plans and the legal situation, cross-border initiatives, data availability and data management, metadata collection, web mapping activities, spatial data infrastructures, national geodatabases and data license models. The survey was also forwarded to the large number of international mem- bers of the project partner ISOCARP so that valuable information could be also retrieved from outside the Plan4all consortium, too. The results of this survey are used in task 2.1 and 2.2 to find out about correlations between the legal situation, the availability of plans and the accessibility of data, in terms of harmonising activities and efforts in building a national SDI. The classification and description of software was done according to a developed framework containing information about the product version, manufacturer, develop- ping period, type, approach, interactivity, technology, metadata management, usage in planning and challenges. A table with the collected software information provides an overview of existing spatial planning related software and classifies suitable soft- ware for Plan4all. The documentation of the best practise projects contains detailed information about the project type, dimension, start, end, partners, goals and content, used technology, strengths and weaknesses, accessibility, user interface and challenges. All together more than 40 best practise projects in Europe could be identified, described and analysed. The complete list of best practise projects and the software classifications can be found in the Annex A (page 119) and also on the internal project wiki. The wiki serves as an online platform that gives access to all project partners and contains all papers, documents, surveys that have been produced so far. In addition to communication via web seminars and workshops are organised, especially the meeting in Schwechat on September 14th and 15th , 2009 and the external Expert Workshop hosted by the University of Rome on October, 5th 2009. The purpose on the one hand was to share information and results on WP2 among the partners on the other hand to get feedback by an external consultation of experts to avoid blindness by routine. Experts especially invited to review this deliverable were Michele Campagna (I), Pawel Decewicz (PL) and Gabor Remetey-Fülöpp (H).
  • 9. D 2.2 Analysis of Innovative Challenges 9/226 4 From Geographic Information Systems to Spatial Data Infrastructure building A spatial data infrastructure (SDI) is a framework of spatial data, metadata, users and tools that are interactively connected in order to use spatial data. Current Spatial Data Infrastructure (SDI) development is combination of data, technologies and standards and legislation and also by implementation initiatives. On the technological side current SDI is mainly based on Web Mapping and Service Oriented Architecture (SOA) and currently also by newly coming Web 2.0 approach. Some of the main principles are that data and metadata should not be managed centrally, but by the data originator respectively owner, and that tools and services connect via computer networks to the various sources. A GIS is often the platform for deploying an individual node within an SDI. To achieve these objectives, good coordination between all the actors is necessary and the definition of standards is very important. Spatial data infrastructure (SDI) is a kind of a service oriented architecture (SOA) and covers a variety of services: discovery services, view services, download services, transformation services and services allowing spatial data services to be invoked. Spatial Data Infrastructure is service based combination of Web Mapping, but also standalone GIS and eventually CAD applications. So there is a short introduction about the development and history of such systems. From the point of view of standardisation the most adequate are effort of Open Geospatial Consortium, ISO, W3C and OASIS. Legislation is defined by INSPIRE directive and implementation of SDI is supported by different European and World wide initiatives as GMES, UNSDI and GEOSS. 4.1 History and state of the art Since web mapping is very much based on ideas used by CAD and GIS there is a short introduction about the development and history of such systems. 4.1.1 Computer Aided Design (CAD) First Computer Aided Design systems came up in the 1970s. In its first days it only served as an equivalent for manual drawing and construction desks. Whereas in the late 1980s with the change to Personal Computers and the addition of 3d Functions CAD Systems got more and more the function of integrated construction systems not only as a graphical representation of already constructed parts. Beginning with the late 1980s in some places still in use, CAD systems were also used to store geographical data. As the needs to represent the earth surface (e. g. different projections) differ a little bit from mechanical parts and geographic users also wanted to store database entries with their features and use some basic geographic functions. Consequently new, so called Geographic Information Systems were developed based upon CAD and database principles. CAD systems typically follow the motto that every feature is drawn in its final representation (‗What you see is what you get‘ – ‗Wysiwyg‘) whereas the upcoming
  • 10. D 2.2 Analysis of Innovative Challenges 10/226 Geographic systems store features without a special graphical representation and produce that upon database items. In the time being some complex CAD systems integrated also GIS functions or put hybrid systems into market. A typical system that follows this approach is Autodesk Map which combines the fully featured 3d AutoCAD with 2d GIS functions. 4.1.2 Geographic Information Systems (GIS) It is difficult to be defined when exactly the contemporary GIS technology was estab- lished, because GIS technology evolved through multiple parallel but separate appli- cations across numerous disciplines and researchers. One of the most important facts of the GIS history was the development of the GBF-DIME files by the U.S. Cen- sus Bureau in the 1960s which is one of the first examples of governmental initiative, using digital mapping and digital spatial data. Later that initiative led to the develop- ment of the Census TIGER files, which are in use today. In the 1970s the further development of the GIS technology continued mainly within the universities, where the first approaches and prototypes for the later so called Geographic Information Systems were developed. Such prototype is the program SYMAP, developed at the Laboratory for Computer Graphics and Spatial Analysis at the Harvard Graduate School of Design in 1966, which was widely distributed and served as a model for later systems. One of the most important pioneering projects from that period is the so called Canada Geographic Information System (CGIS). It was developed in the 1960s and 1970s to assist in regulatory procedures of land-use management and resource monitoring. This simple automated computer processes designed to store and process large amounts of spatial data enabled Canada to begin a national land- use management program and become a foremost promoter of geographic informa- tion systems (GIS). With the upcoming graphical user interfaces these systems were first used outside of universities and programming companies in the late 1980s. Opposite to CAD systems their advantage was that features could be printed (to screen or paper) in different variations depending from database entries. Besides, these new geographic functions allowed the overlay of different datasets and the automatic creation of combined datasets. Later on also map projections of the earth were fully integrated and graphical retrieving data became more and more easy. Whereas these systems followed the CAD approach to store explicitly borders between features (Vector GIS), alternatives were developed in Raster GIS which stored all values for every single cell. At first this approach was mainly used because of memory and CPU restrictions. However, nowadays such systems are mainly used for remote sensing data or to represent continuous changing data. Today nearly all systems allow the use of both approaches. 4.1.3 Web Mapping With the upcoming of the World Wide Web (WWW), first ideas came up how to represent maps in the Web. As a first approach pictures were placed in HTML pages originating from scans of paper material or electronic drawings.
  • 11. D 2.2 Analysis of Innovative Challenges 11/226 Shortly after the web gathered momentum, first applications were developed which generated HTML pages on the fly based upon database entries. Shortly afterwards people also began to think about dynamically generated maps for the web. First approaches used manually tiled maps and combined them e. g. dynamically with points of interest. While this was based upon manual work it was rarely used for more than one city. Because of very complex developments it took some years before the first commercially programmed web map servers were introduced to the public in the late 1990s. Most of them follow the approach to tile pre produced huge bitmaps on the fly or produce small tiles out of vector data dynamically (e. g. ArcView IMS). Only few other products tried to serve vector data to dedicated HTML clients (e. g. Arc- Explorer) or browser extensions (Java Applets, Netscape PlugIns or Microsoft Internet Explorer ActiveX; e. g. Autodesk MapGuide). Whereas the first approach was restricted by serverside CPUs and the size because of small bandwidths, the second approach had the disadvantage of downloading (or getting on disks) and installing extensions. Based on today‘s bandwidths these problems no longer exist in many countries and developers got the chance to decide which approach to use upon user and application requirements. As another indirect change in the information business open source technologies became more important. Nowadays open source products are market leader in web mapping. Web mapping is understood as implementation of automatically generated maps through internet infrastructure. The term web GIS is often used simultaneously but the meaning of web GIS is much wider as it also includes analysis and geoproces- sing functions whereas web mapping just deals with map generation, display and navigation within the map. As web mapping tools become more and more powerful, the border between web mapping and web GIS is, however, not always clear. Further on, only the term ―web mapping‖ (or ―web map‖) will be used. Web maps are mainly dissemination media, i. e. they serve as visualisation tool for geodata which are queried from one or more (also distributed) servers. One of the huge advantages of this technology is the fact that data updates are very simple: As the source data on a map server is altered, all web mapping clients will instantly also receive the updated datasets, having no need to update every single client on its own. Beside that modern upcoming web services are enabled to use disperse stored data.
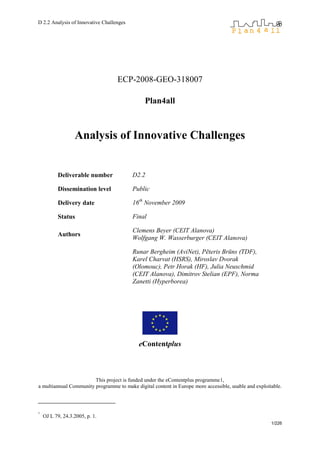
  • 12. D 2.2 Analysis of Innovative Challenges 12/226 A short overview: Fig. 1: Web Mapping Application Overview A spatial data infrastructure (SDI) is a framework of spatial data, metadata, users and tools that are interactively connected in order to use spatial data. Some of the main principles are that data and metadata should not be managed centrally, but by the data originator respectively owner, and that tools and services connect via computer networks to the various sources. A GIS is often the platform for deploying an individual node within an SDI. To achieve these objectives, good coordination between all the actors is necessary and the definition of standards is very important. Spatial data infrastructure (SDI) is a kind of a service oriented architecture (SOA) and covers a variety of services: discovery services, view services, download services, transformation services and services allowing spatial data services to be invoked. 4.1.4 Service-Oriented Architecture In computing, service-oriented architecture (SOA) provides a set of principles of governing concepts used during phases of system development and integration. Such an architecture will package functionality as interoperable services: software modules provided as a service can be integrated or used by several organisations, even if their respective client systems are substantially different. Web services can implement a service-oriented architecture. Web services make functional building-blocks accessible over standard Internet protocols independent of Web Mapping Server Users Database Geodatabases Geodata file archive Mobile Users Web Mapping Application Overview Application Server
  • 13. D 2.2 Analysis of Innovative Challenges 13/226 platforms and programming languages. These services can be new applications or just wrapped around existing legacy systems to make them network-enabled. Each SOA building block can play one or both of two roles: a) server; b) server and client; c) client. The current development of SOA is mainly defined by consortiums W3C, OASIS and in SDI by Open Geospatial Consortium. 4.1.5 Web 2.0 Web 2.0 is commonly associated with web applications which facilitate interactive information sharing, interoperability, user-centered design and collaboration on the World Wide Web. Examples of Web 2.0 include web-based communities, hosted services, web applications, social-networking sites, video-sharing sites, wikis, blogs, mashups and folksonomies. A Web 2.0 site allows its users to interact with other users or to change website content, in contrast to non-interactive websites where users are limited to the passive viewing of information that is provided to them. As example of Web 2.0 application could be mentioned GoogleMaps or OpenStreetMap. Google Maps also offer full interactivity as users can draw their own content directly into the map. In contrast to WFS-T, Google has a strict distinction between user generated content and original content provided by the company itself which is also a form of a digital rights management. However, Google Maps are not fully OGC compliant: WMS can be shown in Google applications but Google data cannot be accessed via WMS requests. OpenStreetMap: Beside the Google Applications OpenStreetMap offers its own standards as an open alternative; since more than 100,000 contributors work on the maps it is emerging like Wikipedia and cannot be ignored in some situations where planning data is rare. 4.2 Standards 4.2.1 W3C The World Wide Web Consortium (W3C) is an international community based on member participation, which defines the standard for World Wide Web. Currently, the most relevant standards for SDI building are XML, SOAP and WSDL. 4.2.1.1Extensible Markup Language (XML) XML (Extensible Markup Language) is a set of rules for encoding documents electronically. It is a textual data format, with strong support via Unicode for the languages of the world. XML is used as common interface for many applications, there also exist several schema systems designed to aid in the definition of XML- based languages.
  • 14. D 2.2 Analysis of Innovative Challenges 14/226 A XML document is a string of characters. The characters could be markup or content. They are distinguished by the application of simple syntactic rules. Markup either begin with the character "<" and end with a ">", or begin with the character "&" (ampersand) and end with a ";" (semicolon). Strings of characters which are not markup are content. Tags are a markup beginning with "<" and ending with ">". Elements are a logical component of a document which either begins with a start-tag and ends with a matching end-tag, or consists only of an empty-element tag. The characters between the start- and end-tags are content. Attribute are a markup construct consisting of a name/value pair that exists within a start-tag or empty- element tag. Software which processes an XML document are called processor. It works in the service of an application. The processor is often referred to colloquially as an XML parser. 4.2.1.2Simple Object Access Protocol (SOAP) SOAP is a basic protocol supporting exchange of structured information for Web Services. It is based on Extensible Markup Language (XML) as its message format. SOAP provides a basic messaging framework for Web service. SOAP is composed from several layers:  message exchange patterns (MEP),  underlying transport protocol bindings,  message processing models,  protocol extensibility. Both SMTP and HTTP are valid application layer protocols used as transport for SOAP, but HTTP has gained wider acceptance as it works well with today's Internet infrastructure; specifically, HTTP works well with network firewalls. SOAP may also be used over HTTPS. XML is used as the standard message format because of its widespread use by major corporations and open source development efforts. 4.2.1.3Web Service Description Language (WSDL) WSDL is an XML format for describing network services as a set of endpoints operating on messages containing either document-oriented or procedure-oriented information. The operations and messages are described abstractly, and then bound to a concrete network protocol and message format to define an endpoint. Related concrete endpoints are combined into abstract endpoints (services). WSDL is extensible to allow description of endpoints and their messages regardless of what message formats or network protocols are used to communicate, however, the only bindings described in this document describe how to use WSDL in conjunction with SOAP 1.1, HTTP GET/POST, and MIME. WSDL is an XML format for describing network services as a set of endpoints operating on messages containing either document-oriented or procedure-oriented
  • 15. D 2.2 Analysis of Innovative Challenges 15/226 information. The operations and messages are described abstractly, and then bound to a concrete network protocol and message format to define an endpoint. Related concrete endpoints are combined into abstract endpoints (services). WSDL is extensible to allow description of endpoints and their messages regardless of what message formats or network protocols are used to communicate, however, the only bindings described in this document describe how to use WSDL in conjunction with SOAP 1.1, HTTP GET/POST, and MIME. 4.2.2 OASIS OASIS (Organisation for the Advancement of Structured Information Standards) is a non-profit consortium that drives the development, convergence and adoption of open standards for the global information society. The consortium produces more Web service standards than any other organisation along with standards for security, eBusiness, and standardisation efforts in the public sector and for application-specific markets. Two main relevant standards of OASIS are ebXML and UDDI. 4.2.2.1ebXML Electronic Business using eXtensible Markup Language, commonly known as e- business XML a family of XML based standards sponsored by OASIS and UN/CEFACT. There exist 6 specifications, 5 parts of the work were submitted to ISO TC 154 for approval. The International Organization for Standardization (ISO) has approved the following five ebXML specifications as the ISO 15000 standard, under the general title, Electronic business eXtensible markup language:  ISO 15000-1: ebXML Collaborative Partner Profile Agreement  ISO 15000-2: ebXML Messaging Service Specification  ISO 15000-3: ebXML Registry Information Model  ISO 15000-4: ebXML Registry Services Specification  ISO 15000-5: ebXML Core Components Technical Specification 4.2.2.2UDDI Universal Description, Discovery and Integration (UDDI) is a platform-independent, Extensible Markup Language (XML)-based registry for businesses worldwide to list themselves on the Internet. The UDDI was integrated into the Web Services Intero- perability (WS-I) standard as a central pillar of web services infrastructure. The UDDI specifications supported a publicly accessible Universal Business Registry in which a naming system was built around the UDDI-driven service broker. 4.2.3 OGC The Open Geospatial Consortium, Inc (OGC) is an international industry consortium of companies, government agencies and universities participating in a consensus process to develop publicly available interface standards. OpenGIS® Standards support interoperable solutions that "geo-enable" the Web, wireless and location- based services, and mainstream IT. The standards empower technology developers
  • 16. D 2.2 Analysis of Innovative Challenges 16/226 to make complex spatial information and services accessible and useful with all kinds of applications. The OGC adopted sets of standards, which are important for Plan4all implementation. 4.2.3.1Geography Markup Language (GML) The Geography Markup Language (GML) is an XML grammar for expressing geographical features. It serves as a modelling language for geographic systems as well as an open interchange format for geographic transactions on the internet. As with most XML based grammars, there are two parts to the grammar – the schema that describes the document and the instance document that contains the actual data, i. e. the spatial and non-spatial properties of geographic features. The encoding is done in compliance with ISO 19118 for the transport and storage of geographic information modeled according to the conceptual modeling framework used in the ISO 19100 series of International Standards and including both the spatial and non- spatial properties of geographic features. GML serves as a modelling language for geographic systems as well as an open interchange format for geographic transactions on the Internet. The concept of features in GML is a very general one and includes not only conventional ―vector" or discrete objects, but also coverage and sensor data. The ability to integrate all forms of geographic information is a key element for the use of GML. Since 2007 GML is published as ISO standard ISO 19136:2007. The previous version (2.1.2) of GML was concerned with what the OGC calls simple features: features whose geometric properties are restricted to ―simple‖ geometries. For example, a city could be represented as a feature collection where the individual features represent such things as rivers, roads and colleges. Each of these feature types would have named and typed properties. The 3.0 version of GML addresses needs that were not addressed or adequately met in previous versions, and in particular:  simple 2D linear features come with enhanced features including temporal properties, coverages, dynamic features, complex, non-linear, 3D geometry features, 2D topology;  representation of spatial and temporal reference systems, units of measure and standards information;  use reference system, units and standards information in the representation of geospatial phenomena, observations and values;  representation of default styles for feature and coverage visualisation; GML 3.0 specification defines the XML Schema syntax, mechanisms, and conventions that:  Provide an open, vendor-neutral framework for the definition of geospatial application schemas and objects;  Allow profiles that support proper subsets of GML framework descriptive capabilities;
  • 17. D 2.2 Analysis of Innovative Challenges 17/226  Support the description of geospatial application schemas for specialised domains and information communities;  Enable the creation and maintenance of linked geographic application schemas and datasets;  Support the storage and transport of application schemas and data sets;  Increase the ability of organisations to share geographic application schemas and the information they describe. Last versions of GML (3.1.1 and 3.2.1) add new geometries, are more compliant with the ISO/TC 211 family of specifications and contain some items for increased efficiency and simplicity. The last versions maintain backward compatibility for GML version 3.0.0 and 2.1.2 instance documents by preserving, but deprecating, some schema components that have been replaced by different constructs in the current version. Last enhancements, include:  The Temporal Reference Systems schema for GML 3.1 provides constructs for handling various styles of temporal reference system. This schema reflects a partial implementation of the model described in ISO 19108:2002.  Temporal topology schema for ISO19136 provides constructs for handling topological complexes and temporal feature relationships. Temporal geometric characteristics of features are represented as instants and periods. While, temporal context of features that does not relate to the position of time is described as connectivity relationships among instants and periods. These relationships are called temporal topology, as they do not change in time, as long as the direction of time does not change. It is used effectively in the case of describing a family tree expressing evolution of species, an ecological cycle, a lineage of lands or buildings, or a history of separation and merger of administrative boundaries. This schema reflects a partial yet consistent implementation of the model described in ISO 19108:2002.  Support for Void (ISO/IEC 11404)  Symbols for units of measurements. In addition to using names of commonly accepted units (e. g. ISO 31) references to application domain specific unit definitions are required. To support commonly used unit symbols like ―s‖ for seconds, unit references now are a union of: o a reference to an application defined units dictionary (like in GML 3.1.1) o a string that follows the UCUM rules for naming units using the case sensitive symbol labels.  By value and by reference encoding and ownership of a property value. By- value or by-reference in a GML property and ―ownership‖ (deep-copy, deep- delete) are different concepts. This was clarified.  Element substitutability vs type derivation. In GML 3.1, requirements were often focused on content model definitions (e. g. ―feature-type types must be
  • 18. D 2.2 Analysis of Innovative Challenges 18/226 ultimately derived from gml:AbstractFeatureType‖) which are an artefact of the W3C XML Schema language and are thus normally invisible. The requirements did not focus on components that can appear in instance documents, i. e. elements representing features whose name is the feature type and which are substitutable for gml:AbstractFeature. This has been changed.  Collection types. All existing collection types in GML including the feature collection types have been deprecated. 4.2.3.2KML KML is an XML language focused on geographic visualisation, including annotation of maps and images. Geographic visualisation includes not only the presentation of graphical data on the globe, but also the control of the user's navigation in the sense of where to go and where to look. Google submitted KML (formerly Keyhole Markup Language) to the Open Geospatial Consortium (OGC) to be evolved within the OGC consensus process with the following goal: KML Version 2.2 has been adopted as an OGC implementation standard. 4.2.3.3Web mapping services (WMS) A Web Map Service (WMS) is a standard protocol for serving map images over the internet that are generated by a map server using data from a geographic data resource or raster images. The specification was developed and first published by the OGC in 1999. The classic web map service (WMS) today is the most important technology in this group for planning purposes. It passes the user‘s requests to the map server and receives an image file which is generated by the map server on the fly upon request. The map which is displayed to the user consists of one or more images depending on the clients requests. An OGC Web Map Service (WMS) produces maps of spatially referenced data dynamically from geographic information. This international standard defines a "map" to be a portrayal of geographic information as a digital image file suitable for display on a computer screen. A map is not the data itself. WMS-produced maps are generally rendered in a pictorial format such as PNG, GIF or JPEG, or occasionally as vector-based graphical elements in Scalable Vector Graphics (SVG) or Web Computer Graphics Metafile (WebCGM) formats. This is in contrast to a Web Feature Service (WFS) – which returns actual vector data – and a Web Coverage Service (WCS) – which returns actual raster data. 4.2.3.4Web Map Tile Server (WMTS) The candidate WMTS Interface Standard is much like the OGC's popular Web Map Server (WMS) Interface Standard, but it enables better server performance in applications that involve many simultaneous requests. To improve performance, instead of creating a new image for each request, it returns small pre-generated
  • 19. D 2.2 Analysis of Innovative Challenges 19/226 images (e. g., PNG or JPEG) or reuses identical previous requests that follow a discrete set of tile matrices. This proposed standard provides support for multiple architectural patterns - KVP, REST and SOAP. 4.2.3.5Web feature services (WFS) The Open Geospatial Consortium Web Feature Service Interface Standard (WFS) provides an interface allowing requests for geographical features across the web using platform-independent calls. WFS is oriented for vector data exchange on the Internet. It uses GML format for data transfer. Both geometric and attribute informa- tion are transferred with GML. Also OGC Web gazetteer Service profile is derived from this service. An extended capability of the service enables transactional opera- tions like insert/update/delete features on remote servers. WFS uses also Filter Encoding for querying. The 1.0 version of the Web Feature Service Interface Specification (WFS) was published by the Open Geospatial Consortium on September 2002. This specification purpose is to describe data manipulation operation on OpenGIS Simple Features (feature instances) allowing servers and clients to ―communicate‖ on the feature level. A WFS-compliant service provides client applications with real spatial data (i. e. OGC geospatial Features), typically expressed as an XML-encoded file. The WFS Transaction (WFS-T) operation is used to describe data transformation operations that are to be applied to web accessible feature instances. A web feature service may process a Transaction operation directly or possibly translate it into the language of a target datastore to which it is connected and then have the datastore execute the transaction. When the transaction has been completed, a web feature service will generate an XML response document indicating the completion status of the transaction. The Transaction operation is optional and a WFS implementation does not need to support it to conform to this specification. If the Transaction operation is supported then this fact must be advertised in GetCapabilities results. 4.2.3.6Web coverage services (WCS) The WCS may be compared to the OGC Web Map Service (WMS) and the Web Feature Service (WFS); like them it allows clients to choose portions of a server's information holdings based on spatial constraints and other criteria, but the WCS deals with raster data instead of vector data (WFS). WCS supports electronic retrieval of geospatial data as "coverages" – which is digital geospatial information representing space-varying phenomena. This service enables data transfer in native format together with metadata needed for data interpretation. Only raster data are currently supported, vector data are planed to be incorporated in the future. This service plays important role for satellite data transfer in the system. The Web Coverage Service provides three operations: GetCapabilities (typical to all OGC WxS standards), GetCoverage, and DescribeCoverage.
  • 20. D 2.2 Analysis of Innovative Challenges 20/226 4.2.3.7Styled Layer Descriptor (SLD) A Styled Layer Descriptor (SLD) is an XML schema specified by the Open Geospatial Consortium (OGC) for describing the appearance of map layers. It is capable of describing the rendering of vector and raster data. A typical use of SLDs is to instruct a Web Map Service (WMS) of how to render a specific layer. Since 2007 the SLD specification has been split up into two new OGC specifications:  Symbology Encoding Implementation Specification (SE)  Styled Layer Descriptor Styled Layer Descriptor Specification now only contains the protocol for communicating with a WMS about how to style a layer. The actual description of the styling is now exclusively described in the Symbology Encoding Implementation Specification. 4.2.3.8Web Map Context WMS 1.1.1 specifies how individual map servers describe and provide their map content. The Context specification states how a specific grouping of one or more maps from one or more map servers can be described in a portable, platform-inde- pendent format for storage in a repository or for transmission between clients. This description is known as a "Web Map Context Document", or simply a "Context". Presently, context documents are primarily designed for WMS bindings. However, extensibility is envisioned for binding to other services. A Context document includes information about the server(s) providing layer(s) in the overall map, the bounding box and map projection shared by all the maps, sufficient operational metadata for Client software to reproduce the map, and ancillary meta- data used to annotate or describe the maps and their provenance for the benefit of human viewers. 4.2.3.9Catalogue Service (CSW) Catalogue services support the ability to publish and search collections of descriptive information (metadata) for data, services, and related information objects. Metadata in catalogues represent resource characteristics that can be queried and presented for evaluation and further processing by both humans and software. Catalogue services are required to support the discovery and binding to registered information resources within an information community. Metadata act as generalised properties that can be queried and returned through catalogue services for resource evaluation and, in many cases, invocation or retrieval of the referenced resource. Catalogue services support the use of one of several identified query languages to find and return results using well-known content models (metadata schemas) and encodings. Catalogue services are the key technology for locating, managing and maintaining distributed geo-resources (i. e. geospatial data, applications and services). With OGC catalogue services, client applications are capable of searching for geo-resources in a standardised way (i. e. through standardised interfaces and operations) and, ideally, they are based on a well-known information model, which includes spatial
  • 21. D 2.2 Analysis of Innovative Challenges 21/226 references and further descriptive (thematic) information that enables client applications to search for geo-resources in very efficient ways. Whereas interfaces and operations of OGC catalogue services are well defined, it is left up to the developer of the system to define a specific information model which a catalogue service instance provides. This includes, but is not limited to, the information which can be inserted in the catalogue, supported query languages, available search terms, response/result sets, etc. This point is of major importance with respect to interoperability between different catalogue service instances. The CSW information model is based on the international standard for metadata description ISO 19115:2003/Cor.1:20066. In addition, the catalogue uses a metadata description for service metadata based on the ISO 19119:2005/PDAM 17 standard [ISO 19119] to facilitate the management of service metadata. The encoding of any information object in this profile is based on ISO/TS19139. The main purpose of the information model is to provide a formal structure for the description of information resources that can be managed by a catalogue service that complies with the application profile. The current standard is CSW 2.0.2, which is supported by metadata system ―Micka‖ and also an implementation in ―GeoNetwork opensource‖ is expected. 4.2.3.10 Web Processing Services (WPS) The OpenGIS Web Processing Service (WPS) Interface Standard from Open Geo- spatial Consortium defines a standardised interface that facilitates the publishing of geospatial processes on the web and the discovery of and binding to those proces- ses by clients. ―Processes‖ include any algorithm, calculation or model that operates on spatially referenced data. ―Publishing‖ means making available machine-readable binding information as well as human-readable metadata that allows service disco- very and use. A WPS can be configured to offer any sort of GIS functionality to clients across a network, including access to pre-programmed calculations respec- tivly computation models that operate on spatially referenced data. The data required by the WPS can be delivered across a network, or is available on a server. This inter- face specification provides mechanisms to identify the spatially referenced data re- quired by the calculation, initiate the calculation and manage the output so that the client can access it. This Web Processing Service is targeted at processing both vector and raster data. The WPS specification is designed to allow a service provider to expose a web accessible process, such as polygon intersection, in a way that allows clients to input data and execute the process with no specialised knowledge of the underlying physical process interface or API. The WPS interface standardises the way processes and their inputs/outputs are described, how a client can request the execution of a process, and how the output from a process is handled. Because WPS offers a generic interface, it can be used to wrap other existing and planned OGC services that focus on providing geospatial processing services. For instance Python Web Processing Service is an implementation of the Web processing Service standard.
  • 22. D 2.2 Analysis of Innovative Challenges 22/226 The specified Web Processing Service (WPS) provides client access to pre-pro- grammed calculations and/or computation models that operate on spatially referen- ced data. The data required by the service can be delivered across a network, or available at the server. This data can use image data formats or data exchange stan- dards such as Geography Markup Language (GML) or Geolinked Data Access Ser- vice (GDAS). The calculation can be as simple as subtracting one set of spatially referenced numbers from another (e.g. determining the difference in influenza cases between two different seasons), or as complicated as a global climate change model. The WPS interface specifies three operations that can be requested by a client and performed by a WPS server, all mandatory implementation by all servers. Those operations are: 4.2.4 ISO (International Standardisation Organisation) Metadata standards ISO 19115:2003 defines the schema required for describing geographic information and services. It provides information about the identification, the extent, the quality, the spatial and temporal schema, spatial reference, and distribution of digital geographic data. ISO 19115:2003 is applicable to:  the cataloguing of datasets, clearinghouse activities, and the full description of datasets;  geographic datasets, dataset series, and individual geographic features and feature properties. ISO 19115:2003 defines:  mandatory and conditional metadata sections, metadata entities, and metadata elements;  the minimum set of metadata required to serve the full range of metadata applications (data discovery, determining data fitness for use, data access, data transfer, and use of digital data);  optional metadata elements - to allow for a more extensive standard description of geographic data, if required;  a method for extending metadata to fit specialised needs. Though ISO 19115:2003 is applicable to digital data, its principles can be extended to many other forms of geographic data such as maps, charts, and textual documents as well as non-geographic data. ISO 19119:2005 identifies and defines the architecture patterns for service interfaces used for geographic information, defines its relationship to the Open Systems Environment model, presents a geographic services taxonomy and a list of example geographic services placed in the services taxonomy. It also prescribes how to create a platform-neutral service specification, how to derive conformant platform-specific
  • 23. D 2.2 Analysis of Innovative Challenges 23/226 service specifications, and provides guidelines for the selection and specification of geographic services from both platform-neutral and platform-specific perspectives. ISO/TS 19139:2007 defines Geographic MetaData XML (gmd) encoding, an XML Schema implementation derived from ISO 19115. 4.2.5 De Facto Standards  GeoRSS  GeoJSON 4.3 Policy 4.3.1 INSPIRE INSPIRE (Infrastructure for Spatial Information in Europe) is the name of an EU directive for the development of an European Spatial Data Infrastructure. INSPIRE Directive 2007/2/EC of the European Parliament and of the Council of 14th March 2007 establishing an Infrastructure for Spatial Information in the European Commu- nity (INSPIRE) entered into force on the 15th May 2007. Member States have until 15th May 2009 to transpose the Directive into their legislative systems. INSPIRE lays down general rules to establish an infrastructure for spatial information in Europe for the purposes of Community environmental policies, and policies or activities which may have an impact on the environment. The goal of the infrastructure is to support the European Environmental policy and decision-making. The directive is legally binding for EU member states and includes explicit deadlines for its implementation. The detail description of INSPIRE rules is in D 2.3 INSPIRE Requirements Analysis The implementing rules will be of major relevance for the implementation of the INSPIRE directive. They are currently developed and specified by five drafting teams. The drafting teams cover the following topics:  Metadata  Data specifications  Network services  Data and service sharing  Monitoring and reporting INSPIRE Network Services Architecture is based on the description provided in the INSPIRE Technical Architecture Overview document. At the core of the architecture are the INSPIRE Service Types:  Discovery  View  Download  Transform  Invoke 2 2 See D2.3 INSPIRE Requirements Analysis
  • 24. D 2.2 Analysis of Innovative Challenges 24/226 4.4 Initiatives 4.4.1 UNSDI Formed in 2000, UNGIWG (United Nations Geospatial Information Working Group) comprises a network of UN professionals and others, working in the fields of carto- graphy and geospatial information management science to address common geo- spatial issues - maps, boundaries, data exchange, standards, naming conventions, and location. It also works directly with nongovernmental organisations, research institutions and industry to develop and maintain common geographic databases and geospatial technologies to enhance guidance and operational capabilities. Since its inception, UNGIWG has been laying the foundations for a UNSDI (United Nations Spatial Data Infrastructure). The accomplishments of its Task Groups in particular indicated that refinement and refocusing of current activities and UNGIWG organi- sation could deliver the components for such a system. During the 7th UNGIWG Plenary meeting held in Santiago in November 2006, it has been recognised that the development of a common vision and understanding on UNSDI was a priority. In order to build on common interests, the UNGIWG Secretariat consulted the UN agencies on the activities carried out within the agency that could benefit from the UNSDI. Four primary UN business cases drive the need for a UNSDI: 1. Provision of spatial data and information 2. Development of common data services 3. Capacity building 4. Promotion of partnerships and cooperation The UNSDI Vision is for a comprehensive, decentralised geospatial information fra- mework that facilitates decision-making at various levels by enabling access, retrieval and dissemination of geospatial data and information in a rapid and secure way. Achieving this vision in the milieu of UN reform, delivering on the MDGs (Millennium Development Goals) and attending to the remits of evolving global governance requi- res a mechanism to establish system coherence for the applications and exchange of geospatial data for UN activities. The UNSDI is such a mechanism. It enables interoperability between spatial data infrastructures developed for specific purposes that operate within UN agencies, among groups of UN agencies sharing common interests, and between the UN, Member States and their regional and thematic groupings, and partners. To achieve this the UNSDI provides a base collection of technologies, datasets, human resour- ces, policies, institutional arrangements, and partnerships that facilitate the availa- bility, exchange of, access to and use of geographically-related information using standard practices, protocols, and specifications. Where SDI's do not yet exist - within or beyond the bounds of the UN - it is in the UN's interest to foster their deve- lopment as a means of encouraging improved ease of access and re-use of spatial data to support the MDGs, the UN reform agenda and the tenets of the UN Charter. At its core, the UNSDI will contribute substantively to the million of the United Nations by engaging member states, regional organisations and partners in building consen-
  • 25. D 2.2 Analysis of Innovative Challenges 25/226 sus, policy and governance mechanisms to ensure that geospatial data and informa- tion sharing practices are used widely in social, economic and environmental deve- lopment. Access, retrieval, and dissemination of geospatial data and services will be enabled in an easy and secure way by the UNSDI, avoiding duplication in data collection and management within the United Nations, and with and between its member states and partners. By facilitating efficient global and local access, exchange and utilisation of geospatial information to both developed and developing countries, the UNSDI will enhance decision-making on a global basis and at all levels of societies and thus contribute substantively to the achievement of the Millennium Development Goals (MDGs).The UNSDI will also provide opportunities to increase UN efficiencies and effectiveness in the context of the recent UN reform agenda and by facilitating the demands of increa- sing global governance. 4.4.2 GMES The objective of GMES is to provide, on a sustained basis, reliable and timely servi- ces related to environmental and security issues in support of public policy makers‘ needs. GMES is an EU-led initiative, in which ESA implements the space component and the Commission manages actions for identifying and developing services relying both on in-situ and space-borne remote sensing data. GMES will use, to the maxi- mum extent possible, existing capacities, weather they are national or European. This entails cooperation between the European Community, ESA and their Member States. 4.4.3 GEOSS The Global Earth Observation System of Systems will provide decision-support tools to a wide variety of users. As with the Internet, GEOSS will be a global and flexible network of content providers allowing decision makers to access an extraordinary range of information at their desk. This ‗system of systems‘ will proactively link together existing and planned observing systems around the world and support the development of new systems where gaps currently exist. It will promote common technical standards so that data from the thousands of different instruments can be combined into coherent data sets. The ‗GEOPortal‘ offers a single Internet access point for users seeking data, imagery and analytical software packages relevant to all parts of the globe. It connects users to existing data bases and portals and provides reliable, up-to-date and user friendly information – vital for the work of decision makers, planners and emergency mana- gers. For users with limited or no access to the Internet, similar information is available via the ‗GEONETCast‘ network of telecommunication
  • 26. D 2.2 Analysis of Innovative Challenges 26/226 5 Framework for classifying technologies and services An important part of the state of the art analysis is to identify relevant GIS techno- logies and services. To make them more structured, we described a framework to classify software products, which was tested by classifying a couple of existing products. The framework includes minimum requirements for software and services in SDI and several classifications (classification by technology, by interactivity, by approach). First of all we need this framework to test it and to see if it is useful in SDI context (or will be within the project time). Second, we need detailed software description to decide which software could be used for the development of Plan4all prototype. 5.1 Classification given by Plan4all extension of INSPIRE Networ- king Architecture The INSPIRE networking Architecture define next five types of basic services: • Discovery • View • Downloading • Transformation • Invoke The definition of this services is described detail in D 2.3 INSPIRE Requirements Analysis. This services are defined mainly for sharing data and services across Europe. INSPIRE services doesn‘t include such functionality like digitalisation, data collection, data analysis, routing, design and planning. So for classification of soft- ware we will use next additional type of services: • Digitalisation • Data collection • Digital cartography • Data analysis • Routing • Design and planning activity 5.2 Classification by standards Classification by standards is given by OGC and ISO standards described in the pre- vious chapter. 5.3 Classification by technology There are various types of web mapping applications which have different goals, use different technologies and are addressing different target groups. Therefore, we set up a number of groups to classify web mapping and online geo data manipulation by used technology.
  • 27. D 2.2 Analysis of Innovative Challenges 27/226 5.3.1 Client-Side (User Interface) 5.3.1.1File transfer technology The simpliest form of map acquisition through the web is a download-only map where you can view and/or download any static map (image file or pdf). There is no interactivity and no direct connection to a map server or geodatabase. The download can only be updated by replacing the downloadable file. Because files may be very large in size someone should mention that this download may use the more robust FTP protocol too. In such a case all intelligence of the application must be provided server side. Such systems are outdated in the SDI context. 5.3.1.2Thin Client Web Maps In a time when it was quite unsafe that browsers could interpret JavaScript typical web mapping clients consisted of a serverside calculated map picture surrounded by many hyperlinks (e. g. for zoom, pan, switch layers, query attribute data), and probably also reacting on clicks within the image as they were embedded in a HTML form. On click the whole HTML page as well as the embedded image was reloaded from the server where it also was regenerated just in the client requested size. Such systems are working with nearly any graphical browser, even very outdated versions. First versions of web mapping servers from the commercial GIS companies worked in that way in the late 1990s just like the mapserver from the University of Minnesota (In the time being this server component has also grown at a similar pace as its commercial counterparts and offer all the OGC interfaces to a similar or higher degree of conformance.), where this behaviour is still in use nowadays. Since first mobile devices, especially mobile phones, had low technical possibilities this technology was also reused for the first mobile applications, e. g. with WAP. Such systems will be used in the SDI context only within special circumstances. 5.3.1.3Thick Client Web Maps Since the comfort of thin client web maps is undesirable, developers created new interfaces which allow more comfortable usability. Typically these clients request either vector data from the server and interpret it client side or raster tiles (e. g. images with 256 * 256 pixels, mostly fractions of 1024). On zoom events these data are recalculated in a first step (even if the pixels get huge) and reloaded in a second step. In pan events the vectors or rasters are moved and the missing parts requested in another step. This technology ensures that maps can be displayed quickly as well as more comfortably than with simple one image applications. Since the scripting technology of browsers in the mid 1990s was in its infancy, first attempts of creating better interfaces were setup upon browser add-ons or http using standalone applications. Later on scripting languages especially JavaScript were impressively extended and so newer interfaces use this technology. Specific technologies of that type are:
  • 28. D 2.2 Analysis of Innovative Challenges 28/226 5.3.1.4Standalone Web Map Applications Since browsers bring a lot of functionality which is not needed for geographical applications, it may be a good concept to provide special web map client applications. On the other hand restrictions caused by applets and all applications capable of residing within browsers made it reasonable to create standalone applications. The standalone applications also allowed re-use of code for the creation of simple clients based on their mainstream commercial products. In the time being new standalone applications were developed for mobile devices as these give the possibility to override restrictions of mobile browsers. 5.3.1.5GIS with ability to use online data Beside other standalone applications some GIS (and even CAD) systems are enabled also to use web maps in the meantime. 5.3.1.6Browser Extensions Typically geographic applications used the following way to extend the browser‘s possibilities. A huge common disadvantage of nearly all these technologies is that the user has to install something, which is problematic especially in company networks with restricted rights. Some of these extensions only work as an extended user interface to load images more comfortable, others bring real vector data to the user and interpret it there. Nevertheless also public viewable maps were published with such systems in former days. Proprietary ActiveX This technology had a very comfortable download but was limited to Microsoft Internet Explorer and therefore lost importance by the time. Some applications which used that way of extension are: Java Applets Java applets are very comfortable because the user does not have to download anything. But on the other hand in times of (respectively on systems with) small bandwidth it needs a long time to start the application. In some cases, developers also created installable applets, whereby one disadvantage was solved by getting another one. Another disadvantage was the poor graphical interface of early Java applets. Some applicationsthat used this approach are: Netscape PlugIns/Firefox AddOns Whereas the fist PlugIns for Netscape were used for overriding built-in technical restrictions of the early versions, in the time being, modern extensions for Firefox are offered mainly to improve the usability. Flash, Silverlight and OpenLazlo Applications To avoid downloading of proprietary extensions some developers used the widely installed Flash PlugIn (or its uncommon used counterparts Silverlight and OpenLazlo) which are nowadays often installed with one‘s browser standard installation. Since
  • 29. D 2.2 Analysis of Innovative Challenges 29/226 Flash applications with many elements have a poor performance and the server side development is not quite easy, this technology was used only rarely and for smaller projects in a geographical context. SVG Applications While SVG (Scalable Vector Graphics) is a W3C standard since 2001 some developers tried to use it for geographic applications too. But SVG never became really accepted. On one hand it is implemented in Firefox natively, but with poor functionality for zooming and panning, on the other hand Microsoft invented its own standard (ovl?) and a SVG-PlugIn was needed. At last Adobe ended the support of its market leading PlugIn. In the meantime most of the features of SVG are also possible with HTML and JavaScript directly. A huge advantage of SVG is the full implementation of the DOM (document object model). 5.3.1.7Web-based 3D graphics X3D (Extensible 3D) is an open standard XML-based language successor to the popular VRML (Virtual Reality Modelling Language) the original ISO standard for web-based 3D graphics (ISO/IEC 14772). In particular, the XML encoding enables 3D to be incorporated into web services architectures and distributed environments allowing 3D data moving between applications. X3D has been officially incorporated within MPEG-4 multimedia standard and it is compatible with SVG. X3D has a rich set of features to support applications such as engineering and scientific visualisation, multimedia presentations, entertainment and educational titles, web pages, and shared virtual worlds. In particular X3D feature set includes:  3D graphics: Polygonal geometry, parametric geometry, hierarchical transformations, lighting, materials and multi-pass/multi-stage texture mapping  2D graphics: Text, 2D vector and planar shapes displayed within the 3D transformation hierarchy  Animation: Timers and interpolators to drive continuous animations  Spatial audio and video: Audiovisual sources mapped onto geometry in the scene  User interaction: Mouse-based picking and dragging; keyboard input  Navigation: Cameras; user movement within the 3D scene; collision, proximity and visibility detection  User-defined objects: Ability to extend built-in browser functionality by creating user-defined data types  Scripting: Ability to dynamically change the scene via programming and scripting languages
  • 30. D 2.2 Analysis of Innovative Challenges 30/226  Networking: Ability to compose a single X3D scene out of assets located on a network; hyperlinking of objects to other scenes or assets located on the World Wide Web  Physical simulation: Humanoid animation; geospatial datasets; integration with Distributed Interactive Simulation (DIS) protocols 5.3.1.8Web Browser with scripting extensions With the further development of browsers and the extended scripting languages, application developers were enabled to construct user interfaces directly within the browser using that scripting technologies and avoiding extensions, which have to be installed. Some of them – like OpenLayers – are even enabled to interpret vector layers directly. Others – like Mapbender which also includes a backend application– have a rich interface which reminds of desktop mapping applications. There is no need to install any additional software on the client‘s (i. e. the user‘s) PC. The scripts are embedded in the HTML pages or separate files and loaded on demand without user interaction. 5.3.2 Serverside 5.3.2.1Application server There is a certain number of powerful web mapping clients available; they are predominantly open source software and they all work through the user‘s web browser. Although called client, the web mapping client software is installed on a server and loaded to the client. Whereas server modules which deliver maps to clients, derive from a handful products on market, surrounding applications are often individually programmed. Most of these applications are written in PHP, sometimes also in Python, Perl or Java. Beside that, there are some products on the market which even include a backend for special purposes, e. g. Mapbender. While most of the application servers allow only the interpretation of zoom and pan requests or even feature information requests, some applications are able to react to further GIS functions starting with drawing requests and lasting to real GIS functions like polygon overlays. 5.3.2.2Tile server and ―cookie cutter‖ While the first products on market mainly served tiles or created them out of huge bitmaps on the fly, this rather simple solution is still used for mass user applications. 5.3.2.3File interpreting The first more sophisticated attempt used vector files (mainly ESRI shape files) and created bitmaps on the fly. Really early applications even used desktop applications running on the server and sent screenshots to the user.
  • 31. D 2.2 Analysis of Innovative Challenges 31/226 First products in the market like the mapserver of the university of Minnesota or ArcIMS used their proprietary set of request parameters nowadays most services work OGC compliant so that client applications have no need to know the server side product in detail. 5.3.2.4Mapserver with database backend With the upcoming geodatabases products were enabled to interpret data from these databases directly. In the time being these products were also enhanced to produce maps upon requirements with user driven design. 5.3.2.5Mapserver with more intelligent functions Driven by the Open Source Community with the latest products it is also possible to use some GIS functions like manipulating data or retrieving data to use it with intelligent clients so that mapservers act like a middle tier to the geodatabase. 5.3.2.6Middleware Middleware products with special geographic functions may be for example servers which request data or images from another map server and reproject these on the fly to send it to clients. 5.3.2.7Geodatabases Geodatabases are commonly SQL extensions which allow the request of geographical data from SQL databases based on geographical items. Some of them are also able to achieve GIS functions. In early days of development some of them used also proprietary protocols. 5.4 Classification by Service 5.4.1 State of the art State of the art is on the one side defined by technology development, which is cur- rently mainly predicted by service oriented architecture and currently also Web 2.0 development. On the other side current state of the art is defined by European legis- lation given by the INSPIRE directive. Parallel to the INSPIRE initiative the initiatives GMES and GEOSS could be mentioned and word wide also the UNSDI initiative. 5.4.1.1Proprietary mapping services First products on market used their own proprietary request protocols which are even in use nowadays by many map distributors. Most mapping clients are able to request maps from the most established mapservers in their specific proprietary protocol. 5.4.1.2Direct SQL Requests to Geodatabases Geodatabases usually can be requested following the Simple Feature Specification for SQL defined by the Open GIS Consortium (OGC).
  • 32. D 2.2 Analysis of Innovative Challenges 32/226 5.5 Products 5.5.1 Template with answering suggestions Plan4all Product/Service description #... Productname/Version Full name (short name, actual/last Version) Manufacturer Developed from/to Contact Name (email) Short Description Type  commercial  OpenSource  Standard (OGC, W3C, …)  Commercial, but free of cost (for …) Approach  Graphic Display  Web Mapping  Web Mapping (Globe)  Web Cartography  Web GIS  Geodatabase  Location-based services  Routing Interactivity  Only Viewing  Semi interactive  Fully interactive Technology Server side  Application Server  Tile Server/…  File Interpreting  Database Access  WebGIS functions Client side  standalone  ActiveX  PlugIn/AddOn  Applet  Scripts  HTML only Used Services/ Protocols  proprietary  WMS (OGC conform)  WFS (OGC conform)  WFS-T (OGC conform)  WCS (OGC conform)  SLD/… (OGC conform)  Simple Feature Specification for SQL (OGC)  GeoRSS  KML  GML  SVG  Others (specify …) Operating System Server side Client side Webtechnology Webserver Browsers Projections Which Where  Server side  Client side
  • 33. D 2.2 Analysis of Innovative Challenges 33/226 Metadata management Known usage in planning Challenges Collected by Additions by Remarks Manufacturers remarks 5.6 Selected Product overview This table provides classification of selected products, which was recognised as most relevant for Plan4all pilot implementations. The full list of products and detailed information about all software is provided in Annex A. Products Classification Comments Type Manufacturer Product Plan4all classification Standards CommercialSofteware AbacoGroup DbMap2D View Downloading Transformation Digitalisation Data collection Digital cartography Data analysis Routing WMS (OGC conform) Simple Feature Specification for SQL (OGC) GeoRSS KML Autodesk Inc. Autodesk Map Digitalisation Data collection Data analysis Design and planning activity WMS? Autodesk MapGuide View WMS?, WFS? Until 2005; Client-Server- Application; still in use; Bentley Systems Bentley Cadastre Design and planning activity KML Bentley Map Digitalisation Data collection Design and planning activity KML WMS GeoWebPublisher View Downloading WMS ** MicroStation Digitalisation Data collection Design and planning activity KML WMS proprietary projections Conterra terraCatalog Discovery CSW ISO19115/19119) Connectivity to ArcGIS
  • 34. D 2.2 Analysis of Innovative Challenges 34/226 Products Classification Comments Type Manufacturer Product Plan4all classification Standards ERDAS Apollo Image Manager Discovery View Downloading Digital cartography Data analysis WSDL/SOAP/UDD I, WRS 0.0.2 WMS-WSDL, WMS POS, WMS, WMC, WCS-WSDL, WCS, URN, SOAP, SLD, OWS common, Filter, CAT2 AP, ebRIM, CAT CS/W Metadata ISO 19115/ 19119/ 19139 Included Metadata- Management Apollo Server Discovery View Downloading Digital cartography Data analysis WSDL/SOAP/UDD I, WRS 0.0.2 WMS-WSDL, WMS POS, WMS, WMC, WCS-WSDL, WCS, URN, SOAP, SLD, OWS common, Filter, CAT2 AP, ebRIM, CAT CS/W Metadata ISO 19115/ 19119/ 19139 ERDAS Catalog Discovery View Downloading Digital cartography Data analysis Routing WSDL/SOAP/UDD I, WRS 0.0.2 WMS-WSDL, WMS POS, WMS, WMC, WCS-WSDL, WCS, URN, SOAP, SLD, OWS common, Filter, CAT2 AP, ebRIM, CAT CS/W Metadata ISO 19115/ 19119/ 19139 ESRI ArcCatalog Discovery 19115/19119/1913 9, CSW? Meta Data Editor ArcGIS Explorer View WMS Free of cost ArcIMS / ArcGIS Server View Downloading Digital cartography Data analysis WMS, WFS Various Applications
  • 35. D 2.2 Analysis of Innovative Challenges 35/226 Products Classification Comments Type Manufacturer Product Plan4all classification Standards ArcSDE (Spatial Data Engine) View Downloading Digital cartography Data analysis WMS, WFS HSRS Micka Discovery CSW, ISO 19115/ 19119/ 19139 URM Geoportal Discovery View Downloading Transformation Digitalisation Data collection Digital cartography Data analysis WMS, WFS, WCS, WPS, CSW, ISO 19115/ 19119/ 19139 Intergraph GeoMedia WebMap View Downloading Transformation Digitalisation Data collection Digital cartography Data analysis WMS, WFS, WFS- T, GM, SVG, CSW MapInfo Mapinfo Professional Digitalisation Data collection Digital cartography Data analysis WMS, WFS, WFS-T, KML MapXtreme View Routing WMS, GML Oracle Oracle Spatial & Locator View Routing WMS, LBS Topol s.r.o Topol xT 9.0 View Transformation Digitalisation Data collection Digital cartography Data analysis WMS Topol xT Internet server View Transformation WMS, WPS OpenSourceSoftwareorfreeware Advanced Informa- tion Systems Group of the Uni- versity of Zaragoza and GeoSpatium- Lab CATMDEdit Discovery ISO 19115/ 19119/ 19139 Camptocamp SA CartoWeb View Routing WMS, WFS Cenia Janitor View Digitalisation Data collection Digital cartography Data analysis WMS, CSW DM Solutions Group Chameleon View WMS, WMC Ka-map View WMS, WFS
  • 36. D 2.2 Analysis of Innovative Challenges 36/226 Products Classification Comments Type Manufacturer Product Plan4all classification Standards Fraunhofer Institu- te for Computer Graphics Research (IGD) HALE – HUMBOLDT Alignment Editor Transformation GML, WFS Gigateway - AGI MetaGenie Discovery ISO 19115/ 19119/ 19139 Help Forest, Wirelessinfo DataMan Downloading Discovery ISO 19115/ 19119/ 19139, GML Help Forest, Wirelessinfo HSRS MapMan View Discovery Digital cartography WMS, WFS, ISO 19115/ 19119/ 19139, GML Teredit System View Discovery Digitalisation Data collection WMS, WFS, WCS, CSW Gemet Client thesaurus SOAP ** HSRS IDEC Spain HSLayers View WMS, WFS OpenLayers based PyWPS Transformation WPS MetaD Discovery ISO 19115/ 19119/ 19139 Immanuel Scholz, Dirk Stöcker JOSM Digital cartography No standard? Intelec Geomatique M³CAT Discovery ISO 19115/ 19119/ 19139 MetaDataEditor** Intevation GmbH and TechniData AG Thuban View Digitalisation Data collection Digital cartography Data analysis WMS SWG IVER Technologias gvSIG View Digitalisation Data collection Digital cartography Data analysis WMS, WFS WCS SLD/… GeoRSS, KML GML SVG lat/lon degree View Digitalisation Data collection Digital cartography Data analysis WMS, WFS,WFS- T, WCS, pre-stan- dards of Sensor Observation Servi- ce (SOS), Web Terrain Service/ Web Perspective and View Service, (WTS/ WPVS), WPS, SLD, SFS for SQL, KML, GML (3.1 with a complex Feature Model and 3D- geometries), SVG
  • 37. D 2.2 Analysis of Innovative Challenges 37/226 Products Classification Comments Type Manufacturer Product Plan4all classification Standards Ministerio de Fo- mento, Admon Públicas, Industria y Turismo, Econo- mía y Hacienda GeoPista Municipality GIS WMS, WFS, SLD/… ,GML, SVG OSGeo Foundation GDAL/OGR Transformation WMSTS? Additional commandline tools GeoNetwork Discovery CSW Inkl. Meta Data Editor Grass Gis Analysis Digitalisation SWG ? MapBender View WMS, WFS, WFS, SLD/… MapServer View WMS, WFS client/server, WMC, WCS, Filter Encoding SLD, GML, SOS, OM, SFS for SQL, GeoRSS, KML, SVG May be combined with other client soft- ware; former: Map-Server Foundation, former: Universi- ty of Minnesota OpenLayers View WMS, WFS Client side projections PortalU InGrid Editor View Discovery ISO 19115 / ISO 19119, OGC-CSW-2-0, WMS Meta Data Editor** QGIS Project Steering Comitee QGIS (QuantumGIS) View Digitalisation Data collection Digital cartography Data analysis WMS, WFS, SFS for SQL, GML Refractions Inc. GeoServer View Downloading WMS, WFS, WFS- T, WCS PostGIS Geodatabase, WMS, WFS, WFS- T, WCS, GML, WKT, SVG, SFS for SQL uDig View Digitalisation Data collection Digital cartography Data analysis WMS, WFS, SLD/…, GeoRSS, KML, GML, SVG SAIG KOSMO GIS View Digitalisation Data collection Digital cartography Data analysis WMS, WFS, SLD/…, GML, SVG T-Systems España, SAU MonoGIS View Digital Cartography Routing GML
  • 38. D 2.2 Analysis of Innovative Challenges 38/226 Products Classification Comments Type Manufacturer Product Plan4all classification Standards Vivid Solutions JUMP View Digitalisation Data collection Digital cartography Data analysis WMS, SLD/…, GML, SVG
  • 39. D 2.2 Analysis of Innovative Challenges 39/226 6 Chances, potentials, risks of data infrastructure applications Based on the framework of technologies and services we give a theoretic view on their chances, potentials and risks concerning data storage, data display, legislation, insufficient data use, derived datasets and the quality of metadata. 6.1 Data Storage 6.1.1 Any time access and combined access Any time and any where access is one of the main advantages of online data infrastructures. The user is not dependent on certain office hours nor does he or she have to collect datasets on offline devices to have an every time access. The problem of having offline datasets which are out of date because an update has been missed does not exist in this case because there is always access to the latest version of all data. Any time and any where access does not necessarily mean that the datasets are shared via internet or similar, potentially insecure channels. A connection can also be made through a secured or private network and can even be encrypted so that only privileged users can access the data. Therefore, confidential datasets can be accessed this way, too. Combined access means that datasets from different sources can be accessed in the same way because everything is part of the spatial data infrastructure (SDI).This is a huge advantage opposite to datasets which are kept without an SDI (see also ―incorrect data use‖ and the figure below). Since this ambition may be overruled by browser security features, using more than one source with browser extensions may work only via reverse proxy servers or middleware. 6.1.2 Redundancy A huge problem of distributed data management is redundancy. This term refers to double storage of identical datasets as well as multiple storage of similar datasets due to erroneous or negligent survey or a lack of coordination. There may be several reasons for redundancy:  quicker access: If all relevant datasets are stored at the same place, disregarding the fact that they are also available elsewhere, the user does not have to think of different sources but can always rely on the same data source.  independency: One data store is not dependent on another data store if it keeps all relevant datasets in its own place.  ignorance: The datasets are kept in multiple places because one data manager simply does not know that another data manager maintains the same datasets. This is a common effect in tangled and outdated infrastructure networks of big administrational clusters. Technical ignorance may also be a
  • 40. D 2.2 Analysis of Innovative Challenges 40/226 consequence of legal ignorance, which is often followed by redundant datasets. Apart from safety issues which see redundancy as a matter of purpose for security reasons (backup), classic redundancy often leads to problems: More than one instance of a dataset is available, and each claims to be the latest – but the user does not really know which one is the one he or she should choose to work with. Central data storage or an up-to-date data infrastructure network helps to solve redundancy problems which are not only a matter of work efficiency but also a matter of wasted disk space.
  • 41. D 2.2 Analysis of Innovative Challenges 41/226 6.2 Data Display 6.2.1 Generalisation Cartographic generalisation is the process of selecting and representing information of a map in a way that adapts to the scale of the display medium of the map. Printed maps are always provided in fixed scales whereas digital maps are scalable. This can lead to presentation problems because geodata are always stored in a resolution which is proper for a certain scale range. Zooming out of this range may result in inaccurate, wrong, or at least strange data display. An alternative could be to store geodata only at their best available resolution and apply automatic generalisation dependent on the requested map scale. However, generalisation is a balancing process. Automatic generalisation still leads to problems as different researchers invented conceptual models for automated generalisation, but still there is no clear classification of operators available, It is doubtful if a comprehensive classification will evolve in future. This leads directly to the next point: Fig. 2: Problems of GIS applications in huge (administrational) network structures Problems of GIS applications in huge (administrational) network structures VVaarriieettyy ooff iinnffoorrmmaattiioonn aanndd ddaattaa DDaattaa aanndd iinnffoorrmmaattiioonn aacccceessss AApppplliiccaattiioonn   uusseerr Big, heterogeneous data amount  official statistics  transportation, distance  biota, protection areas  imagery, base maps  land use data  … Cooperation, joint solution  identical data for identical problems in all divisions  data interpretation  overall goals Application needs  simple handling  hardly used  daily used  user-oriented access  space for derived datasets