Mercer county real estate market update jan 18 2011
•Transferir como PPT, PDF•
0 gostou•277 visualizações

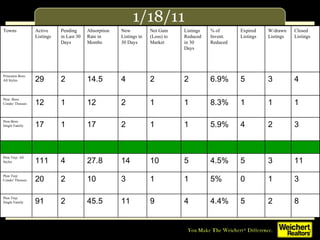
The following stats on West Windsor, Lawrence, East Windsor, Ewing, Hopewell, Cranbury, Plainsboro, South Brunswick, Montgomery, Hamilton, Franklin, Princeton Township, Princeton Boro, Robbinsville, Hightstown, Penningtion, and Monroe are provided: Active Listings NJ Pending in Last 30 Days Absorption Rate New Listings Net Gain (Loss) to Market Listings Reduced in 30 Days % of Inventory Reduced Expired Listings Withdrawn Listings Closed Listings Contact me at http://paulcamuto.com for more information.

Recomendados
Mais conteúdo relacionado
Mais de Weichert Real Estate Agent
Mais de Weichert Real Estate Agent (20)
Último
Último (20)
Mercer county real estate market update jan 18 2011
- 1. 1/18/11 Towns Active Listings Pending in Last 30 Days Absorption Rate in Months New Listings in 30 Days Net Gain (Loss) to Market Listings Reduced in 30 Days % of Invent. Reduced Expired Listings W/drawn Listings Closed Listings Princeton Boro: All Styles 29 2 14.5 4 2 2 6.9% 5 3 4 Pton -Boro Condo/ Thouses 12 1 12 2 1 1 8.3% 1 1 1 Pton-Boro Single Family 17 1 17 2 1 1 5.9% 4 2 3 Pton Twp: All Styles 111 4 27.8 14 10 5 4.5% 5 3 11 Pton Twp: Condo/ Thouses 20 2 10 3 1 1 5% 0 1 3 Pton Twp: Single Family 91 2 45.5 11 9 4 4.4% 5 2 8
- 2. 1/18/11 Towns Active Listings Pending in Last 30 Days Absorption Rate in Months New Listings in 30 Days Net Gain (Loss) to Market Li1stings Reduced in 30 Days % of Invent. Reduced Expired Listings W/drawn Listings Closed Listings West Windsor: All Styles 72 6 12 10 4 12 16.7% 9 9 1` West Windsor Condo/ T.Houses 19 3 6.3 5 2 3 15.8% 3 0 1 West Windsor 55+ 3 0 99 1 1 -- -- 0 1 4 West Windsor Single Family 50 3 16.7 4 1 9 18% 6 8 15 Lawrence: All Styles 186 4 46.5 31 27 28 15.1% 12 5 18 Lawrence: Condo/ THouses 66 1 66 12 11 10 15.2% 5 2 5 Lawrence: 55+ 11 0 99 1 1 -- -- 2 0 1 Lawrence: Single Family 109 3 36.3 18 15 18 16.5% 5 3 12
- 3. 1/18/11 Towns Active Listings Pending in Last 30 Days Absorption Rate in Months New Listings in 30 Days Net Gain (Loss) to Market Listings Reduced in 30 Days % of Invent. Reduced Expired Listings W/drawn Listings Closed Listings PlainsboroAll Styles 50 3 16.7 14 11 7 14% 10 0 5 Plainsboro Condo/ THouses 28 2 14 10 8 2 7% 6 0 3 Plainsboro 55+ 7 0 7 1 1 0 0 2 0 1 Plainsboro Single Family 15 1 15 3 2 5 33% 2 0 1 Cranbury: All Styles 23 1 23 1 0 3 13% 2 0 1 Cranbury: 55+ 1 0 99 1 1 0 0 1 0 0 Cranbury: Single Family 22 1 22 0 -1 3 13% 1 0 1
- 4. 1/18/11 Towns Active Listings Pending in Last 30 Days Absorption Rate in Months New Listings in 30 Days Net Gain (Loss) to Market Listings Reduced in 30 Days % of Invent. Reduced Expired Listings W/drawn Listings Closed Listings Ewing: All Styles 244 4 61 26 22 37 15.2% 26 7 10 Ewing : Condo/ T.Houses 37 2 18.5 5 3 5 13.5% 3 0 0 Ewing 55+: 8 0 99 0 0 -- -- 0 0 0 Ewing: Single Family 199 2 99.5 21 19 32 16.1% 23 7 10 East Windsor: All Styles 189 3 63 16 13 37 19.6% 25 3 2 East Windsor: Condo/ THouses 125 2 62.5 10 8 29 23.2% 17 3 1 East Windsor: 55+ 12 0 99 0 0 -- -- 6 0 0 East Windsor: Single Family 52 1 52 6 5 8 15.4% 2 0 1
- 5. 1/18/11 Towns Active Listings Pending in Last 30 Days Absorption Rate in Months New Listings in 30 Days Net Gain (Loss) to Market Listings Reduced in 30 Days % of Invent. Reduced Expired Listings W/drawn Listings Closed Listings Hopewell Twp. All Styles 126 8 15.75 10 2 20 16% 11 4 10 Hopewell Twp. Condo/ T.Houses 8 3 3 1 -2 3 37.5% 1 0 4 Hopewell Twp.: 55+ 9 0 9 1 1 -- -- 0 0 0 Hopewell Twp Single Family 109 5 22 8 3 17 15.5% 10 4 6 Hamilton: All Styles 549 25 22 86 61 99 14% 55 16 43 Hamilton: Condo/ THouses 100 5 20 17 12 21 21% 9 3 4 Hamilton: 55+ 32 1 32 3 2 -- -- 3 0 3 Hamilton: Single Family 417 19 23 66 47 78 19% 43 13 36
- 6. 1/18/11 Towns Active Listings Pending in Last 30 Days Absorption Rate in Months New Listings in 30 Days Net Gain (Loss) to Market Listings Reduced in 30 Days % of Invent. Reduced Expired Listings W/drawn Listings Closed Listings Robbinsville All Styles 133 12 11 18 6 26 20% 12 4 12 Robbinsville Condo/ T.Houses 60 4 15 10 6 10 17% 7 2 4 Single Family 73 8 9 8 0 16 22% 5 2 8 Hightstown Boro: All Styles 52 0 99 6 6 8 15% 7 1 0 Pennington 9 3 3 0 (3) 0 0 2 1 3 Hopewell Boro 13 2 6.5 0 (2) 3 23% 0 1 3
- 7. 1/18/11 Towns Active Listings Pending in Last 30 Days Absorption Rate in Months New Listings in 30 Days Net Gain (Loss) to Market Listings Reduced in 30 Days % of Invent. Reduced Expired Listings W/drawn Listings Closed Listings South Brunswick All Styles South BrunswickCondo/ T.Houses South Brunswick 55+ South Brunswick Single Family Monroe: All Styles Monroe: 55+ Monroe: Single Family
- 8. 1/18/11 Towns Active Listings Pending in Last 30 Days Absorption Rate in Months New Listings in 30 Days Net Gain (Loss) to Market Listings Reduced in 30 Days % of Invent. Reduced Expired Listings W/drawn Listings Closed Listings Montgomery All Styles 107 12 8.9 11 -1 14 13% 15 6 15 Montgomery Condo/Twnhms 24 3 8 3 0 7 29% 2 2 5 Single Family 83 9 9.2 8 -1 7 8% 13 4 10 Hillsborough All Styles 247 26 9.5 42 +16 28 11% 34 13 16 Hillsborough Condo/Twnhms 84 12 7 17 +5 14 16% 13 6 5 Hillsborough Single Family 163 14 11.6 25 +11 14 8% 21 7 11
Notas do Editor
- Populate this table to show the local absorption rate in the various price ranges that are appropriate for your market area. Please add or delete rows as necessary to adequately reflect local conditions.
- Populate this table to show the local absorption rate in the various price ranges that are appropriate for your market area. Please add or delete rows as necessary to adequately reflect local conditions.
- Populate this table to show the local absorption rate in the various price ranges that are appropriate for your market area. Please add or delete rows as necessary to adequately reflect local conditions.
- Populate this table to show the local absorption rate in the various price ranges that are appropriate for your market area. Please add or delete rows as necessary to adequately reflect local conditions.
- Populate this table to show the local absorption rate in the various price ranges that are appropriate for your market area. Please add or delete rows as necessary to adequately reflect local conditions.
- Populate this table to show the local absorption rate in the various price ranges that are appropriate for your market area. Please add or delete rows as necessary to adequately reflect local conditions.
- Populate this table to show the local absorption rate in the various price ranges that are appropriate for your market area. Please add or delete rows as necessary to adequately reflect local conditions.
- Populate this table to show the local absorption rate in the various price ranges that are appropriate for your market area. Please add or delete rows as necessary to adequately reflect local conditions.