How to calculate P/E, PEG ratio
•
2 gostaram•892 visualizações

How to calculate P/E, PEG ratio

Recomendados
Recomendados
Mais conteúdo relacionado
Semelhante a How to calculate P/E, PEG ratio
Semelhante a How to calculate P/E, PEG ratio (6)
Mais de Tony Auditor
Mais de Tony Auditor (20)
Último
Último (20)
How to calculate P/E, PEG ratio
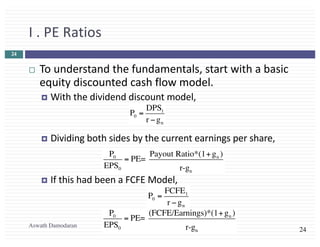
- 1. 24 I . PE Ratios ¨ To understand the fundamentals, start with a basic equity discounted cash flow model. ¤ With the dividend discount model, ¤ Dividing both sides by the current earnings per share, ¤ If this had been a FCFE Model, P0 = DPS1 r −gn P0 EPS0 = PE= Payout Ratio*(1+gn ) r-gn P0 = FCFE1 r −gn P0 EPS0 = PE= (FCFE/Earnings)*(1+gn ) r-gn Aswath Damodaran 24
- 2. 25 Using the Fundamental Model to Estimate PE For a High Growth Firm ¨ The price-earnings ratio for a high growth firm can also be related to fundamentals. In the special case of the two-stage dividend discount model, this relationship can be made explicit fairly simply: ¤ For a firm that does not pay what it can afford to in dividends, substitute FCFE/Earnings for the payout ratio. ¨ Dividing both sides by the earnings per share: P0 = EPS0*Payout Ratio*(1+g)* 1− (1+g)n (1+r)n " # $ % & ' r-g + EPS0*Payout Ration*(1+g)n *(1+gn ) (r-gn )(1+r)n P0 EPS0 = Payout Ratio * (1 + g) * 1 − (1 + g)n (1+ r)n " # $ % & ' r - g + Payout Ratio n *(1+ g)n * (1 + gn ) (r - gn )(1+ r)n Aswath Damodaran 25
- 3. 26 A Simple Example ¨ Assume that you have been asked to estimate the PE ratio for a firm which has the following characteristics: Variable High Growth Phase Stable Growth Phase Expected Growth Rate 25% 8% Payout Ratio 20% 50% Beta 1.00 1.00 Number of years 5 years Forever after year 5 Riskfree rate = T.Bond Rate = 6% Required rate of return = 6% + 1(5.5%)= 11.5% Aswath Damodaran 26 P0 EPS0 = .20*(1.25)* 1− (1.25)5 (1.115)5 " # $ % & ' .115-.25 + .50*(1.25)5 *(1.08) (.115-.08)(1.115)5 = 28.75
- 4. 27 a. PE and Growth: Firm grows at x% for 5 years, 8% thereafter PE Ratios and Expected Growth: Interest Rate Scenarios 0 20 40 60 80 100 120 140 160 180 5% 10% 15% 20% 25% 30% 35% 40% 45% 50% Expected Growth Rate PERatio r=4% r=6% r=8% r=10% Aswath Damodaran 27
- 5. 28 b. PE and Risk: A Follow up Example PE Ratios and Beta: Growth Scenarios 0 5 10 15 20 25 30 35 40 45 50 0.75 1.00 1.25 1.50 1.75 2.00 Beta PERatio g=25% g=20% g=15% g=8% Aswath Damodaran 28
- 6. 29 Example 1: Comparing PE ratios across Emerging Markets- March 2014 (pre- Ukraine) Aswath Damodaran 29 Russia looks really cheap, right?
- 7. 30 Example 2: An Old Example with Emerging Markets: June 2000 Country PE Ratio Interest Rates GDP Real Growth Country Risk Argentina 14 18.00% 2.50% 45 Brazil 21 14.00% 4.80% 35 Chile 25 9.50% 5.50% 15 Hong Kong 20 8.00% 6.00% 15 India 17 11.48% 4.20% 25 Indonesia 15 21.00% 4.00% 50 Malaysia 14 5.67% 3.00% 40 Mexico 19 11.50% 5.50% 30 Pakistan 14 19.00% 3.00% 45 Peru 15 18.00% 4.90% 50 Phillipines 15 17.00% 3.80% 45 Singapore 24 6.50% 5.20% 5 South Korea 21 10.00% 4.80% 25 Thailand 21 12.75% 5.50% 25 Turkey 12 25.00% 2.00% 35 Venezuela 20 15.00% 3.50% 45 Aswath Damodaran 30
- 8. 31 Regression Results ¨ The regression of PE ratios on these variables provides the following – PE = 16.16 - 7.94 Interest Rates + 154.40 Growth in GDP - 0.1116 Country Risk R Squared = 73% Aswath Damodaran 31
- 9. 32 Predicted PE Ratios Country PE Ratio Interest Rates GDP Real Growth Country Risk Predicted PE Argentina 14 18.00% 2.50% 45 13.57 Brazil 21 14.00% 4.80% 35 18.55 Chile 25 9.50% 5.50% 15 22.22 Hong Kong 20 8.00% 6.00% 15 23.11 India 17 11.48% 4.20% 25 18.94 Indonesia 15 21.00% 4.00% 50 15.09 Malaysia 14 5.67% 3.00% 40 15.87 Mexico 19 11.50% 5.50% 30 20.39 Pakistan 14 19.00% 3.00% 45 14.26 Peru 15 18.00% 4.90% 50 16.71 Phillipines 15 17.00% 3.80% 45 15.65 Singapore 24 6.50% 5.20% 5 23.11 South Korea 21 10.00% 4.80% 25 19.98 Thailand 21 12.75% 5.50% 25 20.85 Turkey 12 25.00% 2.00% 35 13.35 Venezuela 20 15.00% 3.50% 45 15.35 Aswath Damodaran 32
- 10. 33 Example 3: PE ratios for the S&P 500 over time Aswath Damodaran 33 0.00 5.00 10.00 15.00 20.00 25.00 30.00 35.00 40.00 45.00 50.00 1969 1970 1971 1972 1973 1974 1975 1976 1977 1978 1979 1980 1981 1982 1983 1984 1985 1986 1987 1988 1989 1990 1991 1992 1993 1994 1995 1996 1997 1998 1999 2000 2001 2002 2003 2004 2005 2006 2007 2008 2009 2010 2011 2012 2013 2014 2015 PE Ratios for the S&P 500: 1969-2015 PE Normalized PE CAPE PE Normalized PE CAPE 1969-2015 16.06 20.70 17.08 1986-2015 18.52 24.00 20.34 1996-2015 19.61 25.61 22.29 2006-2015 16.90 20.88 18.45
- 11. 34 Is low (high) PE cheap (expensive)? ¨ A market strategist argues that stocks are expensive because the PE ratio today is high relative to the average PE ratio across time. Do you agree? a. Yes b. No ¨ If you do not agree, what factors might explain the higher PE ratio today? ¨ Would you respond differently if the market strategist has a Nobel Prize in Economics? Aswath Damodaran 34
- 12. 35 E/P Ratios , T.Bond Rates and Term Structure Aswath Damodaran 35 -2.00% 0.00% 2.00% 4.00% 6.00% 8.00% 10.00% 12.00% 14.00% 16.00% 1960 1962 1964 1966 1968 1970 1972 1974 1976 1978 1980 1982 1984 1986 1988 1990 1992 1994 1996 1998 2000 2002 2004 2006 2008 2010 2012 2014 Earnings to Price versus Interest Rates: S&P 500 Earnings Yield T.Bond Rate Bond-Bill
- 13. 36 Regression Results ¨ There is a strong positive relationship between E/P ratios and T.Bond rates, as evidenced by the correlation of 0.66 between the two variables., ¨ In addition, there is evidence that the term structure also affects the PE ratio. ¨ In the following regression, using 1960-2014 data, we regress E/P ratios against the level of T.Bond rates and a term structure variable (T.Bond - T.Bill rate) E/P = 3.51% + 0.5598 T.Bond Rate – 0.1374 (T.Bond Rate-T.Bill Rate) (4.93) (6.23) (-0.65) R squared = 41.28% ¨ Going back to 2008, this is what the regression looked like: E/P = 2.56% + 0.7044 T.Bond Rate – 0.3289 (T.Bond Rate-T.Bill Rate) (4.71) (7.10) (1.46) R squared = 50.71% The R-squared has dropped and the T.Bond rate and the differential with the T.Bill rate have noth lost significance. How would you read this result? Aswath Damodaran 36
- 14. 37 II. PEG Ratio ¨ PEG Ratio = PE ratio/ Expected Growth Rate in EPS ¤ For consistency, you should make sure that your earnings growth reflects the EPS that you use in your PE ratio computation. ¤ The growth rates should preferably be over the same time period. ¨ To understand the fundamentals that determine PEG ratios, let us return again to a 2-stage equity discounted cash flow model: ¨ Dividing both sides of the equation by the earnings gives us the equation for the PE ratio. Dividing it again by the expected growth ‘g: P0 = EPS0*Payout Ratio*(1+g)* 1− (1+g)n (1+r)n " # $ % & ' r-g + EPS0*Payout Ration*(1+g)n *(1+gn ) (r-gn )(1+r)n PEG= Payout Ratio*(1+g)* 1− (1+g)n (1+r)n " # $ % & ' g(r-g) + Payout Ration*(1+g)n *(1+gn ) g(r-gn )(1+r)n Aswath Damodaran 37
- 15. 38 PEG Ratios and Fundamentals ¨ Risk and payout, which affect PE ratios, continue to affect PEG ratios as well. ¤ Implication: When comparing PEG ratios across companies, we are making implicit or explicit assumptions about these variables. ¨ Dividing PE by expected growth does not neutralize the effects of expected growth, since the relationship between growth and value is not linear and fairly complex (even in a 2-stage model) Aswath Damodaran 38
- 16. 39 A Simple Example ¨ Assume that you have been asked to estimate the PEG ratio for a firm which has the following characteristics: Variable High Growth Phase Stable Growth Phase Expected Growth Rate 25% 8% Payout Ratio 20% 50% Beta 1.00 1.00 ¨ Riskfree rate = T.Bond Rate = 6% ¨ Required rate of return = 6% + 1(5.5%)= 11.5% ¨ The PEG ratio for this firm can be estimated as follows: PEG = 0.2 * (1.25) * 1− (1.25)5 (1.115)5 " # $ % & ' .25(.115 - .25) + 0.5 * (1.25)5 *(1.08) .25(.115-.08) (1.115)5 = 115 or 1.15 Aswath Damodaran 39
- 20. 43 PEG Ratios and Fundamentals: Propositions ¨ Proposition 1: High risk companies will trade at much lower PEG ratios than low risk companies with the same expected growth rate. ¤ Corollary 1: The company that looks most under valued on a PEG ratio basis in a sector may be the riskiest firm in the sector ¨ Proposition 2: Companies that can attain growth more efficiently by investing less in better return projects will have higher PEG ratios than companies that grow at the same rate less efficiently. ¤ Corollary 2: Companies that look cheap on a PEG ratio basis may be companies with high reinvestment rates and poor project returns. ¨ Proposition 3: Companies with very low or very high growth rates will tend to have higher PEG ratios than firms with average growth rates. This bias is worse for low growth stocks. ¤ Corollary 3: PEG ratios do not neutralize the growth effect. Aswath Damodaran 43