SlideShare uma empresa Scribd logo
1 de 9
Baixar para ler offline
Weekly Market
Activity Report
A RESEARCH TOOL FROM THE MINNEAPOLIS AREA ASSOCIATION OF REALTORS®
BROUGHT TO YOU BY THE UNIQUE DATA-SHARING TRADITIONS OF THE REALTOR® COMMUNITY


For Week Ending March 17, 2012                                                                                            Quick Facts
Publish Date: March 26, 2012 • All comparisons are to 2011

                                                                                                                                 - 1.3%                       + 23.1%                          - 27.5%
In another sign that the six-year long housing slump could be coming to an end, the
                                                                                                                                  Change in
                                                                                                                                       g                          Change in
                                                                                                                                                                      g                            Change in
                                                                                                                                                                                                        g
N ti
National A
         l Association of H
                i ti    f Home B ild /W ll F
                                 Builders/Wells Fargo HHousing M k t I d (HMI)
                                                             i Market Index
                                                                                                                                 New Listings                   Pending Sales                      Inventory
reached 28. To put that in perspective, it went from above 70 in 2005 to below 10 in
2009. The HMI has not seen 28 since June 2007. This and other landmark data points
are coalescing to signal calmer waters ahead. That's not to say you should expect
double-digit annualized appreciation, but both buyers and sellers are displaying the                                      Metrics by Week
sort of confidence that is fluttering through the rest of the economy.
                                                                                                                          New Listings                                                                         2
In the Twin Cities region, for the week ending March 17:                                                                  Pending Sales                                                                        3
• New Listings decreased 1.3% to 1,406                                                                                    Inventory of Homes for Sale                                                          4
• Pending Sales increased 23.1% to 1,029
• Inventory decreased 27.5% to 17,088                                                                                     Metrics by Month
                                                                                                                          Days on Market Until Sale                                                            5
For the month of February:
                                                                                                                          Median Sales Price                                                                   6
• Median Sales Price decreased 1.4% to $138,000                                                                           Percent of Original List Price Received                                              7
• Days on Market decreased 9.0% to 145
• Percent of Original List Price Received increased 2.5% to 90.6%                                                         Housing Affordability Index                                                          8
• Months Supply of Inventory decreased 35.2% to 4.7                                                                       Months Supply of Inventory                                                           9
                                                                                                                          Click on desired metric to jump to that page.


                                           All data from NorthstarMLS. Provided by the Minneapolis Area Association of REALTORS®. Powered by 10K Research and Marketing. | Sponsored by Royal Credit Union     www.rcu.org
New Listings
A count of the properties that have been newly listed on the market in a given week.


Last Three Months                                Current Activity              One Year Ago                                                                           For the                    Current       One Year
                                                                                                                                                                                                                                     +/–
                                                                                                                                                                      Week Ending                Activity      Previous
2,000
                                                                                                                                                                      12/24/2011                    600             660             - 9.1%
                                                                                                                                                                      12/31/2011                    598             671            - 10.9%
1,750
                                                                                                                                                                      1/7/2012                     1,273          1,484            - 14.2%
                                                                                                                                                                      1/14/2012                    1,219          1,283             - 5.0%
1,500
                                                                                                                                                                      1/21/2012                    1,096          1,190             - 7.9%
                                                                                                                                                                      1/28/2012                    1,091          1,322            - 17.5%
1,250                                                                                                                                                                 2/4/2012                     1,239          1,325             - 6.5%
                                                                                                                                                                      2/11/2012                    1,318          1,318              0.0%
1,000                                                                                                                                                                 2/18/2012                    1,258          1,353             - 7.0%
                                                                                                                                                                      2/25/2012                    1,253          1,237             + 1.3%
  750                                                                                                                                                                 3/3/2012                     1,411          1,826            - 22.7%
                                                                                                                                                                      3/10/2012                    1,450          1,454             - 0.3%
                                                                                                                                                                      3/17/2012                    1,406          1,424             - 1.3%
  500
    12/24/11     12/31/11   1/7/12   1/14/12     1/21/12      1/28/12     2/4/12      2/11/12     2/18/12      2/25/12      3/3/12      3/10/12     3/17/12           3-Month Total               15,212         16,547             - 8.1%


Historical New Listings
   3,500


   3,000


   2,500


   2,000


   1,500


   1,000


     500


        0
        1-2006                          1-2007                               1-2008                                1-2009                                1-2010                                1-2011                              1-2012


                                      All data from NorthstarMLS. Provided by the Minneapolis Area Association of REALTORS®. Powered by 10K Research and Marketing. | Sponsored by Royal Credit Union       www.rcu.org | Click for Cover Page | 2
Pending Sales
A count of the properties that have offers accepted on them in a given week.


Last Three Months                               Current Activity              One Year Ago                                                                           For the                    Current       One Year
                                                                                                                                                                                                                                    +/–
                                                                                                                                                                     Week Ending                Activity      Previous
1,100
                                                                                                                                                                     12/24/2011                    574             440            + 30.5%

1,000
                                                                                                                                                                     12/31/2011                    512             427            + 19.9%
                                                                                                                                                                     1/7/2012                      525             515             + 1.9%
  900                                                                                                                                                                1/14/2012                     698             583            + 19.7%
                                                                                                                                                                     1/21/2012                     706             572            + 23.4%
  800                                                                                                                                                                1/28/2012                     787             680            + 15.7%
                                                                                                                                                                     2/4/2012                      860             670            + 28.4%
  700                                                                                                                                                                2/11/2012                     884             730            + 21.1%
                                                                                                                                                                     2/18/2012                     864             719            + 20.2%
  600
                                                                                                                                                                     2/25/2012                     921             665            + 38.5%
                                                                                                                                                                     3/3/2012                      917             749            + 22.4%
  500
                                                                                                                                                                     3/10/2012                     960             841            + 14.1%
                                                                                                                                                                     3/17/2012                    1,029            836            + 23.1%
  400
    12/24/11    12/31/11   1/7/12   1/14/12     1/21/12      1/28/12     2/4/12      2/11/12     2/18/12      2/25/12      3/3/12      3/10/12     3/17/12           3-Month Total               10,237          8,427            + 21.5%


Historical Pending Sales
   1,600


   1,400


   1,200


   1,000


     800


     600


     400


     200
       1-2006                          1-2007                               1-2008                                1-2009                                1-2010                                1-2011                              1-2012


                                     All data from NorthstarMLS. Provided by the Minneapolis Area Association of REALTORS®. Powered by 10K Research and Marketing. | Sponsored by Royal Credit Union       www.rcu.org | Click for Cover Page | 3
Inventory of Homes for Sale
The number of properties available for sale in active status at the end of a given week.


Last Three Months                               Current Activity                One Year Ago                                                                          For the                    Current       One Year
                                                                                                                                                                                                                                     +/–
                                                                                                                                                                      Week Ending                Activity      Previous
26,000
                                                                                                                                                                      12/24/2011                  18,571         24,620            - 24.6%
25,000
                                                                                                                                                                      12/31/2011                  18,212         24,329            - 25.1%
24,000                                                                                                                                                                1/7/2012                    17,179         22,801            - 24.7%

23,000
                                                                                                                                                                      1/14/2012                   17,457         23,055            - 24.3%
                                                                                                                                                                      1/21/2012                   17,509         23,046            - 24.0%
22,000
                                                                                                                                                                      1/28/2012                   17,411         23,062            - 24.5%
21,000                                                                                                                                                                2/4/2012                    17,307         22,901            - 24.4%
20,000                                                                                                                                                                2/11/2012                   17,241         22,967            - 24.9%
                                                                                                                                                                      2/18/2012                   17,251         22,980            - 24.9%
19,000
                                                                                                                                                                      2/25/2012                   17,183         23,026            - 25.4%
18,000                                                                                                                                                                3/3/2012                    17,177         22,943            - 25.1%
17,000                                                                                                                                                                3/10/2012                   17,119         23,441            - 27.0%
                                                                                                                                                                      3/17/2012                   17,088         23,556            - 27.5%
16,000
     12/24/11    12/31/11   1/7/12   1/14/12    1/21/12      1/28/12      2/4/12      2/11/12     2/18/12      2/25/12      3/3/12      3/10/12     3/17/12           3-Month Avg                 17,439         23,287            - 25.1%


Historical Inventory Levels
   40,000


   35,000


   30,000


   25,000


   20,000


   15,000


   10,000
        1-2004                   1-2005                    1-2006                       1-2007                       1-2008                       1-2009                      1-2010                    1-2011                       1-2012


                                      All data from NorthstarMLS. Provided by the Minneapolis Area Association of REALTORS®. Powered by 10K Research and Marketing. | Sponsored by Royal Credit Union       www.rcu.org | Click for Cover Page | 4
Days on Market Until Sale
Average number of days between when a property is listed and when an offer is accepted in a given month.


                                                                                                                                                                                              Current       One Year
February                                                                                                                                                          Month
                                                                                                                                                                                              Activity      Previous
                                                                                                                                                                                                                                  +/–

                                                                  159                                                                                             March                         160              135            + 18.6%
                  141                                                                                                   145                                       April                         159              130            + 22.2%
                                                                                                                                                                  May                           155              123            + 26.6%
                                                                                                                                                                  June                          145              124            + 16.6%
                                                                                                                                                                  July                          146              132            + 10.4%
                                                                                                                                                                  August                        141              132             + 6.2%
                                                                                                                                                                  September                     142              135             + 4.8%
                                                                                                                                                                  October                       138              141             - 1.9%
                                                                                                                                                                  November                      140              143             - 2.6%
                                                                                                                                                                  December                      141              144             - 2.2%
                                                                                                                                                                  January                       141              155             - 8.7%
                                                              + 12.9%                                                - 9.0%
                                                                                                                                                                  February                      145              159             - 9.0%
                  2010                                            2011                                                  2012                                      12-Month Avg                  146              135             + 7.8%


Historical Days on Market Until Sale
  170


  160


  150


  140


  130


  120


  110
    1-2007                               1-2008                                         1-2009                                        1-2010                                         1-2011                                        1-2012


                                  All data from NorthstarMLS. Provided by the Minneapolis Area Association of REALTORS®. Powered by 10K Research and Marketing. | Sponsored by Royal Credit Union        www.rcu.org | Click for Cover Page | 5
Median Sales Price
Median price point for all closed sales, not accounting for seller concessions, in a given month.


                                                                                                                                                                                               Current       One Year
February                                                                                                                                                            Month
                                                                                                                                                                                               Activity      Previous
                                                                                                                                                                                                                                   +/–

                                                                                                                                                                    March                     $140,000        $165,000           - 15.2%
                $161,050                                                                                                                                            April                     $144,950        $170,000           - 14.7%

                                                               $140,000                                                                                             May                       $153,000        $175,000           - 12.6%
                                                                                                                     $138,000
                                                                                                                                                                    June                      $162,217        $180,000            - 9.9%
                                                                                                                                                                    July                      $157,500        $174,900            - 9.9%
                                                                                                                                                                    August                    $155,000        $175,000           - 11.4%
                                                                                                                                                                    September                 $155,000        $166,500            - 6.9%
                                                                                                                                                                    October                   $152,500        $171,000           - 10.8%
                                                                                                                                                                    November                  $147,250        $165,000           - 10.8%
                                                                                                                                                                    December                  $145,000        $155,000            - 6.5%
                                                                                                                                                                    January                   $140,000        $145,000            - 3.4%
                                                                 - 13.1%                                               - 1.4%
                                                                                                                                                                    February                  $138,000        $140,000            - 1.4%
                   2010                                             2011                                                  2012                                      12-Month Med              $150,000        $168,000           - 10.7%


Historical Median Sales Price
$250,000


$230,000


$210,000


$190,000


$170,000


$150,000


$130,000
       1-2003              1-2004                  1-2005                    1-2006                   1-2007                    1-2008                    1-2009                    1-2010                 1-2011                    1-2012


                                     All data from NorthstarMLS. Provided by the Minneapolis Area Association of REALTORS®. Powered by 10K Research and Marketing | Sponsored by Royal Credit Union       www.rcu.org | Click for Cover Page | 6
Percent of Original List Price Received
Percentage found when dividing a property’s sales price by it's original list price, then taking the average for all properties sold in a given month,
not accounting for seller concessions.


                                                                                                                                                                                                Current        One Year
February                                                                                                                                                             Month
                                                                                                                                                                                                Activity       Previous
                                                                                                                                                                                                                                     +/–

                 93.3%                                                                                                                                               March                       88.7%            94.1%             - 5.7%
                                                                   88.3%                                                90.6%                                        April                       90.1%            93.7%             - 3.8%
                                                                                                                                                                     May                         91.1%            94.2%             - 3.3%
                                                                                                                                                                     June                        91.4%            93.5%             - 2.3%
                                                                                                                                                                     July                        91.7%            91.9%             - 0.2%
                                                                                                                                                                     August                      91.2%            91.2%             + 0.1%
                                                                                                                                                                     September                   91.1%            90.9%             + 0.3%
                                                                                                                                                                     October                     91.3%            90.4%             + 0.9%
                                                                                                                                                                     November                    90.9%            90.0%             + 1.0%
                                                                                                                                                                     December                    90.6%            89.1%             + 1.7%
                                                                                                                                                                     January                     91.2%            88.3%             + 3.4%
                                                                   - 5.3%                                               + 2.5%
                                                                                                                                                                     February                    90.6%            88.3%             + 2.5%
                   2010                                              2011                                                   2012                                     12-Month Avg                90.9%            91.8%             - 1.0%


Historical Percent of Original List Price Received
100%


 98%


 96%


 94%


 92%


 90%


 88%


 86%
   1-2004                    1-2005                     1-2006                        1-2007                       1-2008                        1-2009                       1-2010                       1-2011                       1-2012


                                      All data from NorthstarMLS. Provided by the Minneapolis Area Association of REALTORS®. Powered by 10K Research and Marketing | Sponsored by Royal Credit Union        www.rcu.org | Click for Cover Page | 7
Housing Affordability Index
This index measures housing affordability for the region. An index of 120 means the median household income was 120% of what is necessary
to qualify for the median-priced home under prevailing interest rates. A higher number means greater affordability.


                                                                                                                                                                                              Current        One Year
February                                                                                                                                                           Month
                                                                                                                                                                                              Activity       Previous
                                                                                                                                                                                                                                   +/–

                                                                                                                          271                                      March                         253              216            + 17.5%
                                                                   250                                                                                             April                         247              210            + 17.2%
                  222                                                                                                                                              May                           242              206            + 17.6%
                                                                                                                                                                   June                          234              208            + 12.1%
                                                                                                                                                                   July                          237              217             + 9.1%
                                                                                                                                                                   August                        246              220            + 11.7%
                                                                                                                                                                   September                     249              230             + 8.5%
                                                                                                                                                                   October                       249              226            + 10.5%
                                                                                                                                                                   November                      259              233            + 11.1%
                                                                                                                                                                   December                      264              241             + 9.4%
                                                                                                                                                                   January                       268              245             + 9.5%
                                                               + 12.6%                                                + 8.3%                                       February                      271              250             + 8.3%

                  2010                                             2011                                                   2012                                     12-Month Avg                  251              226            + 11.2%


Historical Housing Affordability Index
  280


  260

  240


  220

  200


  180

  160

  140


  120
    1-2004                 1-2005                     1-2006                        1-2007                       1-2008                        1-2009                        1-2010                      1-2011                       1-2012


                                    All data from NorthstarMLS. Provided by the Minneapolis Area Association of REALTORS®. Powered by 10K Research and Marketing | Sponsored by Royal Credit Union        www.rcu.org | Click for Cover Page | 8
Months Supply of Inventory
The inventory of homes for sale at the end of a given month, divided by the average monthly pending sales from the last 12 months.


                                                                                                                                                                                              Current          One Year
February                                                                                                                                                           Month
                                                                                                                                                                                              Activity         Previous
                                                                                                                                                                                                                                     +/–
                                                                    7.3                                                                                            March                             7.6            6.8            + 11.7%

                   6.2                                                                                                                                             April                         8.2                7.0            + 16.4%
                                                                                                                                                                   May                               8.2            7.2            + 14.3%
                                                                                                                                                                   June                          8.0                7.7             + 3.9%
                                                                                                                          4.7                                      July                          7.6                8.1             - 5.7%
                                                                                                                                                                   August                            7.1            8.3            - 14.3%
                                                                                                                                                                   September                         6.7            8.5            - 21.1%
                                                                                                                                                                   October                           6.2            8.5            - 27.2%
                                                                                                                                                                   November                          5.6            8.0            - 29.9%
                                                                                                                                                                   December                          4.9            7.1            - 31.5%
                                                                                                                                                                   January                           4.8            7.2            - 32.8%
                                                               + 16.6%                                                - 35.2%
                                                                                                                                                                   February                      4.7                7.3            - 35.2%
                  2010                                             2011                                                   2012                                     12-Month Avg                  6.6                7.6            - 13.1%


Historical Months Supply of Inventory
   12

   11

   10

    9

    8

    7

    6

    5

    4

    3

    2
    1-2004                 1-2005                     1-2006                        1-2007                       1-2008                       1-2009                        1-2010                         1-2011                      1-2012


                                    All data from NorthstarMLS. Provided by the Minneapolis Area Association of REALTORS®. Powered by 10K Research and Marketing | Sponsored by Royal Credit Union          www.rcu.org | Click for Cover Page | 9

Mais conteúdo relacionado

Mais procurados

Charleston Real Estate Sales
Charleston Real Estate SalesCharleston Real Estate Sales
Charleston Real Estate SalesSteve DeGuzman
 
Compare local to general info blaine mn 08feb12
Compare local to general info blaine mn 08feb12Compare local to general info blaine mn 08feb12
Compare local to general info blaine mn 08feb12pattiann
 
Cincinnati OH Office Trends Q3 2011
Cincinnati OH Office Trends Q3 2011Cincinnati OH Office Trends Q3 2011
Cincinnati OH Office Trends Q3 2011colliersohio
 
Toronto Real Estate Statistics september 2011
Toronto Real Estate Statistics september 2011Toronto Real Estate Statistics september 2011
Toronto Real Estate Statistics september 2011John Helfrich
 
Q2 2011 Houston Industrial Market Report
Q2 2011 Houston Industrial Market ReportQ2 2011 Houston Industrial Market Report
Q2 2011 Houston Industrial Market ReportCoy Davidson
 
Market results march 2012 jfs
Market results march 2012 jfsMarket results march 2012 jfs
Market results march 2012 jfsjimkane1
 
Economy And Apartment Outlook - May 2011
Economy And Apartment Outlook - May 2011Economy And Apartment Outlook - May 2011
Economy And Apartment Outlook - May 2011jdpackwood
 
SAR Monthly Statistics Released for June 2011
SAR Monthly Statistics Released for June 2011SAR Monthly Statistics Released for June 2011
SAR Monthly Statistics Released for June 2011Sarasota Real Estate
 
Residential Sales Report - December 2011
Residential Sales Report - December 2011Residential Sales Report - December 2011
Residential Sales Report - December 2011Team Price Real Estate
 
Analyst meet 21stfeb12
Analyst meet 21stfeb12Analyst meet 21stfeb12
Analyst meet 21stfeb12washimsarkar
 
National Market Report
National Market ReportNational Market Report
National Market Reportjonathanrutman
 

Mais procurados (17)

Charleston Real Estate Sales
Charleston Real Estate SalesCharleston Real Estate Sales
Charleston Real Estate Sales
 
Hobart Sept 2008
Hobart Sept 2008Hobart Sept 2008
Hobart Sept 2008
 
Compare local to general info blaine mn 08feb12
Compare local to general info blaine mn 08feb12Compare local to general info blaine mn 08feb12
Compare local to general info blaine mn 08feb12
 
Cincinnati OH Office Trends Q3 2011
Cincinnati OH Office Trends Q3 2011Cincinnati OH Office Trends Q3 2011
Cincinnati OH Office Trends Q3 2011
 
Toronto Real Estate Statistics september 2011
Toronto Real Estate Statistics september 2011Toronto Real Estate Statistics september 2011
Toronto Real Estate Statistics september 2011
 
Q2 2011 Houston Industrial Market Report
Q2 2011 Houston Industrial Market ReportQ2 2011 Houston Industrial Market Report
Q2 2011 Houston Industrial Market Report
 
San Mateo County Real Estate Price Report
San Mateo County Real Estate Price ReportSan Mateo County Real Estate Price Report
San Mateo County Real Estate Price Report
 
Market Watch April 2011
Market Watch April 2011Market Watch April 2011
Market Watch April 2011
 
Apre 3 t05
Apre 3 t05Apre 3 t05
Apre 3 t05
 
1221 w wagnermarket19141
1221 w wagnermarket191411221 w wagnermarket19141
1221 w wagnermarket19141
 
Market results march 2012 jfs
Market results march 2012 jfsMarket results march 2012 jfs
Market results march 2012 jfs
 
Economy And Apartment Outlook - May 2011
Economy And Apartment Outlook - May 2011Economy And Apartment Outlook - May 2011
Economy And Apartment Outlook - May 2011
 
SAR Monthly Statistics Released for June 2011
SAR Monthly Statistics Released for June 2011SAR Monthly Statistics Released for June 2011
SAR Monthly Statistics Released for June 2011
 
Residential Sales Report - December 2011
Residential Sales Report - December 2011Residential Sales Report - December 2011
Residential Sales Report - December 2011
 
Analyst meet 21stfeb12
Analyst meet 21stfeb12Analyst meet 21stfeb12
Analyst meet 21stfeb12
 
Gt2011
Gt2011Gt2011
Gt2011
 
National Market Report
National Market ReportNational Market Report
National Market Report
 

Destaque

Weekly Activity Report 4-10Mar15
Weekly Activity Report 4-10Mar15Weekly Activity Report 4-10Mar15
Weekly Activity Report 4-10Mar15Cyndee O'Quinn
 
Home Buyer Guide from REALTOR.COM
Home Buyer Guide from REALTOR.COMHome Buyer Guide from REALTOR.COM
Home Buyer Guide from REALTOR.COMpattiann
 
Agency Relationships In Real Estate Transactions 11/2010
Agency Relationships In Real Estate Transactions 11/2010Agency Relationships In Real Estate Transactions 11/2010
Agency Relationships In Real Estate Transactions 11/2010pattiann
 
Healthcare & pharma supply chain snap shot
Healthcare & pharma supply chain snap shotHealthcare & pharma supply chain snap shot
Healthcare & pharma supply chain snap shotMansingh Jaswal
 
How Should You Spend Your Calorie Salary?
How Should You Spend Your Calorie Salary?How Should You Spend Your Calorie Salary?
How Should You Spend Your Calorie Salary?Alice Henneman
 

Destaque (6)

Conociendo a MUNMI
Conociendo a MUNMIConociendo a MUNMI
Conociendo a MUNMI
 
Weekly Activity Report 4-10Mar15
Weekly Activity Report 4-10Mar15Weekly Activity Report 4-10Mar15
Weekly Activity Report 4-10Mar15
 
Home Buyer Guide from REALTOR.COM
Home Buyer Guide from REALTOR.COMHome Buyer Guide from REALTOR.COM
Home Buyer Guide from REALTOR.COM
 
Agency Relationships In Real Estate Transactions 11/2010
Agency Relationships In Real Estate Transactions 11/2010Agency Relationships In Real Estate Transactions 11/2010
Agency Relationships In Real Estate Transactions 11/2010
 
Healthcare & pharma supply chain snap shot
Healthcare & pharma supply chain snap shotHealthcare & pharma supply chain snap shot
Healthcare & pharma supply chain snap shot
 
How Should You Spend Your Calorie Salary?
How Should You Spend Your Calorie Salary?How Should You Spend Your Calorie Salary?
How Should You Spend Your Calorie Salary?
 

Semelhante a Minneapolis Saint Paul Twin Cities Metro Area Updated Weekly Real Estate Market Activity Report Feb 2012

Metro Boston Monthly Indicators Report, October 2012
Metro Boston Monthly Indicators Report, October 2012 Metro Boston Monthly Indicators Report, October 2012
Metro Boston Monthly Indicators Report, October 2012 Unit Realty Group
 
Monthly Real Estate Indicators: Twin Cities Housing Market Info & Statistics
Monthly Real Estate Indicators: Twin Cities Housing Market Info & StatisticsMonthly Real Estate Indicators: Twin Cities Housing Market Info & Statistics
Monthly Real Estate Indicators: Twin Cities Housing Market Info & Statisticspattiann
 
Twin Cities Market Update June 2012
Twin Cities Market Update June 2012Twin Cities Market Update June 2012
Twin Cities Market Update June 2012mgootee1
 
The Nest Report Q1 2012
The Nest Report Q1 2012The Nest Report Q1 2012
The Nest Report Q1 2012Jeremy Hart
 
The Nest Report Q3 2012
The Nest Report Q3 2012The Nest Report Q3 2012
The Nest Report Q3 2012Jeremy Hart
 
San Francisco Market Focus April 2018
San Francisco Market Focus April 2018San Francisco Market Focus April 2018
San Francisco Market Focus April 2018Ronny Budiutama
 
San Francisco Market Focus Report November 2018
San Francisco Market Focus Report November 2018San Francisco Market Focus Report November 2018
San Francisco Market Focus Report November 2018Ronny Budiutama
 
January 2018 San Francisco Market Update
January 2018 San Francisco Market UpdateJanuary 2018 San Francisco Market Update
January 2018 San Francisco Market UpdateRonny Budiutama
 
January 2014 Greater Boston Real Estate Market Trends Report
January 2014 Greater Boston Real Estate Market Trends ReportJanuary 2014 Greater Boston Real Estate Market Trends Report
January 2014 Greater Boston Real Estate Market Trends ReportUnit Realty Group
 
Greater Princeton NJ Real Estate Update
Greater Princeton NJ Real Estate UpdateGreater Princeton NJ Real Estate Update
Greater Princeton NJ Real Estate UpdateAnn Harwood
 
Greater Princeton NJ Real Estate Market October 2012
Greater Princeton NJ Real Estate Market October 2012Greater Princeton NJ Real Estate Market October 2012
Greater Princeton NJ Real Estate Market October 2012Ann Harwood
 
San Francisco Market Focus Report October 2018
San Francisco Market Focus Report October 2018San Francisco Market Focus Report October 2018
San Francisco Market Focus Report October 2018Ronny Budiutama
 
San Francisco Market Focus February 2018
San Francisco Market Focus February 2018San Francisco Market Focus February 2018
San Francisco Market Focus February 2018Ronny Budiutama
 
San Francisco market focus report June 2018
San Francisco market focus report June 2018San Francisco market focus report June 2018
San Francisco market focus report June 2018Ronny Budiutama
 
San Francisco Market Focus January 2015
San Francisco Market Focus January 2015San Francisco Market Focus January 2015
San Francisco Market Focus January 2015Ronny Budiutama
 
San Francisco Market Focus Report July
San Francisco Market Focus Report JulySan Francisco Market Focus Report July
San Francisco Market Focus Report JulyRonny Budiutama
 
San Francisco Market Focus Report Aug 2018
San Francisco Market Focus Report Aug 2018San Francisco Market Focus Report Aug 2018
San Francisco Market Focus Report Aug 2018Ronny Budiutama
 
Princeton Area Real Estate July 24 12
Princeton Area Real Estate July 24 12Princeton Area Real Estate July 24 12
Princeton Area Real Estate July 24 12Ann Harwood
 

Semelhante a Minneapolis Saint Paul Twin Cities Metro Area Updated Weekly Real Estate Market Activity Report Feb 2012 (20)

Metro Boston Monthly Indicators Report, October 2012
Metro Boston Monthly Indicators Report, October 2012 Metro Boston Monthly Indicators Report, October 2012
Metro Boston Monthly Indicators Report, October 2012
 
Monthly Real Estate Indicators: Twin Cities Housing Market Info & Statistics
Monthly Real Estate Indicators: Twin Cities Housing Market Info & StatisticsMonthly Real Estate Indicators: Twin Cities Housing Market Info & Statistics
Monthly Real Estate Indicators: Twin Cities Housing Market Info & Statistics
 
Twin Cities Market Update June 2012
Twin Cities Market Update June 2012Twin Cities Market Update June 2012
Twin Cities Market Update June 2012
 
The Nest Report Q1 2012
The Nest Report Q1 2012The Nest Report Q1 2012
The Nest Report Q1 2012
 
The Nest Report Q3 2012
The Nest Report Q3 2012The Nest Report Q3 2012
The Nest Report Q3 2012
 
Market Data, December 2012
Market Data, December 2012Market Data, December 2012
Market Data, December 2012
 
San Francisco Market Focus April 2018
San Francisco Market Focus April 2018San Francisco Market Focus April 2018
San Francisco Market Focus April 2018
 
San Francisco Market Focus Report November 2018
San Francisco Market Focus Report November 2018San Francisco Market Focus Report November 2018
San Francisco Market Focus Report November 2018
 
January 2018 San Francisco Market Update
January 2018 San Francisco Market UpdateJanuary 2018 San Francisco Market Update
January 2018 San Francisco Market Update
 
January 2014 Greater Boston Real Estate Market Trends Report
January 2014 Greater Boston Real Estate Market Trends ReportJanuary 2014 Greater Boston Real Estate Market Trends Report
January 2014 Greater Boston Real Estate Market Trends Report
 
Greater Princeton NJ Real Estate Update
Greater Princeton NJ Real Estate UpdateGreater Princeton NJ Real Estate Update
Greater Princeton NJ Real Estate Update
 
Greater Princeton NJ Real Estate Market October 2012
Greater Princeton NJ Real Estate Market October 2012Greater Princeton NJ Real Estate Market October 2012
Greater Princeton NJ Real Estate Market October 2012
 
December 2012 MLS Statistics
December 2012 MLS StatisticsDecember 2012 MLS Statistics
December 2012 MLS Statistics
 
San Francisco Market Focus Report October 2018
San Francisco Market Focus Report October 2018San Francisco Market Focus Report October 2018
San Francisco Market Focus Report October 2018
 
San Francisco Market Focus February 2018
San Francisco Market Focus February 2018San Francisco Market Focus February 2018
San Francisco Market Focus February 2018
 
San Francisco market focus report June 2018
San Francisco market focus report June 2018San Francisco market focus report June 2018
San Francisco market focus report June 2018
 
San Francisco Market Focus January 2015
San Francisco Market Focus January 2015San Francisco Market Focus January 2015
San Francisco Market Focus January 2015
 
San Francisco Market Focus Report July
San Francisco Market Focus Report JulySan Francisco Market Focus Report July
San Francisco Market Focus Report July
 
San Francisco Market Focus Report Aug 2018
San Francisco Market Focus Report Aug 2018San Francisco Market Focus Report Aug 2018
San Francisco Market Focus Report Aug 2018
 
Princeton Area Real Estate July 24 12
Princeton Area Real Estate July 24 12Princeton Area Real Estate July 24 12
Princeton Area Real Estate July 24 12
 

Mais de pattiann

Blaine sept 2012 stats real estate homes for sale 55434
Blaine sept 2012 stats real estate homes for sale 55434Blaine sept 2012 stats real estate homes for sale 55434
Blaine sept 2012 stats real estate homes for sale 55434pattiann
 
Farmington housing statistics jan2012
Farmington housing statistics jan2012Farmington housing statistics jan2012
Farmington housing statistics jan2012pattiann
 
Blaine dec2011
Blaine dec2011Blaine dec2011
Blaine dec2011pattiann
 
Updated brooklyn park homebuyer assistance programs
Updated brooklyn park homebuyer assistance programsUpdated brooklyn park homebuyer assistance programs
Updated brooklyn park homebuyer assistance programspattiann
 
NEXUS TRANSACTION INFORMATION SHEET
NEXUS TRANSACTION INFORMATION SHEETNEXUS TRANSACTION INFORMATION SHEET
NEXUS TRANSACTION INFORMATION SHEETpattiann
 
The EXIT System
The EXIT SystemThe EXIT System
The EXIT Systempattiann
 
Energy Efficient Tips for Homeowners
Energy Efficient Tips for HomeownersEnergy Efficient Tips for Homeowners
Energy Efficient Tips for Homeownerspattiann
 

Mais de pattiann (7)

Blaine sept 2012 stats real estate homes for sale 55434
Blaine sept 2012 stats real estate homes for sale 55434Blaine sept 2012 stats real estate homes for sale 55434
Blaine sept 2012 stats real estate homes for sale 55434
 
Farmington housing statistics jan2012
Farmington housing statistics jan2012Farmington housing statistics jan2012
Farmington housing statistics jan2012
 
Blaine dec2011
Blaine dec2011Blaine dec2011
Blaine dec2011
 
Updated brooklyn park homebuyer assistance programs
Updated brooklyn park homebuyer assistance programsUpdated brooklyn park homebuyer assistance programs
Updated brooklyn park homebuyer assistance programs
 
NEXUS TRANSACTION INFORMATION SHEET
NEXUS TRANSACTION INFORMATION SHEETNEXUS TRANSACTION INFORMATION SHEET
NEXUS TRANSACTION INFORMATION SHEET
 
The EXIT System
The EXIT SystemThe EXIT System
The EXIT System
 
Energy Efficient Tips for Homeowners
Energy Efficient Tips for HomeownersEnergy Efficient Tips for Homeowners
Energy Efficient Tips for Homeowners
 

Último

Cheap Rate ✨➥9582086666▻✨Call Girls In Gurgaon Sector 1 (Gurgaon)
Cheap Rate ✨➥9582086666▻✨Call Girls In Gurgaon Sector 1 (Gurgaon)Cheap Rate ✨➥9582086666▻✨Call Girls In Gurgaon Sector 1 (Gurgaon)
Cheap Rate ✨➥9582086666▻✨Call Girls In Gurgaon Sector 1 (Gurgaon)delhi24hrs1
 
BPTP THE AMAARIO For The Royals Of Tomorrow in Sector 37D Gurgaon Dwarka Expr...
BPTP THE AMAARIO For The Royals Of Tomorrow in Sector 37D Gurgaon Dwarka Expr...BPTP THE AMAARIO For The Royals Of Tomorrow in Sector 37D Gurgaon Dwarka Expr...
BPTP THE AMAARIO For The Royals Of Tomorrow in Sector 37D Gurgaon Dwarka Expr...ApartmentWala1
 
Eldeco Dwarka Project In Delhi-brochure.pdf.pdf
Eldeco Dwarka Project In Delhi-brochure.pdf.pdfEldeco Dwarka Project In Delhi-brochure.pdf.pdf
Eldeco Dwarka Project In Delhi-brochure.pdf.pdfkratirudram
 
Yashwin Enchante Uppar Kharadi Pune E-Brochue.pdf
Yashwin Enchante Uppar Kharadi Pune  E-Brochue.pdfYashwin Enchante Uppar Kharadi Pune  E-Brochue.pdf
Yashwin Enchante Uppar Kharadi Pune E-Brochue.pdfManishSaxena95
 
Explore Dual Citizenship in Africa | Citizenship Benefits & Requirements
Explore Dual Citizenship in Africa | Citizenship Benefits & RequirementsExplore Dual Citizenship in Africa | Citizenship Benefits & Requirements
Explore Dual Citizenship in Africa | Citizenship Benefits & Requirementsmarketingkingdomofku
 
Vanam At Purva Soukhyam Guduvanchery.pdf.pdf
Vanam At Purva Soukhyam Guduvanchery.pdf.pdfVanam At Purva Soukhyam Guduvanchery.pdf.pdf
Vanam At Purva Soukhyam Guduvanchery.pdf.pdfkratirudram
 
Low Rate ✨➥9711108085▻✨Call Girls In Majnu Ka Tilla (Mt) (Delhi)
Low Rate ✨➥9711108085▻✨Call Girls In Majnu Ka Tilla (Mt) (Delhi)Low Rate ✨➥9711108085▻✨Call Girls In Majnu Ka Tilla (Mt) (Delhi)
Low Rate ✨➥9711108085▻✨Call Girls In Majnu Ka Tilla (Mt) (Delhi)delhi24hrs1
 
~Call Girls In Roop Nagar {8447779280}(Low Price) Escort Service In Delhi
~Call Girls In Roop Nagar {8447779280}(Low Price) Escort Service In Delhi~Call Girls In Roop Nagar {8447779280}(Low Price) Escort Service In Delhi
~Call Girls In Roop Nagar {8447779280}(Low Price) Escort Service In Delhiasmaqueen5
 
Low rate ↬Call girls in Sabzi Mandi Delhi | 8447779280}Escort Service In All ...
Low rate ↬Call girls in Sabzi Mandi Delhi | 8447779280}Escort Service In All ...Low rate ↬Call girls in Sabzi Mandi Delhi | 8447779280}Escort Service In All ...
Low rate ↬Call girls in Sabzi Mandi Delhi | 8447779280}Escort Service In All ...asmaqueen5
 
Parksville 96 Surrey Floor Plans May 2024
Parksville 96 Surrey Floor Plans May 2024Parksville 96 Surrey Floor Plans May 2024
Parksville 96 Surrey Floor Plans May 2024VickyAulakh1
 
Cheap Rate ✨➥9711108085▻✨Call Girls In Connaught Place (Delhi)
Cheap Rate ✨➥9711108085▻✨Call Girls In Connaught Place (Delhi)Cheap Rate ✨➥9711108085▻✨Call Girls In Connaught Place (Delhi)
Cheap Rate ✨➥9711108085▻✨Call Girls In Connaught Place (Delhi)delhi24hrs1
 
Housing Price Regulation Thesis Defense by Slidesgo.pptx
Housing Price Regulation Thesis Defense by Slidesgo.pptxHousing Price Regulation Thesis Defense by Slidesgo.pptx
Housing Price Regulation Thesis Defense by Slidesgo.pptxcosmo-soil
 
Bptp The Amaario Launch Luxury Project Sector 37D Gurgaon Dwarka Expressway...
Bptp The Amaario Launch  Luxury Project  Sector 37D Gurgaon Dwarka Expressway...Bptp The Amaario Launch  Luxury Project  Sector 37D Gurgaon Dwarka Expressway...
Bptp The Amaario Launch Luxury Project Sector 37D Gurgaon Dwarka Expressway...ApartmentWala1
 
Kohinoor Courtyard One Wakad Pune | Elegant Living Spaces
Kohinoor Courtyard One Wakad Pune | Elegant Living SpacesKohinoor Courtyard One Wakad Pune | Elegant Living Spaces
Kohinoor Courtyard One Wakad Pune | Elegant Living Spacesaidasheikh47
 
Top tourism places in Dubai - Inch & Brick Realty
Top tourism places in Dubai - Inch & Brick RealtyTop tourism places in Dubai - Inch & Brick Realty
Top tourism places in Dubai - Inch & Brick Realtypunitranainchbrick02
 
Kalpataru Exquisite Wakad Pune E-Brochure.pdf
Kalpataru Exquisite Wakad Pune  E-Brochure.pdfKalpataru Exquisite Wakad Pune  E-Brochure.pdf
Kalpataru Exquisite Wakad Pune E-Brochure.pdfManishSaxena95
 
Low Rate ✨➥9711108085▻✨Call Girls In East Of Kailash (E.K) (Delhi)
Low Rate ✨➥9711108085▻✨Call Girls In East Of Kailash (E.K) (Delhi)Low Rate ✨➥9711108085▻✨Call Girls In East Of Kailash (E.K) (Delhi)
Low Rate ✨➥9711108085▻✨Call Girls In East Of Kailash (E.K) (Delhi)delhi24hrs1
 
construction material procurement in India
construction material procurement in Indiaconstruction material procurement in India
construction material procurement in Indiarohanindosup
 
Real Estate Finance and Investments (2019).pdf
Real Estate Finance and Investments (2019).pdfReal Estate Finance and Investments (2019).pdf
Real Estate Finance and Investments (2019).pdfZahraYusuf9
 
Yedi Mavi TOBB Zeytinburnu - Listing Turkey
Yedi Mavi TOBB Zeytinburnu - Listing TurkeyYedi Mavi TOBB Zeytinburnu - Listing Turkey
Yedi Mavi TOBB Zeytinburnu - Listing TurkeyListing Turkey
 

Último (20)

Cheap Rate ✨➥9582086666▻✨Call Girls In Gurgaon Sector 1 (Gurgaon)
Cheap Rate ✨➥9582086666▻✨Call Girls In Gurgaon Sector 1 (Gurgaon)Cheap Rate ✨➥9582086666▻✨Call Girls In Gurgaon Sector 1 (Gurgaon)
Cheap Rate ✨➥9582086666▻✨Call Girls In Gurgaon Sector 1 (Gurgaon)
 
BPTP THE AMAARIO For The Royals Of Tomorrow in Sector 37D Gurgaon Dwarka Expr...
BPTP THE AMAARIO For The Royals Of Tomorrow in Sector 37D Gurgaon Dwarka Expr...BPTP THE AMAARIO For The Royals Of Tomorrow in Sector 37D Gurgaon Dwarka Expr...
BPTP THE AMAARIO For The Royals Of Tomorrow in Sector 37D Gurgaon Dwarka Expr...
 
Eldeco Dwarka Project In Delhi-brochure.pdf.pdf
Eldeco Dwarka Project In Delhi-brochure.pdf.pdfEldeco Dwarka Project In Delhi-brochure.pdf.pdf
Eldeco Dwarka Project In Delhi-brochure.pdf.pdf
 
Yashwin Enchante Uppar Kharadi Pune E-Brochue.pdf
Yashwin Enchante Uppar Kharadi Pune  E-Brochue.pdfYashwin Enchante Uppar Kharadi Pune  E-Brochue.pdf
Yashwin Enchante Uppar Kharadi Pune E-Brochue.pdf
 
Explore Dual Citizenship in Africa | Citizenship Benefits & Requirements
Explore Dual Citizenship in Africa | Citizenship Benefits & RequirementsExplore Dual Citizenship in Africa | Citizenship Benefits & Requirements
Explore Dual Citizenship in Africa | Citizenship Benefits & Requirements
 
Vanam At Purva Soukhyam Guduvanchery.pdf.pdf
Vanam At Purva Soukhyam Guduvanchery.pdf.pdfVanam At Purva Soukhyam Guduvanchery.pdf.pdf
Vanam At Purva Soukhyam Guduvanchery.pdf.pdf
 
Low Rate ✨➥9711108085▻✨Call Girls In Majnu Ka Tilla (Mt) (Delhi)
Low Rate ✨➥9711108085▻✨Call Girls In Majnu Ka Tilla (Mt) (Delhi)Low Rate ✨➥9711108085▻✨Call Girls In Majnu Ka Tilla (Mt) (Delhi)
Low Rate ✨➥9711108085▻✨Call Girls In Majnu Ka Tilla (Mt) (Delhi)
 
~Call Girls In Roop Nagar {8447779280}(Low Price) Escort Service In Delhi
~Call Girls In Roop Nagar {8447779280}(Low Price) Escort Service In Delhi~Call Girls In Roop Nagar {8447779280}(Low Price) Escort Service In Delhi
~Call Girls In Roop Nagar {8447779280}(Low Price) Escort Service In Delhi
 
Low rate ↬Call girls in Sabzi Mandi Delhi | 8447779280}Escort Service In All ...
Low rate ↬Call girls in Sabzi Mandi Delhi | 8447779280}Escort Service In All ...Low rate ↬Call girls in Sabzi Mandi Delhi | 8447779280}Escort Service In All ...
Low rate ↬Call girls in Sabzi Mandi Delhi | 8447779280}Escort Service In All ...
 
Parksville 96 Surrey Floor Plans May 2024
Parksville 96 Surrey Floor Plans May 2024Parksville 96 Surrey Floor Plans May 2024
Parksville 96 Surrey Floor Plans May 2024
 
Cheap Rate ✨➥9711108085▻✨Call Girls In Connaught Place (Delhi)
Cheap Rate ✨➥9711108085▻✨Call Girls In Connaught Place (Delhi)Cheap Rate ✨➥9711108085▻✨Call Girls In Connaught Place (Delhi)
Cheap Rate ✨➥9711108085▻✨Call Girls In Connaught Place (Delhi)
 
Housing Price Regulation Thesis Defense by Slidesgo.pptx
Housing Price Regulation Thesis Defense by Slidesgo.pptxHousing Price Regulation Thesis Defense by Slidesgo.pptx
Housing Price Regulation Thesis Defense by Slidesgo.pptx
 
Bptp The Amaario Launch Luxury Project Sector 37D Gurgaon Dwarka Expressway...
Bptp The Amaario Launch  Luxury Project  Sector 37D Gurgaon Dwarka Expressway...Bptp The Amaario Launch  Luxury Project  Sector 37D Gurgaon Dwarka Expressway...
Bptp The Amaario Launch Luxury Project Sector 37D Gurgaon Dwarka Expressway...
 
Kohinoor Courtyard One Wakad Pune | Elegant Living Spaces
Kohinoor Courtyard One Wakad Pune | Elegant Living SpacesKohinoor Courtyard One Wakad Pune | Elegant Living Spaces
Kohinoor Courtyard One Wakad Pune | Elegant Living Spaces
 
Top tourism places in Dubai - Inch & Brick Realty
Top tourism places in Dubai - Inch & Brick RealtyTop tourism places in Dubai - Inch & Brick Realty
Top tourism places in Dubai - Inch & Brick Realty
 
Kalpataru Exquisite Wakad Pune E-Brochure.pdf
Kalpataru Exquisite Wakad Pune  E-Brochure.pdfKalpataru Exquisite Wakad Pune  E-Brochure.pdf
Kalpataru Exquisite Wakad Pune E-Brochure.pdf
 
Low Rate ✨➥9711108085▻✨Call Girls In East Of Kailash (E.K) (Delhi)
Low Rate ✨➥9711108085▻✨Call Girls In East Of Kailash (E.K) (Delhi)Low Rate ✨➥9711108085▻✨Call Girls In East Of Kailash (E.K) (Delhi)
Low Rate ✨➥9711108085▻✨Call Girls In East Of Kailash (E.K) (Delhi)
 
construction material procurement in India
construction material procurement in Indiaconstruction material procurement in India
construction material procurement in India
 
Real Estate Finance and Investments (2019).pdf
Real Estate Finance and Investments (2019).pdfReal Estate Finance and Investments (2019).pdf
Real Estate Finance and Investments (2019).pdf
 
Yedi Mavi TOBB Zeytinburnu - Listing Turkey
Yedi Mavi TOBB Zeytinburnu - Listing TurkeyYedi Mavi TOBB Zeytinburnu - Listing Turkey
Yedi Mavi TOBB Zeytinburnu - Listing Turkey
 

Minneapolis Saint Paul Twin Cities Metro Area Updated Weekly Real Estate Market Activity Report Feb 2012

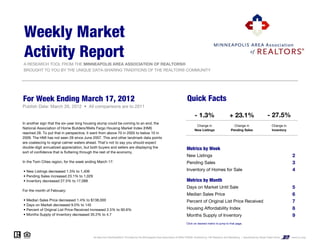
  • 1. Weekly Market Activity Report A RESEARCH TOOL FROM THE MINNEAPOLIS AREA ASSOCIATION OF REALTORS® BROUGHT TO YOU BY THE UNIQUE DATA-SHARING TRADITIONS OF THE REALTOR® COMMUNITY For Week Ending March 17, 2012 Quick Facts Publish Date: March 26, 2012 • All comparisons are to 2011 - 1.3% + 23.1% - 27.5% In another sign that the six-year long housing slump could be coming to an end, the Change in g Change in g Change in g N ti National A l Association of H i ti f Home B ild /W ll F Builders/Wells Fargo HHousing M k t I d (HMI) i Market Index New Listings Pending Sales Inventory reached 28. To put that in perspective, it went from above 70 in 2005 to below 10 in 2009. The HMI has not seen 28 since June 2007. This and other landmark data points are coalescing to signal calmer waters ahead. That's not to say you should expect double-digit annualized appreciation, but both buyers and sellers are displaying the Metrics by Week sort of confidence that is fluttering through the rest of the economy. New Listings 2 In the Twin Cities region, for the week ending March 17: Pending Sales 3 • New Listings decreased 1.3% to 1,406 Inventory of Homes for Sale 4 • Pending Sales increased 23.1% to 1,029 • Inventory decreased 27.5% to 17,088 Metrics by Month Days on Market Until Sale 5 For the month of February: Median Sales Price 6 • Median Sales Price decreased 1.4% to $138,000 Percent of Original List Price Received 7 • Days on Market decreased 9.0% to 145 • Percent of Original List Price Received increased 2.5% to 90.6% Housing Affordability Index 8 • Months Supply of Inventory decreased 35.2% to 4.7 Months Supply of Inventory 9 Click on desired metric to jump to that page. All data from NorthstarMLS. Provided by the Minneapolis Area Association of REALTORS®. Powered by 10K Research and Marketing. | Sponsored by Royal Credit Union www.rcu.org
  • 2. New Listings A count of the properties that have been newly listed on the market in a given week. Last Three Months Current Activity One Year Ago For the Current One Year +/– Week Ending Activity Previous 2,000 12/24/2011 600 660 - 9.1% 12/31/2011 598 671 - 10.9% 1,750 1/7/2012 1,273 1,484 - 14.2% 1/14/2012 1,219 1,283 - 5.0% 1,500 1/21/2012 1,096 1,190 - 7.9% 1/28/2012 1,091 1,322 - 17.5% 1,250 2/4/2012 1,239 1,325 - 6.5% 2/11/2012 1,318 1,318 0.0% 1,000 2/18/2012 1,258 1,353 - 7.0% 2/25/2012 1,253 1,237 + 1.3% 750 3/3/2012 1,411 1,826 - 22.7% 3/10/2012 1,450 1,454 - 0.3% 3/17/2012 1,406 1,424 - 1.3% 500 12/24/11 12/31/11 1/7/12 1/14/12 1/21/12 1/28/12 2/4/12 2/11/12 2/18/12 2/25/12 3/3/12 3/10/12 3/17/12 3-Month Total 15,212 16,547 - 8.1% Historical New Listings 3,500 3,000 2,500 2,000 1,500 1,000 500 0 1-2006 1-2007 1-2008 1-2009 1-2010 1-2011 1-2012 All data from NorthstarMLS. Provided by the Minneapolis Area Association of REALTORS®. Powered by 10K Research and Marketing. | Sponsored by Royal Credit Union www.rcu.org | Click for Cover Page | 2
  • 3. Pending Sales A count of the properties that have offers accepted on them in a given week. Last Three Months Current Activity One Year Ago For the Current One Year +/– Week Ending Activity Previous 1,100 12/24/2011 574 440 + 30.5% 1,000 12/31/2011 512 427 + 19.9% 1/7/2012 525 515 + 1.9% 900 1/14/2012 698 583 + 19.7% 1/21/2012 706 572 + 23.4% 800 1/28/2012 787 680 + 15.7% 2/4/2012 860 670 + 28.4% 700 2/11/2012 884 730 + 21.1% 2/18/2012 864 719 + 20.2% 600 2/25/2012 921 665 + 38.5% 3/3/2012 917 749 + 22.4% 500 3/10/2012 960 841 + 14.1% 3/17/2012 1,029 836 + 23.1% 400 12/24/11 12/31/11 1/7/12 1/14/12 1/21/12 1/28/12 2/4/12 2/11/12 2/18/12 2/25/12 3/3/12 3/10/12 3/17/12 3-Month Total 10,237 8,427 + 21.5% Historical Pending Sales 1,600 1,400 1,200 1,000 800 600 400 200 1-2006 1-2007 1-2008 1-2009 1-2010 1-2011 1-2012 All data from NorthstarMLS. Provided by the Minneapolis Area Association of REALTORS®. Powered by 10K Research and Marketing. | Sponsored by Royal Credit Union www.rcu.org | Click for Cover Page | 3
  • 4. Inventory of Homes for Sale The number of properties available for sale in active status at the end of a given week. Last Three Months Current Activity One Year Ago For the Current One Year +/– Week Ending Activity Previous 26,000 12/24/2011 18,571 24,620 - 24.6% 25,000 12/31/2011 18,212 24,329 - 25.1% 24,000 1/7/2012 17,179 22,801 - 24.7% 23,000 1/14/2012 17,457 23,055 - 24.3% 1/21/2012 17,509 23,046 - 24.0% 22,000 1/28/2012 17,411 23,062 - 24.5% 21,000 2/4/2012 17,307 22,901 - 24.4% 20,000 2/11/2012 17,241 22,967 - 24.9% 2/18/2012 17,251 22,980 - 24.9% 19,000 2/25/2012 17,183 23,026 - 25.4% 18,000 3/3/2012 17,177 22,943 - 25.1% 17,000 3/10/2012 17,119 23,441 - 27.0% 3/17/2012 17,088 23,556 - 27.5% 16,000 12/24/11 12/31/11 1/7/12 1/14/12 1/21/12 1/28/12 2/4/12 2/11/12 2/18/12 2/25/12 3/3/12 3/10/12 3/17/12 3-Month Avg 17,439 23,287 - 25.1% Historical Inventory Levels 40,000 35,000 30,000 25,000 20,000 15,000 10,000 1-2004 1-2005 1-2006 1-2007 1-2008 1-2009 1-2010 1-2011 1-2012 All data from NorthstarMLS. Provided by the Minneapolis Area Association of REALTORS®. Powered by 10K Research and Marketing. | Sponsored by Royal Credit Union www.rcu.org | Click for Cover Page | 4
  • 5. Days on Market Until Sale Average number of days between when a property is listed and when an offer is accepted in a given month. Current One Year February Month Activity Previous +/– 159 March 160 135 + 18.6% 141 145 April 159 130 + 22.2% May 155 123 + 26.6% June 145 124 + 16.6% July 146 132 + 10.4% August 141 132 + 6.2% September 142 135 + 4.8% October 138 141 - 1.9% November 140 143 - 2.6% December 141 144 - 2.2% January 141 155 - 8.7% + 12.9% - 9.0% February 145 159 - 9.0% 2010 2011 2012 12-Month Avg 146 135 + 7.8% Historical Days on Market Until Sale 170 160 150 140 130 120 110 1-2007 1-2008 1-2009 1-2010 1-2011 1-2012 All data from NorthstarMLS. Provided by the Minneapolis Area Association of REALTORS®. Powered by 10K Research and Marketing. | Sponsored by Royal Credit Union www.rcu.org | Click for Cover Page | 5
  • 6. Median Sales Price Median price point for all closed sales, not accounting for seller concessions, in a given month. Current One Year February Month Activity Previous +/– March $140,000 $165,000 - 15.2% $161,050 April $144,950 $170,000 - 14.7% $140,000 May $153,000 $175,000 - 12.6% $138,000 June $162,217 $180,000 - 9.9% July $157,500 $174,900 - 9.9% August $155,000 $175,000 - 11.4% September $155,000 $166,500 - 6.9% October $152,500 $171,000 - 10.8% November $147,250 $165,000 - 10.8% December $145,000 $155,000 - 6.5% January $140,000 $145,000 - 3.4% - 13.1% - 1.4% February $138,000 $140,000 - 1.4% 2010 2011 2012 12-Month Med $150,000 $168,000 - 10.7% Historical Median Sales Price $250,000 $230,000 $210,000 $190,000 $170,000 $150,000 $130,000 1-2003 1-2004 1-2005 1-2006 1-2007 1-2008 1-2009 1-2010 1-2011 1-2012 All data from NorthstarMLS. Provided by the Minneapolis Area Association of REALTORS®. Powered by 10K Research and Marketing | Sponsored by Royal Credit Union www.rcu.org | Click for Cover Page | 6
  • 7. Percent of Original List Price Received Percentage found when dividing a property’s sales price by it's original list price, then taking the average for all properties sold in a given month, not accounting for seller concessions. Current One Year February Month Activity Previous +/– 93.3% March 88.7% 94.1% - 5.7% 88.3% 90.6% April 90.1% 93.7% - 3.8% May 91.1% 94.2% - 3.3% June 91.4% 93.5% - 2.3% July 91.7% 91.9% - 0.2% August 91.2% 91.2% + 0.1% September 91.1% 90.9% + 0.3% October 91.3% 90.4% + 0.9% November 90.9% 90.0% + 1.0% December 90.6% 89.1% + 1.7% January 91.2% 88.3% + 3.4% - 5.3% + 2.5% February 90.6% 88.3% + 2.5% 2010 2011 2012 12-Month Avg 90.9% 91.8% - 1.0% Historical Percent of Original List Price Received 100% 98% 96% 94% 92% 90% 88% 86% 1-2004 1-2005 1-2006 1-2007 1-2008 1-2009 1-2010 1-2011 1-2012 All data from NorthstarMLS. Provided by the Minneapolis Area Association of REALTORS®. Powered by 10K Research and Marketing | Sponsored by Royal Credit Union www.rcu.org | Click for Cover Page | 7
  • 8. Housing Affordability Index This index measures housing affordability for the region. An index of 120 means the median household income was 120% of what is necessary to qualify for the median-priced home under prevailing interest rates. A higher number means greater affordability. Current One Year February Month Activity Previous +/– 271 March 253 216 + 17.5% 250 April 247 210 + 17.2% 222 May 242 206 + 17.6% June 234 208 + 12.1% July 237 217 + 9.1% August 246 220 + 11.7% September 249 230 + 8.5% October 249 226 + 10.5% November 259 233 + 11.1% December 264 241 + 9.4% January 268 245 + 9.5% + 12.6% + 8.3% February 271 250 + 8.3% 2010 2011 2012 12-Month Avg 251 226 + 11.2% Historical Housing Affordability Index 280 260 240 220 200 180 160 140 120 1-2004 1-2005 1-2006 1-2007 1-2008 1-2009 1-2010 1-2011 1-2012 All data from NorthstarMLS. Provided by the Minneapolis Area Association of REALTORS®. Powered by 10K Research and Marketing | Sponsored by Royal Credit Union www.rcu.org | Click for Cover Page | 8
  • 9. Months Supply of Inventory The inventory of homes for sale at the end of a given month, divided by the average monthly pending sales from the last 12 months. Current One Year February Month Activity Previous +/– 7.3 March 7.6 6.8 + 11.7% 6.2 April 8.2 7.0 + 16.4% May 8.2 7.2 + 14.3% June 8.0 7.7 + 3.9% 4.7 July 7.6 8.1 - 5.7% August 7.1 8.3 - 14.3% September 6.7 8.5 - 21.1% October 6.2 8.5 - 27.2% November 5.6 8.0 - 29.9% December 4.9 7.1 - 31.5% January 4.8 7.2 - 32.8% + 16.6% - 35.2% February 4.7 7.3 - 35.2% 2010 2011 2012 12-Month Avg 6.6 7.6 - 13.1% Historical Months Supply of Inventory 12 11 10 9 8 7 6 5 4 3 2 1-2004 1-2005 1-2006 1-2007 1-2008 1-2009 1-2010 1-2011 1-2012 All data from NorthstarMLS. Provided by the Minneapolis Area Association of REALTORS®. Powered by 10K Research and Marketing | Sponsored by Royal Credit Union www.rcu.org | Click for Cover Page | 9