Webinar: How to troubleshoot bandwidth hogs and take action.
•Transferir como PPTX, PDF•
0 gostou•69 visualizações

NetFlow Analyzer presents "How to troubleshoot bandwidth hogs and take action" in its recent webinar.

Recomendados
Recomendados
Mais conteúdo relacionado
Mais procurados
Mais procurados (20)
Semelhante a Webinar: How to troubleshoot bandwidth hogs and take action.
Semelhante a Webinar: How to troubleshoot bandwidth hogs and take action. (20)
Mais de ManageEngine, Zoho Corporation
Mais de ManageEngine, Zoho Corporation (20)
Último
Último (20)
Webinar: How to troubleshoot bandwidth hogs and take action.
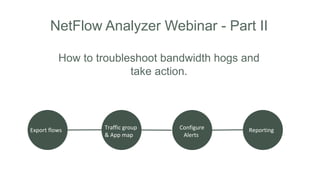
- 1. NetFlow Analyzer Webinar - Part II How to troubleshoot bandwidth hogs and take action. Export flows Traffic group & App map Configure Alerts Reporting
- 2. AGENDA • Cisco Wireless LAN Controller • Cisco Internet Protocol Service Level Agreement • Alarms & Alert Profiles • Storage Settings • Reports • High Performance • Deep Packet Inspection
- 3. CISCO WIRELESS LAN CONTROLLER
- 7. DPI Let's you have in-depth information about the URL APPLICATION SOURCE DESTINATION CONVERSATION
- 8. CISCO (IP SLA) INTERNET PROTOCOL SERVICE LEVEL AGREEMENT
- 9. CISCO IP SLA • WAN • VOIP • VIDEO
- 10. WAN LINKS • Availability • Round Trip Time • Path Hop Round Trip Time
- 11. VOIP • Availability • MOS • Jitter • Latency • Packet Loss • Call Path Availability
- 12. VIDEO • Availability • Jitter • Latency • Packet Error
- 13. ALARMS & ALERTS PROFILE
- 14. Alert Profiles Preconfigured alerts: • Link down • No flow Threshold based alerts • IP range, IP address or IP network • Based on port/protocol range • Based on application • Based on DSCP
- 15. ALARMS
- 16. STORAGE SETTINGS
- 17. STORAGE SETTINGS • RAW Data • Aggregated Data • One-Minute Data
- 18. Aggregated data Default ON Raw data Default OFF DATA STORAGE • Each and every flow received from router is stored in raw data • Storage time limit (one hour to one month) • By default one day is selected • Improve raw storage up to one year with High Perf • Narrow down to network issues faster with forensics • Stores "top 100" records for conversation by default (Up to 300 records) • Retains data forever by default • Historical reporting
- 19. RAW DATA ADVANTAGES • One-minute granularity for the most detailed traffic analysis • Improves accuracy with each and every conversation detail • Helps in better root cause analysis • Deeper insights for troubleshooting network issues with forensics reports http://blogs.manageengine.com/product-blog/netflowanalyzer/2010/01/29/data-storage-pattern-in-netflow-analyzer.html
- 20. ONE MINUTE DATA
- 21. One-Minute Traffic Data • Interface traffic graph for less than 24-hour period • Capacity planning traffic report • Compare report Raw Data • Forensics • Last 2 hour for interface snapshot report • Traffic details for App flow, Medianet, Multicast, AVC and NSEL flow (NAT). Aggregated Data • All reports in inventory & dashboard for Application, conversation and QoS For traffic report greater than 24 hours • Search and custom search report • Consolidated report • Schedule report • Report profile DATA STORAGE SUMMARY
- 22. REPORTS
- 23. REPORTS • Custom Search • Compare • Forensics • Consolidated • Ip Group & Protocol
- 24. FORENSICS • Get more granular traffic statistics using raw data • Drill down to identify which users, applications, and protocols are consuming the most bandwidth at a specific time • Troubleshoot accurately by defining multiple criteria to filter required traffic
- 25. REPORT PROFILE
- 26. HIGH PERFORMANCE
- 27. HIGH PERFORMANCE • Increased RAW Data Storage Capacity • Columnar Database • Saves Troubleshooting Time • Improved Data Compression • Insightful Report • Better Bandwidth Management
- 29. SUMMARY We had a quick overview on monitoring – Cisco Wireless Lan Controller – DPI – Monitoring WAN, VOIP & Video Links – Notification – Storage Types - Reports - High Performance
- 30. NEED MORE HELP ? youtube.com/opmanagertechvideos help.netflowanalyzer.com forums.manageengine.com/netflowanalyzer netflowanalyzer-support@manageengine.com +1 (888) 720-9500 / +1 (408) 916 - 9595
- 31. THANK YOU ! Evaluator or Trial User eval-itom@manageengine.com Licensed Customer netflowanalyzer-support@manageengine.com