New Magnitude Conversions for Turkey
•
1 gostou•181 visualizações

Türkiye'de Veri Düzensizliğini Azaltmak İçin Mağnitüde Dönüşümleri Çalışmaları Önemli!

Recomendados
Recomendados
Mais conteúdo relacionado
Mais procurados
Mais procurados (20)
Semelhante a New Magnitude Conversions for Turkey
Semelhante a New Magnitude Conversions for Turkey (20)
Mais de Ali Osman Öncel
Mais de Ali Osman Öncel (20)
Último
Último (20)
New Magnitude Conversions for Turkey
- 1. 300 http://journals.tubitak.gov.tr/earth/ Turkish Journal of Earth Sciences Turkish J Earth Sci (2016) 25: 300-310 © TÜBİTAK doi:10.3906/yer-1511-7 The new empirical magnitude conversion relations using an improved earthquake catalogue for Turkey and its near vicinity (1900–2012) Filiz Tuba KADİRİOĞLU*, Recai Feyiz KARTAL Earthquake Department, Prime Ministry Disaster and Emergency Management Authority, Ankara, Turkey * Correspondence: filiztuba.kadirioglu@afad.gov.tr 1. Introduction One of the important parameters of the earthquake phenomenon is earthquake magnitude. In seismology, the magnitude term expresses the energy released during the rupture process. Occurrence of an earthquake consists of a wide range of physical parameters, such as rupture length, rupture area, surface displacement, particle velocity, ground acceleration, and released seismic energy. Although the size of an earthquake can be determined with a simple instrumental measurement in a short time, it is not possible to rapidly estimate these parameters. Earthquake magnitudes, which are simple empirical parameters, may not be directly relevant to the physical parameters of the earthquake source. On the other hand, rapid computations used in engineering studies are important for earthquake catalogues (Kanamori, 1983; Bormann, 2002). The most common empirical parameters used to express earthquake magnitude are ML (local magnitude/Richter magnitude), Md (duration/coda magnitude), MS (surface wave magnitude),mb /mB (bodywavemagnitude,wheremb refers to the short period and mB refers to the long period), and MW (moment magnitude). MW is particularly preferred for major earthquakes in recent years (McCalpin, 2012). The first magnitude type, ML (local magnitude), was identified for local events in South California by Woods Anderson in torsion seismographs (Richter, 1935). Later on, MS and mb magnitudes were generated (Gutenberg, 1945a, 1945b, 1945c) and harmonized with the Richter magnitude scale. MW (seismic moment/moment magnitude), which is widely used in recent years, is not only an instrumental parameter but is also associated with certain other physical parameters (such as slip rate) related to the earthquake source fault. Different magnitude scales are computed by different formulas and they have varied saturation conditions. Selection of the magnitude type also depends on the earthquake size. For instance, while Md (duration/coda) magnitude has been generally utilized for small and local events (for M ≤ 3.0), mb and MS have been used for major earthquakes (especially in teleseismic events) in any depth. Mw is recognized as the most credible parameter in seismology, and it is not saturated. In addition, wave Abstract: Empirical magnitude conversion relationships are one of the important parameters for not only seismological studies but also seismic hazard analysis and development of the attenuation relationships. Particularly, for seismic hazard analysis, conversion of various types of magnitudes to moment magnitude, which is the most reliable and common magnitude scale, is a key requirement. Within this scope, different magnitude conversion equations have been derived by various researchers in the literature. In this study, new empirical magnitude conversion formulas for conversion from mb , ML , Md , and MS to Mw were derived by using a recently established earthquake catalogue. The most important feature of the new relationships is the use of the maximum data with respect to the literature. It is a well- known fact that having a greater number of data increases the sensitivity of the equations derived. Both orthogonal regression (OR) and ordinary least squares (OLS) were used to derive conversion equations, and the results obtained from these two methods were compared. In the derivation, 489 events with magnitudes in Mw scale taken from the Harvard GCMT Catalogue were used. Residual graphs created for both methods showed that the OR method gives better results than OLS for conversion from MS to Mw . On the other hand, the OLS method showed preferable performance for conversions from mb , ML , and Md to Mw . The equations proposed in this study were also compared with other empirical relations in the literature. Key words: Moment magnitude, earthquake catalogue, orthogonal regression, ordinary least squares, empirical relations, magnitude scales Received: 13.11.2015 Accepted/Published Online: 30.03.2016 Final Version: 09.06.2016 Research Article
- 2. 301 KADİRİOĞLU and KARTAL / Turkish J Earth Sci frequency range used for calculation of magnitude differs with magnitude scales. These frequencies are determined as mb : ~1 s, mB : ~0.5–12 s, ML : ~0.1–3 s, MS : ~20 s, and Mw : ~10 → ∞ s in various studies (Kanamori, 1983). Many scientists have investigated the relationship between the above-mentioned empirical parameters using different methods, and several magnitude conversion relations have been derived to date. These empirical conversion relations provide homogeneity of the earthquake catalogue in terms of unified scale. For instance, different conversion relationships have been developed on a regional scale with different methods by Gutenberg and Richter (1956a, 1956b), Kanamori (1983), Ambraseys (1990), Papescu et al. (2003), Ulusay et al. (2004), Deniz (2006), Scordilis (2006), Kalafat et al. (2007), Grünthal (2009), Akkar et al. (2010), Das (2011), Çıvgın (2015), and Bayrak et al. (2005, 2009). On the other hand, various regression analyses have been performed for local scale by using different methods and databases. For instance, Köseoğlu et al. (2014) performed determination of spectral moment magnitude for the Marmara Region between 2006 and 2009 with magnitude 2.5 ≤ M ≤ 5.0 by using differences between observed and synthetic source spectra calculated from S waves. As seen in the literature, the most common methods used to derive these relationships are ordinary least squares (OLS), orthogonal regression (OR), and maximum likelihood. Although each method has advantages and disadvantages as compared to the others, comparison of the residual graphs shows that different methods provide more reliable results for different magnitude scales. In this paper, we derive a new empirical magnitude conversion relationship using an improved earthquake catalogue for Turkey and its near vicinity (Kadirioğlu et al., 2014). The improved earthquake catalogue covers the area bounded by 32°N and 45°N and by 23°E and 48°E, and it includes 12,674 events that occurred from 1900 to 2012. This catalogue comprises events reported in different magnitude scales (i.e. MS , mb , ML , Mw , and Md ) from various catalogues. The magnitude range of the proposed catalogue varies between 4.0 and 7.9. For the regression analysis, an integrated database including approximately 37,000 earthquake parameters from Kadirioğlu et al. (2014) was prepared. From this integrated database, 489 events with magnitudes given in MW scale were selected. Among them, magnitudes in mb , ML , MS , and Md scales were also determined for 488, 404, 462, and 208 events, respectively. Both OR and OLS methods were applied to derive conversion equations. In such a study, there are some uncertainties concerning the integrated catalogue. The most significant concern is the diversity in magnitude types and values. This may originate due to the operator calculating the earthquake parameters, the choice of the crustal model, or the use of various magnitude computing equations. For instance, in this study, for each event with Mw magnitude, all other magnitude types (i.e. MS , mb , Md , and ML ) are not provided in the integrated database. This situation can be identified as the epistemic uncertainty of the catalogue. In this study, a new empirical relationship was developed and compared with the other empirical relations in the literature. These relationships are used in the “Updating of Turkey Seismic Hazard Map Project” supported by the National Earthquake Research Program of the Disaster and Emergency Management Authority (Turkish acronym: AFAD). 2. Dataset In this study, the catalogue and integrated database of Kadirioğlu et al. (2014) that enable the creation of this catalogue were utilized. The catalogue contains 12,674 events with magnitudes M ≥ 4.0 that occurred in Turkey andsurroundingregionsbetween1900and2012(Figure1). Distribution of these earthquakes with respect to different magnitude types is given in Table 1. When selecting the earthquakes for the catalogue, the catalogues of ISC, EHB, EMSC, Harvard GCMT (Ekström et al., 2012), Alsan et al. (1975), Ayhan et al. (1981), Ambraseys and Finkel (1987), Ambraseys and Jackson (1998) Gutenberg and Richter (1954), Kalafat et al. (2011) and the AFAD Earthquake Department were primarily assessed with respect to the specific criteria. It should be noted that magnitudes in this catalogue are observed values, and any magnitude derived from empirical conversion equations is not taken into consideration in the catalogue. The most important part of this and similar studies is the homogeneous catalogue that is used as a database for conversion. In this context, the integrated database used in this study was made homogeneous for the regression analysis with the following stages. Table 2 refers to an example of the integrated database. In this study, one of the major hurdles we faced was the regression analysis, such that different magnitudes were assigned by different agencies for the same event. The earthquake that occurred on 30 July 2009 at 0737 hours is a good example for this situation (Table 2). The magnitude of this earthquake is given as Ms = 4.8 and mb = 4.7 by EMSC, MW = 5.0 by HRVD, and ML = 4.8 in the DDA and the ISC catalogues. In addition, mb = 4.9 reported by the DJA agency was used in the ISC catalogue. The other difficulty concerning the integrated database is the significant difference between magnitudes for the same earthquake. Table 3 shows the parameters of the earthquake that occurred on 7 July 2009 at 0102 hours. For instance, Md and ML values provided by the NSSC agency are significantly lower than the values reported for other agencies. The integrated database was examined in order to eliminate these types of problems, and it was sorted out with regard to one type of magnitude
- 3. 302 KADİRİOĞLU and KARTAL / Turkish J Earth Sci (MS , mb , Md , ML , and MW ) for each event and made functional for this study. Thus, a homogeneous catalogue was created for the regression analysis. During this process, the following steps were taken: - If the same earthquake information was obtained from both the EMSC and ISC catalogues, the EMSC catalogue was taken into account and the corresponding information was deleted from the ISC catalogue. - Repeated information on the ISC list was deleted. - Contrary data (too small or greater values than the overall average) in the integrated database (like Table 3) were determined as outliers with the “expert opinion” method (Sims et al., 2008). - Since the catalogue of Kalafat et al. (2011) includes magnitudes derived with various magnitude conversion relationships, it was included in the evaluation after 2011. - Before taking the average of the magnitude values given for the same earthquake by different agencies in terms of same magnitude type (i.e. MS , mb , Md , and ML ), upper and lower limits were specified with the method of “interquartile ranges and outliers”. - The outliers method was not applied for earthquakes with less than 3 data and the average value was directly calculated. - All steps in this process were separately performed for each magnitude scale (MS , mb , Md , ML ). After the above-mentioned adjustments, we noticed that MS , mb , Md , and ML magnitudes were not complete for each Mw value (Table 4). For regression, only one reference (Harvard GCMT Catalogue) is used for Mw . Therefore, as we mentioned in Section 1, this situation can be explained as the epistemic uncertainty of the catalogue. Figure 1. Seismicity map of Turkey and near surroundings between 1900 and 2012 (M ≥ 4.0). Table 1. Number of earthquakes in different magnitude types in the catalogue of Kadirioğlu et al. (2014). Magnitude type Number of earthquakes Mw 489 MS 2365 mb 8390 Md 212 ML 1218 Total 12,674
- 4. 303 KADİRİOĞLU and KARTAL / Turkish J Earth Sci As a result, for the regression analysis, 462 Mw –MS pairs, 488 Mw –mb pairs, 404 Mw –ML pairs, and 208 Mw –Md pairs were determined. 3. Methodology In this study, magnitude conversion relationships were derived based on both OLS and OR methods via MATLAB software (Gilat, 2004). Standard error and regression residual parameters were calculated with the bootstrap method (Chernick, 1999) by means of both Excel and SPSS software (Argyrous, 2011). Residual graphs created for each magnitude type were assessed separately. As a result of the evaluation, negligible bias was observed in the formula derived by OR. This method is found more proper for the regression analysis of MS to Mw conversion equation according to residuals. Although the OR method was also Table 2. An example from the integrated database (30 July 2009 earthquake) (abbreviations: Ref., reference; Mo., month; Yr., year; Hr., hour; Mn., minute; Sec., second; Lat., latitude; Lon., longitude; D., depth). Ref. Day Mo. Yr. Hr. Mn. Sec. Lat. N Lon. E D. (km) MS mb Md ML MW EMSC 30 07 2009 07 37 51.00 39.6700 39.8000 2.0 4.2 4.7 - - 5.0 HRVD 30 07 2009 07 37 54.00 39.5900 39.6800 12 5.0 4.8 - - 5.0 DDA 30 07 2009 07 37 50.20 39.5905 39.7245 12 - - - 4.8 - KLT 30 07 2009 07 37 50.10 39.6100 39.7600 10.9 5.0 4.8 4.7 5.0 5.0 ISC 30 07 2009 07 37 52.84 39.5854 39.7483 3.0 4.2 4.8 - - - DDA* - - - - - - - - - - - - 4.8 - ISCJB* - - - - - - - - - 4.3 4.7 - - - EMSC* - - - - - - - - - 4.2 4.7 - - - NEIC* - - - - - - - - - - 4.8 - - - DJA* - - - - - - - - - - 4.9 - - 4.8 MOS* - - - - - - - - - - 5.0 - - - HRVD* - - - - - - - - - - - - - 5.0 DJA* - - - - - - - - - - 4.9 - - - *Agency magnitude information taken from the ISC (International Seismological Centre). Reference codes: EMSC, European- Mediterranean Seismological Centre, France; HRVD, Harvard Global Centroid Moment Tensor Catalogue, USA; DDA: AFAD, Disaster and Emergency Management Authority, Earthquake Department, Turkey; ISC - ISCJB: International Seismological Centre, United Kingdom; NEIC: National Earthquake Information Centre, USA; DJA: Badan Meteorologi, Klimatologi dan Geofisika, Indonesia; MOS: Geophysical Survey of Russian Academy of Sciences, Russia; KLT: Kalafat et al. (2011). Table 3. An example from the integrated database (7 July 2009 earthquake). Ref. Day Mo. Yr. Hr. Mn. Sec. Lat. N Lon. E D. (km) MS mb Md ML MW EMSC 07 07 2009 01 02 48.00 34.0100 25.6200 20.0 4.0 4.8 - - 4.1 DDA 07 07 2009 01 02 42.11 33.6446 25.3151 10.9 - - 4.0 - - KLT 07 07 2009 01 02 48.00 34.1600 25.5100 25.0 4.4 4.8 4.8 5.2 5.0 ISC 07 07 2009 01 02 48.14 34.0843 25.5865 17.8 4.2 4.8 - - - ISCJB* - - - - - - - - - 4.2 4.7 - - - MOS* - - - - - - - - - 4.1 4.9 - - - NEIC* - - - - - - - - - - 4.8 - - - NSSC* - - - - - - - - - - - 2.6 3.7 - *Agency magnitude information taken from the ISC catalogue. Reference code: NSSC, National Syrian Seismological Centre, Syria.
- 5. 304 KADİRİOĞLU and KARTAL / Turkish J Earth Sci Table 4. Other scale magnitudes corresponding to observed MW . Day Mo. Yr. Hr. Mn. Sec. Lat. N Lon. E D. (km) MW MS mb Md ML 19 02 1989 14 28 46 36.9809 28.1987 00.9 5.4 4.7 4.8 4.5 4.9 27 08 1989 01 21 16 34.8165 26.2457 51.00 5.6 4.8 5.3 4.7 4.7 11 03 1991 18 33 43 37.0066 30.9635 113.00 5.1 - 5.3 4.9 - 05 12 1991 20 21 55 36.1265 31.7941 112.00 5.2 - 5.3 - - 30 07 2005 21 45 02 39.4128 33.0975 15.70 5.2 4.8 4.8 4.9 4.5 01 08 2005 13 34 59 36.5232 26.8008 147.80 4.8 - 4.9 4.5 4.7 3 4 5 6 7 8 3 4 5 6 7 8 MW(obs) Md OR OLS (b) ∶ = 0.9510 + 0.5862 OLS : = . + . 3 4 5 6 7 8 3 4 5 6 7 8 MW(obs) mb OR OLS (c) : = 1.2093 − 0.8860 OLS : = . + . 3 4 5 6 7 8 3 4 5 6 7 8 MW(obs) MS OR OLS (a) : = . + . ≤ . = 0.7905 + 1.3044 ≥ 5.5 = . + . ≥ . OLS : = 0.6524 + 2.1199 ≤ 5.4 3 4 5 6 7 8 3 4 5 6 7 8 MW(obs) ML OR OLS (d) : = 1.0292 + 0.2269 OLS : = . + . Figure 2. Comparison of orthogonal regression (OR) and ordinary least squares (OLS) correlation plots for a) MS vs. MW , b) Md vs. MW ,c) mb vs. Mw , and d) ML vs. MW .Bolded formulas indicate proposed equations in this study.
- 6. 305 KADİRİOĞLU and KARTAL / Turkish J Earth Sci used for derivation of the other magnitude conversion equations (mb , ML , and Md to Mw ), the OLS method was preferred due to the significant bias. According to the comparison of OR and OLS methods, the correlation plots demonstrate more or less the same results for the MW and MS relationship. On the other hand, appreciable dissimilarity could be observed for other relationships (mb vs. MW , Md vs. MW , ML vs. MW ) (Figures 2a–2d). 3.1. Orthogonal regression OR is a standard linear regression method that has been used to correct the effects of measurement errors in estimation (Carroll and Ruppert, 1996). OR takes the error rates of dependent and independent variables into account. For this reason, it is considered to provide more reliable results. However, to obtain the most accurate results the eta (η) parameter, which indicates the error ratio between the dependent and independent variables, must be determined accurately. Especially in seismology, it is not possible to determine the error ratio between the –1.20 –0.90 –0.60 –0.30 0.00 0.30 0.60 0.90 1.20 3.0 4.0 5.0 6.0 7.0 Mw(obs)–Mw(est) mb (a) –1.20 –0.90 –0.60 –0.30 0.00 0.30 0.60 0.90 1.20 3.0 4.0 5.0 6.0 7.0 Mw(obs)–Mw(est) ML (b) –1.20 –0.90 –0.60 –0.30 0.00 0.30 0.60 0.90 1.20 3.0 4.0 5.0 6.0 7.0 8.0 Mw(obs)–Mw(est) Md (c) Figure 3. Residual graphs of magnitudes that were calculated by OR: (a) mb to Mw , (b) ML to Mw , (c) Md to Mw . The graphs show significant bias in the linear trend. At this stage, it is clear that the OR has not performed well for mb , ML , and Md to Mw conversion. Abbreviations: Mw (obs) , Mw observed; Mw (est) , Mw estimated . 3.0 4.0 5.0 6.0 7.0 8.0 3.0 4.0 5.0 6.0 7.0 8.0 Mw (OR) Ms All Data OR Figure 4. Plots of OR relations for MS to Mw (OR). –1.2 –0.9 –0.6 –0.3 0.0 0.3 0.6 0.9 1.2 3.0 4.0 5.0 6.0 7.0 8.0 Mw(obs)–Mw(est) MS Figure 5. According to OR method, residual graph for all data.
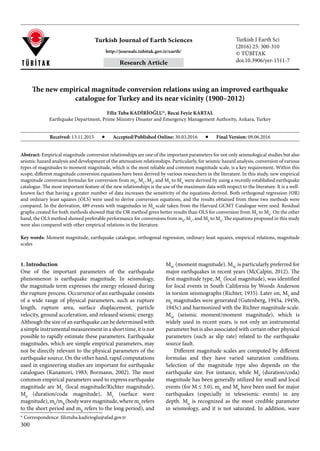
- 7. 306 KADİRİOĞLU and KARTAL / Turkish J Earth Sci magnitude types in the earthquake catalogues used for regression analysis because the earthquake magnitudes determined by different agencies have been affected by uncertainties from various seismic instruments, crustal methods, and several conversion relations. In addition, both dependent and independent variables contain a number of internal errors. For these reasons, the error ratio has not been calculated separately for each magnitude type, and in this study eta (η) was accepted as 1 for the OR method. In other words, it was considered that the error margin was equal in both variables. The formulas used for calculations are shown below. They were derived with the OR method and applied by MATLAB. 4 ( ) ( ) 2 ( ) ( ) sxy yy Y Y b Y sxx X X s sxy syy sxx syy sxx a b X 1 1 i n i n i mean i mean mean mean 2 2 2 2 h h h = - = - = - + - + = - R R = = (1) X : Magnitudes that will be converted (mb , ML , Md , MS ), Y : Observed Mw, Xmean : The average of the magnitudes that will be converted, Ymean : The average of the observed Mw . In the residual graphs, corresponding to linear mb , ML , and Md to Mw conversion relations obtained by OR, a significant slope was observed. This indicates a bias against conservative or nonconservative values for the above- mentioned magnitude calculations (Figures 3a–3c). On the other hand, the OR conversion method was applied for MS magnitude. The formulas, standard errors, and residual scatters obtained from OR for MS to Mw conversion are given below. When Figure 4 is examined, it is observed that the general trend deviates at Ms = 5.4. Therefore, bilinear relations were implemented for data for MS to Mw conversion. In the residual graphs, there is almost no bias both for all data and data with Ms ≥ 4.0 (Figures 5 and 6). Mw = 0.5716 (±0.024927) MS + 2.4980 (±0.117197) 3.4 ≤ MS ≤ 5.4 (2a) Mw = 0.8126 (±0.034602) MS + 1.1723 (±0.208173) MS ≥ 5.5 (2b) The empirical conversion relationship for MS to Mw derived with OR was compared with previously developed relations, and fairly compatible results were obtained (Figure 7). 3.2. Ordinary least squares AlthoughOLSisafrequentlyusedsimplemethodinempirical conversions, it is a method basically used to create a linear function between two dependent and independent variables. This method has some limitations, both mathematically and statistically. The most important limitation is that the dependent variable (Y) must be known with much more accuracy than the independent variable (x). Both dependent and independent variables are affected by uncertainty in the Y = ax + b equation (Castellaro et al., 2006). In this study, while MS , mb , Md , and ML magnitudes express independent variables (x), Mw magnitude represents the dependent variable (Y). According to regression analysis, the results obtained from OLS are much better than those of OR for mb , Md , and ML to Mw conversion. In the residual graphs, the trend line between the conservative and nonconservative values did not have a significant slope (Figure 8a–8c). New empirical equations obtained from OLS and their standard errors are presented below. Mw = 1.0319 (±0.025) mb + 0.0223 (±0.130) 3.9 ≤ mb ≤ 6.8 (3a) Mw = 0.7947 (±0.033) Md + 1.3420 (±0.163) 3.5 ≤ Md ≤ 7.4 (3b) Mw = 0.8095 (±0.031) ML + 1.3003 (±0.154) 3.3 ≤ ML ≤ 6.6 (3c) –1.2 –0.9 –0.6 –0.3 0.0 0.3 0.6 0.9 1.2 3.0 4.0 5.0 6.0 7.0 8.0 Mw(obs)–Mw(est) MS Figure 6. According to OR method, residual graph for MS ≥ 4.0. 3.0 4.0 5.0 6.0 7.0 8.0 3.0 4.0 5.0 6.0 7.0 8.0 Mw MS All Data Scordilis (2006) Ulusay et al. (2004) Akkar et al. (2010) Grünthal et al. (2009) This Study (OR) Figure 7. Comparison of empirical equations with literature for magnitude conversion (Ms to Mw ).
- 8. 307 KADİRİOĞLU and KARTAL / Turkish J Earth Sci Similarly, new empirical relationships were compared with other relations in the literature. According to this comparison,itwasobservedthatthenewrelationsbetween mb and Mw obtained from OLS were similar to the results of Kalafat et al. (2011). However, the relations proposed by Ulusay et al. (2004) indicated appreciable differences. As seen in Figure 9a, Ulusay et al. (2004) overestimated MW values for mb ≥ 5.0. On the other hand, although this study and that of Ulusay et al. (2004) provide similarly higher MW estimations for ML to Mw conversion, there were highly different results when compared with those of Grünthal et al. (2009) and Zaré and Bard (2002). They underestimate MW values when compared to our results. This study almost intersects with the results of Akkar et al. (2010) for ML ≥ 6.0 (Figure 9b). The same comparison was performed for Md to Mw conversion relations and new empirical relations demonstrate results that are reasonably compatible with those of Akkar et al. (2010) and Ulusay et al. (2004). Moreover, this study overestimates MW values for Md between 3.5 and 6.0 compared to the literature (Figure 9c). 4. Discussion New empirical equations are one of the important outputs of the Updating Seismic Hazard Map of Turkey project supported by the National Earthquake Research Program Figure 8. Obtained formulas and residual graphs for OLS (a-1, a-2 for mb to Mw ; b-1, b-2 for ML to Mw ; c-1, c-2 for Md to Mw conversions). Mw = 1.0319 mb + 0.0223 R² = 0.7734 3.5 4.5 5.5 6.5 7.5 8.5 3.5 4.5 5.5 6.5 7.5 Mw mb (a –1) –1.20 –0.90 –0.60 –0.30 0.00 0.30 0.60 0.90 1.20 3.5 4.0 4.5 5.0 5.5 6.0 6.5 7.0 Mw(obs)–Mw(est) mb (a–2) Mw = 0.8095 ML + 1.3003 R² = 0.6244 3.5 4.0 4.5 5.0 5.5 6.0 6.5 7.0 7.5 8.0 3.0 3.5 4.0 4.5 5.0 5.5 6.0 6.5 7.0 Mw ML (b–1) –1.20 –0.90 –0.60 –0.30 0.00 0.30 0.60 0.90 1.20 3.0 3.5 4.0 4.5 5.0 5.5 6.0 6.5 7.0 Mw(obs)–Mw(est) ML (b–2) Mw = 0.7947 Md + 1.342 R² = 0.7329 3.5 4.5 5.5 6.5 7.5 8.5 3.0 4.0 5.0 6.0 7.0 8.0 Mw Md (c–1) –1.2 –0.9 –0.6 –0.3 0.0 0.3 0.6 0.9 1.2 3.0 4.0 5.0 6.0 7.0 8.0 Mw(obs)–Mw(est) Md (c–2)
- 9. 308 KADİRİOĞLU and KARTAL / Turkish J Earth Sci of AFAD. In this study, we aimed to derive conversion relations from the selected magnitude types (such as MS , mb , ML , and Md ) to moment magnitude (MW ). The homogeneous catalogue used in this study includes the earthquakes with magnitudes greater than 4.0 that occurred in the region bounded by 32.00°N and 45.00°N and by 23.00°E and 48.00°E. Within the scope of this, 489 earthquakes with Mw values obtained from the Harvard GCMT Catalogue were taken into consideration. Among these earthquakes, 462 events (between 1900 and 1982) had MS values, 488 events (between 1964 and 2012) had mb values, 404 events (between 1972 and 2012) had ML values, and 208 (between 1988 and 2009) had Md values. For the regression analysis, both OR and OLS methods were used in this study. As we mentioned above, eta (η) was accepted as 1 for the OR method, as the error ratio could not be calculated separately for each magnitude type in the catalogue (Eq. (1)). In the residual scatters for MS to MW conversions obtained from OR, almost no bias both for the complete data and for MS ≥ 4.0 was observed. Therefore, OR was determined as the suitable method for MS to MW conversion (Eqs. (2a) and (2b)). On the other hand, stronger physical correlation was 3.0 4.0 5.0 6.0 7.0 8.0 3.0 4.0 5.0 6.0 7.0 Mw ML All Data Grünthal et al. (2009) Akkar et al. (2010) Ulusay et al. (2004) Zare and Bard (2002) This Study (OLS) (b) 3.0 4.0 5.0 6.0 7.0 8.0 3.0 4.0 5.0 6.0 7.0 8.0 Mw Md All Data Akkar et al. (2010) Ulusay et al. (2004) This Study (OLS) (c) 3.5 4.5 5.5 6.5 7.5 8.5 3.5 4.5 5.5 6.5 7.5 Mw mb All Data Scordilis (2006) Grünthal et al. (2009) Kalafat et al. (2011) Akkar et al. (2010) Ulusay et al. (2004) This Study (OLS) (a) Figure 9. Comparison of empirical equations with literature for magnitude conversion: (a) mb to Mw , (b) ML to Mw , (c) Md to Mw . 3 4 5 6 7 8 3 4 5 6 7 8 HarvardGCMTMW ISC MS R = 0.91 Depth < 10 (76 events) Depth = 10 (fixed) (70 events) 10 < Depth ≤ 30 (199 events) 30 < Depth ≤ 200 (125 events) Figure 10. Comparison between ISC MS and MW from HRVD GCMT
- 10. 309 KADİRİOĞLU and KARTAL / Turkish J Earth Sci observed between ISC MS and MW from HRVD GCMT. When it is considered that both magnitudes are measured in the long period, this is the expected result (Granville et al., 2005). Particularly, MS scales had good fit with MW ≥ 5.8 (Figure 10). As opposed to this, residual graphs for mb , ML , and Md to MW conversions performed by OR indicated a significant slope in linear trend between the conservative and nonconservative values. For this reason, the OR method was not approved for the conversion of the mentioned magnitudes to MW . Therefore, the OLS method was applied for mb , ML , and Md to MW conversions, and in the trend line of residual graphs there was no significant slope (Eqs. (3a), (3b), and (3c)). New empirical relationships that were derived by both OR and OLS gave compatible results with data set used. The relations used in this study were compared with the literature and generally consistent results were obtained for both MS to Mw and mb , ML , and Md to Mw conversions. On the other hand, this study and that of Ulusay et al. (2004) indicate similarly higher estimations of MW values for ML than other studies and overestimate MW values for Md between 3.5 and 6.0. Acknowledgments This research is the mid-product of the “Updating of Seismic Hazard Map of Turkey” project supported by the National Earthquake Research Program and conducted by the Kandilli Observatory and Earthquake Research Institution (KRDEA), General Directorate of Mineral Research and Exploration (MTA), Prime Ministry Disaster and Emergency Management Authority (AFAD), Çukurova University, and Sakarya University. The authors would like to thank Prof Dr Semih Yücemen, Prof Dr Ayşen Akkaya, Research Assistant Sibel Balcı, Prof Dr Sinan Akkar, and Assoc Prof Dr Mehmet Yılmaz for their time and valuable advice. References Akkar S, Çağnan Z, Yenier E, Erdoğan Ö, Sandıkkaya MA, Gülkan P (2010). The recently compiled Turkish strong motion database: preliminary investigation for seismological parameters. J Seismol 14: 457-479. Alsan E, Tezuçan L, Bath M (1975). An Earthquake Catalogue for Turkey for the Interval 1913-1970 Report No 7-75. İstanbul, Turkey: Kandilli Observatory Seismological Department. Ambraseys NN, Finkel CF (1987). Seismicity of Turkey and neighbouring regions, 1899-1915. Ann Geophys 5B: 701-726. Ambraseys NN, Jackson JA (1990). Seismicity and associated strain of central Greece between 1890-1988. Geophys J Int 101: 663- 708. Ambraseys NN, Jackson JA (1998). Faulting associated with historical and recent earthquakes in the Eastern Mediterranean region. Geophys J Int 133: 390-406. Argyrous G (2011). Statistics for Research: With a Guide to SPSS. London, UK: SAGE. Ayhan E, Alsan E, Sancaklı N, Üçer SB (1981). Türkiye ve Dolayları Deprem Kataloğu 1881-1980. İstanbul, Turkey: Boğaziçi Üniversitesi Yayınları (in Turkish). Bayrak Y, Öztürk S, Çınar H, Kalafat D, Tsapanos MT, Koravas GC, Leventakis GA (2009). Estimating earthquake hazard parameters from instrumental data for different regions in and around Turkey. Eng Geol 105: 200-210. Bayrak Y, Yılmaztürk A, Öztürk S (2005). Relationships between fundamental seismic hazard parameters for the different source regions in Turkey. Nat Hazards 36: 445-462. Bormann P (2002). Magnitude of seismic events. In: Bormann P, editor. New Manual of Seismological Observatory Practice, Vol. 1. Potsdam, Germany: GFZ German Research Centre for Geosciences, pp. 16-50. Carroll RI, Ruppert D (1996). The use and misuse of orthogonal regression in linear errors-in-variables models. Am Stat 50: 1-6. Castellaro S, Mulargia F, Kagan YY (2006). Regression problems for magnitudes. Geophys J Int 165: 913-930. Chernick MR (1999). Bootstrap Methods: A Guide for Practitioners and Researchers. 1st ed. New York, NY, USA: Wiley. Çıvgın B (2015). Regression relations for conversion of various magnitude types and catalogs for the earthquakes of Turkey and vicinity. Seismol Res Lett 86: 876-889. Das R, Wason HR, Sharma ML (2011). Global regression relations for conversion of surface wave and body wave magnitudes to moment magnitude. Nat Hazards 59: 801-810. Deniz A (2006). Estimation of earthquake insurance premium rates based on stochastic methods. MSc, Middle East Technical University, Ankara, Turkey. Ekström G, Nettles M, Dziewonski AM (2012). The global CMT project 2004-2010: Centroid-moment tensors for 13,017 earthquakes. Phys Earth Planet In 200-201: 1-9. Gilat A, editor (2004). MATLAB: An Introduction with Applications. 2nd ed. New York, NY, USA: John Wiley & Sons. Granville JP, Richards PG, Kim WY, Sykes LR (2005). Understanding the differences between three teleseismic mb scales. B Seismol Soc Am 95: 1809-1824. Grünthal G, Wahlstrom R, Stromeyer D (2009). The unified catalogue of earthquakes in central, northern, and northwestern (CENEC) - updated and expanded to the last millennium. J Seismol 13: 517-541. Gutenberg B (1945a). Amplitudes of P, PP and S and magnitudes of shallow earthquakes. B Seismol Soc Am 35: 57-69.
- 11. 310 KADİRİOĞLU and KARTAL / Turkish J Earth Sci Gutenberg B (1945b). Amplitudes of surface waves and magnitudes of shallow earthquakes. B Seismol Soc Am 35: 3-12. Gutenberg B (1945c). Magnitude determination for deep-focus earthquakes. B Seismol Soc Am 35: 117-130. Gutenberg B, Richter CF (1954). Seismicity of the Earth and Associated Phenomena. 2nd ed. Princeton, NJ, USA: Princeton University Press. GutenbergB,RichterCF(1956a).Magnitudeandenergyearthquakes. Ann Geophys 9: 1-15. Gutenberg B, Richter CF (1956b). Earthquake magnitude, intensity, energy, and acceleration (second paper). B Seismol Soc Am 46: 105-145. Kadirioğlu FT, Kartal RF, Kılıç T, Kalafat D, Duman TY, Özalp S, Emre Ö (2014). An improved earthquake catalogue (M ≥ 4.0) for Turkey and near surrounding (1900-2012). In: 2nd European Conference on Earthquake Engineering and Seismology Proceedings, pp. 411-422. Kalafat D, Güneş Y, Kara M, Deniz P, Kekovalı K, Kuleli HS, Gülen L, Yılmazer M, Özel NM (2007). A Revised and Extended Earthquake Catalogue for Turkey Since 1900 (Mw ≥ 4.0). İstanbul, Turkey: Boğaziçi University. Kalafat D, Güneş Y, Kekovalı K, Kara M, Deniz P, Yılmazer M (2011). Bütünleştirilmiş Homojen Türkiye Deprem Kataloğu (1900-2010; M ≥ 4.0). İstanbul, Turkey: Boğaziçi Üniversitesi, Kandilli Rasathanesi ve Deprem Araştırma Enstitüsü. Kanamori H (1983). Magnitude scale and quantification of earthquakes. Tectonophysics 93: 185-199. Köseoğlu A, Özel NM, Barış Ş, Üçer SB, Ottemöller L (2014). Spectral determination of source parameters in the Marmara Region. J Seismol 18: 651-669. McCalpin PJ (2012). Earthquake magnitude scales, appendix 1. In: McCalpin PJ, editor. Paleoseismology. Burlington, MA, USA: Academic Press, pp. A1-A3. Richter CF (1935). An instrumental earthquake magnitude scale. B Seismol Soc Am 25: 1-32. Scordilis EM (2006). Empirical global relations converting Ms and mb to moment magnitude. J Seismol 10: 225-236. Sims BH, Wiedlea KA, Wilson GD (2008). Expert opinion in reliability. In: Ruggeri F, editor. Encyclopedia of Statistics in Quality and Reliability. New York, NY, USA: Wiley. Ulusay R, Tuncay E, Sönmez H, Gökçeoğlu C (2004). An attenuation relationship based on Turkish strong motion data and iso- acceleration map of Turkey. Eng Geol 74: 265-291. Zaré M, Bard PY (2002). Strong motion dataset of Turkey: data processing and site classification. Soil Dyn Earthq Eng 22: 703- 718.