Government finances and banks
Irish state's funding outlook clearer
than it was six months ago.
Irish state's funding 85% complete for 2009; net debt has to be the focus in future years thanks to NAMA
• The Irish state has already met 85% of its long-term debt issuance targeted for 2009. That compares with a euro area average of about 60% year-to-date.
• General government debt will of course spike when NAMA is set up, but that will no longer be a meaningful metric. NAMA will contain billions in written-down assets to offset against the government paper issued to the banks. Net debt will rise only to the extent that NAMA fails to realise value over time. Initial banking re-cap burden for the state is lower than many believe as government is no longer the only capital provider
• We estimate that initial re-cap costs for the Irish banking system will amount to €19bn. Net of 'self help' measures, in particular debt buybacks, the government may need to contribute €14.6bn, of which it has already
accounted for €11bn.
• However, if Allied Irish Banks and Bank of Ireland can raise equity from their shareholders or through disposals (e.g. Poland), the ultimate figure will be lower than this. NAMA RWA relief is often overlooked too, although this benefit is illusory as state may have to fund a 'second loss'
• Moving €80bn of loans across to NAMA at a 20% haircut provides a significant risk-weighted asset (RWA) benefit for the banks, which also reduces the initial recap burden on the state.
• However, this 'saving' is offset by an unrealised loss sitting in NAMA of at least €4bn and probably much more. Whether the state has to fund this is dependent on how aggressively NAMA works out its positions, market conditions and the timing/magnitude of any future levy on the banks.
VIP Kalyan Call Girls 🌐 9920725232 🌐 Make Your Dreams Come True With Mumbai E...
Irish State Finances and Funding Clearer then 6 months ago
1. www.davy.ie
Bloomberg: DAVY<GO>
Research: +353 1 6148997
Institutional Equity Sales: +353 1 6792816 Davy Research
July 8, 2009
Rossa White Research Report: Irish economy/Banks
rossa.white@davy.ie / +353 1 6148770
Scott Rankin
scott.rankin@davy.ie / +353 1 6148927
Government finances and banks
Irish state's funding outlook clearer
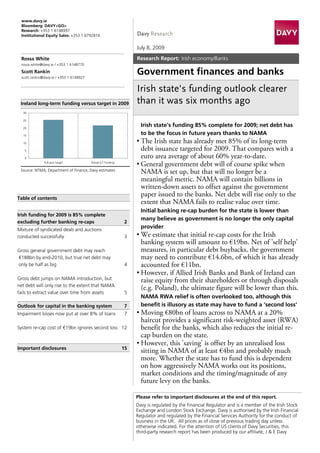
Ireland long-term funding versus target in 2009 than it was six months ago
30
25
20
Irish state's funding 85% complete for 2009; net debt has
15
to be the focus in future years thanks to NAMA
10 • The Irish state has already met 85% of its long-term
5 debt issuance targeted for 2009. That compares with a
0 euro area average of about 60% year-to-date.
Full-year target Raised (LT funding)
• General government debt will of course spike when
Source: NTMA; Department of Finance; Davy estimates
NAMA is set up, but that will no longer be a
meaningful metric. NAMA will contain billions in
written-down assets to offset against the government
Table of contents
paper issued to the banks. Net debt will rise only to the
extent that NAMA fails to realise value over time.
Initial banking re-cap burden for the state is lower than
Irish funding for 2009 is 85% complete
many believe as government is no longer the only capital
excluding further banking re-caps 2
Mixture of syndicated deals and auctions
provider
conducted successfully 3 • We estimate that initial re-cap costs for the Irish
banking system will amount to €19bn. Net of 'self help'
Gross general government debt may reach measures, in particular debt buybacks, the government
€188bn by end-2010, but true net debt may may need to contribute €14.6bn, of which it has already
only be half as big 4 accounted for €11bn.
• However, if Allied Irish Banks and Bank of Ireland can
Gross debt jumps on NAMA introduction, but raise equity from their shareholders or through disposals
net debt will only rise to the extent that NAMA
(e.g. Poland), the ultimate figure will be lower than this.
fails to extract value over time from assets 5
NAMA RWA relief is often overlooked too, although this
Outlook for capital in the banking system 7 benefit is illusory as state may have to fund a 'second loss'
Impairment losses now put at over 8% of loans 7 • Moving €80bn of loans across to NAMA at a 20%
haircut provides a significant risk-weighted asset (RWA)
System re-cap cost of €19bn ignores second loss 12 benefit for the banks, which also reduces the initial re-
cap burden on the state.
• However, this 'saving' is offset by an unrealised loss
Important disclosures 15
sitting in NAMA of at least €4bn and probably much
more. Whether the state has to fund this is dependent
on how aggressively NAMA works out its positions,
market conditions and the timing/magnitude of any
future levy on the banks.
Please refer to important disclosures at the end of this report.
Davy is regulated by the Financial Regulator and is a member of the Irish Stock
Exchange and London Stock Exchange. Davy is authorised by the Irish Financial
Regulator and regulated by the Financial Services Authority for the conduct of
business in the UK. All prices as of close of previous trading day unless
otherwise indicated. For the attention of US clients of Davy Securities, this
third-party research report has been produced by our affiliate, J & E Davy
2. Research Report: Government finances and banks July 8, 2009
Irish funding for 2009 is 85% complete
excluding further banking re-caps
The Irish government has already met the majority of its long-term
funding requirement for 2009 (see Figure 1). We reckon the funding
programme is now more than 85% complete.
Figure 1: Ireland long-term funding versus target in 2009 (€bn)
30
25
20
15
10
5
0
Full-year target Raised (LT funding)
Source: NTMA; Department of Finance; Davy estimates
Here is the breakdown of required long-term gilt issuance for 2009 (see
Table 1). The full year Exchequer deficit will amount to about €24.3bn
this year, and €5bn was required to redeem a five-year bond that
matured in April. But that total of €29.3bn overstates the actual target.
The initial €4bn re-capitalisation of Anglo Irish Bank (€3bn has gone in
with €1bn to follow) will be financed from existing cash balances that
were generated by short-term debt issuance in late 2008, limiting the
target for funding via long-term bonds to €25.3bn.
Note that the initial €4bn for Anglo There is one caveat: the €25.3bn target excludes any public monies
will be sourced from existing required to further re-capitalise the banking system this year. The Irish
government cash balances raised
via the government's 2008
government may still have to come up with €3.6bn as an initial re-cap,
commercial paper programme but we do not know how much of it will arise in 2009 (see Tables 4 and
7) or how it will be financed (we do assume, however, that long-term
bonds will be issued rather than running down state cash or liquidating
National Pensions Reserve Fund (NPRF) assets).
Table 1: Long-term funding requirement for 2009 (€bn)
Exchequer Borrowing Requirement 24.3
Redemption 5.0
less: Anglo re-cap from last year's short-term funding 4.0
Full-year target 25.3
Raised year-to-date 21.7
Source: NTMA; Department of Finance; Davy estimates
Note that the Exchequer Balance rather than the often-referenced
General Government Balance (GGB: the EU-wide metric) is the one to
2 Davy Research
3. Research Report: Government finances and banks July 8, 2009
concentrate on in terms of funding. The General Government deficit
will be lower than the Exchequer Borrowing Requirement (EBR) as
borrowed funds used for bank re-capitalisation do not affect the GGB –
they are counted as a financial transaction and not expenditure.
Mixture of syndicated deals and auctions conducted successfully
Five H2 auctions will be enough to
To meet the funding objective, the government has conducted three
meet full-year target for long-term
bonds syndicated deals and four auctions, raising €20.7bn in long-term funds
(see Table 2). It has also raised €1bn from savings products in the retail
market, leaving the remaining funding gap at less than €4bn. Scheduled
auctions in the second half of the year (on July 21st, August 18th,
September 15th, October 20th and November 17th) will meet that
requirement.
Table 2: Funding detail 2009 year-to-date (€bn)
Issue(s) Coupon Maturity Deal
08 Jan 2009 6.00 4.0% 2014 Syndicated
25 Feb 2009 4.00 3.9% 2012 Syndicated
24 Mar 2009 0.91 4.5% 2020 Auction
0.39 4.0% 2011 Auction
21 Apr 2009 0.76 4.5% 2018 Auction
0.30 4.0% 2014 Auction
19 May 2009 0.70 4.4% 2019 Auction
0.31 4.0% 2014 Auction
16 Jun 2009 0.65 4.6% 2016 Auction
0.65 3.9% 2012 Auction
23 Jun 2009 6.00 5.9% 2019 Syndicated
Other: An Post/Prize Bonds 1.00
Total 21.668
Source: NTMA
It is positive that Ireland has completed the vast majority of its funding
for the year before the half-year stage. Ten years on from the
introduction of the single currency, euro area long-term debt issuance is
unprecedented in 2009 at almost €900bn. But governments have been
active in the market throughout the year: euro area sovereigns have
completed on average 61% of their annual funding needs (see Table 3).
Ireland has completed 85% of its That means Ireland ranks well, having completed 85% of its issuance by
funding for 2009 versus 61% in the the end of H1. Only Belgium and Greece have done more, at 87% and
euro area
86% respectively. At the other end of the spectrum, Austria, Italy and
Germany have reached less than 60% of their target.
3 Davy Research
4. Research Report: Government finances and banks July 8, 2009
Table 3: Euro area long-term debt issuance (€bn)
Gross issuance required Year-to-date issued % complete
Belgium 31 27 87
Greece 50 43 86
Ireland 25 22 85
Portugal 15 11 73
Finland 11 7 64
Netherlands 48 30 63
Spain 100 63 63
France 165 103 62
Euro area 871 534 61
Austria 26 15 58
Italy 235 126 54
Germany 165 87 53
Source: HSBC; EC; Davy estimates
Gross general government debt may reach €188bn by end-2010, but
true net debt may only be half as big
What about the debt level now and where does the National Asset
Management Agency (NAMA) fit in? Irish government debt has risen
significantly, but net debt is still much lower. Because Ireland has set up
an asset management agency that has to be initially financed by
government bonds, gross debt will be a misleading metric in the years to
come until the value is realised from the NAMA assets to pay off those
bonds. Keep in mind that Ireland also has two other stores of value to
net off against gross debt. It has access to the NPRF (which had €11bn
in liquid assets at end-March) if really needed. In addition, the state's
cash balances stand at €16bn or almost 10% of 2009 GDP.
Total system re-cap costs are the From a long-term borrowing viewpoint, the key question is how much
salient figure to analyse potential in extra funds will be required to meet banking re-capitalisation needs.
extra funding needs
We think that system re-capitalisation costs will come to around €19bn
(see Table 6). Of that €19bn, 72% or €13.6bn has already been
accounted for:
€7bn committed to Allied Irish Banks (ALBK) and Bank of Ireland
(BKIR), of which €4bn came from existing NPRF assets and €3bn
from the Exchequer;
€2.6bn raised by the banks themselves in buybacks; and
a further €4bn has been earmarked for the nationalised Anglo Irish
Bank (ANGL) to initially shore up its balance sheet, of which the
Exchequer has thus far injected €3bn (from existing cash balances).
Our estimates suggest that the government will have to find €3.6bn
more to initially re-capitalise the system (the residual €1.7bn will come
from the banks themselves through debt buybacks etc.). This re-cap
obligation will probably be triggered when assets are transferred into
NAMA, although the exact timing of this is uncertain.
Government may only need to find As a result, €3.6bn may be added to gross government debt unless an
an extra €10bn in next couple of equivalent amount of assets in the NPRF is liquidated or existing cash
years ignoring any value not
realised by NAMA over its long life
balances (already financed through the government's commercial paper
programme) are used (see Table 4). For now, we assume that the funds
4 Davy Research
5. Research Report: Government finances and banks July 8, 2009
are unlikely to come from existing NPRF assets. So we conservatively
assume that it will come from long-term borrowing, although it is
plausible that Exchequer cash will be run down. Cash balances currently
stand at a healthy €16bn (accounting for the €4bn committed to
ANGL).
Table 4: Estimated General Government debt profile 2008-2010 (€m)
2008E 2009F 2010F
Gross General Government Debt (start of year) 80296 168246
Increase in debt due to net Exchequer borrowing 20350 19904
Further bank re-cap (assume it occurs in 2009)* 3600
NAMA-issued government bonds 64000
Gross General Government Debt (end-year) 80296 168246 188149
NPRF 16500 15500 15500
Cash balance** 20000 16000 16000
Net General Government Debt (end-year) 43796 136746 156649
GDP 185768 172142 165368
Gross General Government Debt/GDP (end-year) 43% 98% 114%
Net General Government Debt/GDP (end-year) 24% 79% 95%
Net General Government Debt assuming NAMA realises full value of 72746 92649
assets
Net General Government Debt assuming NAMA realises full value of 42% 56%
assets % GDP
* based on system re-cap costs of €19bn
** Anglo €4bn re-cap from existing cash balances
Source: Davy estimates
NAMA will endeavour to realise
enough value over a long period to Gross debt jumps on NAMA introduction, but net debt will only rise
repay new government paper to the extent that NAMA fails to extract value over time from assets
The second consideration is the government-backed bonds that NAMA
will issue to the banks in return for their written-down assets. We
assume these bonds (note that the government is not issuing any bonds
to the market) will total €64bn, i.e. the 'economic value' of assets
initially in NAMA. Government debt rises automatically by this amount
on the advent of NAMA. But NAMA will endeavour to extract full
value from the assets over a long period, possibly at least ten years.
Clearly, it is only accurate to assume that net debt jumps as much as
gross debt today if one assumes that the net present value extracted from
the NAMA assets is zero. That won't happen. For illustrative purposes,
Table 5 provides some sensitivity analysis, taking gross General
Government debt in 2010 as the starting point (all other things equal).
5 Davy Research
6. Research Report: Government finances and banks July 8, 2009
Table 5: Sensitivity of net debt to value realisation from NAMA (€m)
Gross General Government Debt (end-2010) 188149
% of GDP 114%
Full value of NAMA assets 64000
Net General Government Debt assuming full value of NAMA assets realised 92649
% of GDP 56%
Net General Government Debt assuming 90% realised 99049
% of GDP 60%
Net General Government Debt assuming 80% realised 105449
% of GDP 64%
Net General Government Debt assuming 70% realised 111849
% of GDP 68%
Source: Davy estimates
Net General Government Debt is
Even if NAMA were to realise only 70% of the value in 2010 money (a
the crucial metric: likely to remain
manageable even if NAMA does very bearish assumption), net General Government Debt would not
not realise full value exceed 70% of GDP. However, if this looked like being the trajectory
for value-realisation, it could create funding problems with regard to the
perceived value of the bonds that the banks will receive from NAMA
well before that. In a more realistic (but yet pessimistic scenario) where
90% of value is extracted, net General Government Debt comes in at a
manageable 61% of GDP.
6 Davy Research
7. Research Report: Government finances and banks July 8, 2009
Outlook for capital in the banking
system
In order to estimate the burden the banks will create for the Irish state,
we have to answer two key questions. The first is what the initial re-
capitalisation requirement is, i.e. we need to estimate the level of capital
required to fill the hole caused by bad debts so as to meet certain
accepted ratios. Having done this, we need to determine how much of
this will need to come from the government as opposed to other sources
or 'self help' efforts by the banks themselves.
The second question is what the 'second loss' or the potential loss that
could be incurred by NAMA is bearing in mind that it will be paying
above market value for property loans.
The initial re-cap requirement will have to be met in the next several
months, whereas the second loss (if any) will depend on how aggressively
NAMA works through its assets, future market conditions and any levy
imposed on the banks down the road.
Impairment losses now put at over 8% of loans
Following various results and trading statements we have updated our
estimate for system losses across the six Irish banks, which we last
published in early April (see Table 6). We now expect cumulative
We now expect cumulative impairments over the 2008-2010 period across the six covered banks to
impairments over the 2008-2010 reach 8.3% of 2008 loans or €33bn. We previously had estimated €23bn
period across the six covered banks
to reach 8.3% of 2008 loans or
or 5.8% of loans. Around €6bn of the €10bn increase is related to the
€33bn non-quoted banks, which represent only 25% of the aggregate loan pool.
Our new impairment estimates range from 1.6% at Irish Life &
Permanent (IPM) to 5.5% at BKIR, 8.6% at ALBK and as high as 15%
for ANGL and 22% for Irish Nationwide Building Society (INBS).
All our figures are at/beyond each bank's worst-case scenarios. For
ALBK, we have pencilled in €11.2bn in bad debts versus the last
published stress case of €8.4bn (€8.7bn if we allow for the increase in
2009 guidance). For BKIR, we are at €7.4bn versus management's
€6.0bn worst case. Meanwhile, our projections for ANGL and, by
extrapolation, INBS take account of the board's worst-case scenario of
€11bn over the three years 2009-2011. We have a similar €11.3bn in for
the 2008-2010 period.
Pre-provision profits are projected to be around €17bn over the three
years. The core equity base started this year at €23bn, but we see this
being down to under €8bn by end-2010. NAMA will obviously
accelerate the impairment recognition process as we see it crystallising up
to 55% of the cumulative impairment figure we have in of €11bn at
ALBK and nearer 37% at BKIR.
Our capital calculations in table 6 here follow the impact of certain 'self
help' measures at ALBK, BKIR and IPM. In the case of ALBK, the bank
has committed to raising €1.5bn by the year-end and has already reached
€1bn through a debt swap. Any NAMA-related write-down will trigger a
7 Davy Research
8. Research Report: Government finances and banks July 8, 2009
further capital call. BKIR has raised a similar €1bn in a debt buyback,
while the projections for IPM already reflect a €120m reinsurance
arrangement. In table 6 we have not yet included any new capital at
ANGL, either a debt buyback or in the form of a government injection.
Initial re-cap costs of €19bn, which is lower than some estimates as
government is no longer the only provider of capital
In Table 6 we also show various re-cap costs that flow from different
required levels of capital at the bottom of the cycle (which we assume
will be 2010). At a core equity ratio of 5%, the requirement is €10.8bn;
at 6%, it is €14.3bn; at 7%, which is closer to what UK banks will
probably end up on, this rises to €17.9bn.
The Irish government has chosen to inject preference shares into ALBK
and BKIR and has indicated that if NAMA triggers an incremental
capital requirement then this will be filled with equity. So required
minimum capital levels are likely to reflect a combination of core tier 1
prefs and equity. Crucially too, the re-cap numbers computed in Table 6
ignore the RWA benefit that NAMA provides to the banks' capital
which is very significant.
8 Davy Research
9. Research Report: Government finances and banks July 8, 2009
Table 6: Estimated banking system losses and re-cap costs*
ALBK BKIR IPM ANGL EBS INBS Total
Dec 2008 Mar 2009 Dec 2008 Sep 2008 Dec 2008 Dec 2008
Loans €129 €134 €40 €72 €17 €10 €402
Bad debts 2008-2010 (€bn) €11.2 €7.4 €0.7 €11.3 €0.6 €2.3 €33.3
As a % of loans 8.6% 5.5% 1.6% 15.7% 3.4% 22.5% 8.3%
Pre-provision profits (€bn) €6.6 €4.5 €1.1 €3.7 €0.2 €0.7 €16.8
Other deductions (€bn) €1.1 €0.7 €0.0 €1.2 €0.1 €0.2 €3.2
P&L losses (€bn) -€3.5 -€2.2 €0.4 -€6.4 -€0.3 -€1.4 -€13.4
Equity tier 1 2008 (€bn) €7.7 €6.5 €2.1 €4.7 €0.6 €1.2 €22.7
Equity tier 1 2009 (€bn) €5.6 €5.7 €2.0 €0.3 €0.5 €0.8 €14.8
Equity tier 1 2010 (€bn) €3.6 €4.4 €1.9 -€2.3 €0.2 -€0.2 €7.6
RWA 2008 (€bn) €134 €105 €22 €86 €11 €12 €370
RWA 2009 (€bn) €137 €103 €22 €77 €10 €12 €361
RWA 2010 (€bn) €138 €101 €21 €69 €10 €12 €352
Equity tier 1 2008 % 5.8% 6.2% 9.2% 5.5% 5.2% 9.8% 6.1%
Equity tier 1 2009 % 4.1% 5.5% 8.9% 0.3% 4.5% 6.7% 4.1%
Equity tier 1 2010 % 2.6% 4.3% 8.9% -3.4% 2.2% -1.3% 2.2%
Bad debts (€bn) (baseline 8.3% of loans)
100bp more, i.e. 9.3% €12.5 €8.7 €1.1 €12.0 €0.7 €1.5 €37.4
200bp more, i.e. 10.3% €13.8 €10.1 €1.5 €12.7 €0.9 €1.6 €41.4
300bp more, i.e. 11.3% €15.1 €11.4 €1.9 €13.5 €1.1 €1.7 €45.4
400bp more, i.e. 12.3% €16.4 €12.7 €2.3 €14.2 €1.2 €1.8 €49.4
Equity tier 1 2010 %
100bp more, i.e. 9.3% 1.8% 3.3% 7.4% -4.2% 1.0% 3.9% 0.9%
200bp more, i.e. 10.3% 1.1% 2.2% 5.9% -5.0% -0.2% 3.2% 0.0%
300bp more, i.e. 11.3% 0.3% 1.2% 4.4% -5.9% -1.5% 2.5% -0.9%
400bp more, i.e. 12.3% -0.4% 0.1% 2.9% -6.7% -3.0% 1.8% -1.7%
Additional equity reqd. to get 5% (€bn)
Current forecasts €3.3 €0.7 €0.0 €5.8 €0.3 €0.7 €10.8
100bp more, i.e. 9.3% €4.4 €1.7 €0.3 €6.4 €0.4 €0.1 €13.4
200bp more, i.e. 10.3% €5.4 €2.8 €0.7 €7.0 €0.5 €0.2 €16.6
300bp more, i.e. 11.3% €6.4 €3.9 €1.0 €7.5 €0.7 €0.3 €19.8
400bp more, i.e. 12.3% €7.5 €4.9 €1.3 €8.1 €0.8 €0.4 €23.0
Additional equity reqd. to get 6% (€bn)
Current forecasts €4.7 €1.7 €0.2 €6.5 €0.4 €0.8 €14.3
100bp more, i.e. 9.3% €5.7 €2.7 €0.6 €7.1 €0.5 €0.2 €16.9
200bp more, i.e. 10.3% €6.8 €3.8 €0.9 €7.6 €0.6 €0.3 €20.1
300bp more, i.e. 11.3% €7.8 €4.9 €1.2 €8.2 €0.8 €0.4 €23.3
400bp more, i.e. 12.3% €8.9 €6.0 €1.5 €8.8 €0.9 €0.5 €26.5
Additional equity reqd. to get 7% (€bn)
Current forecasts €6.1 €2.7 €0.5 €7.2 €0.5 €1.0 €17.9
100bp more, i.e. 9.3% €7.1 €3.8 €0.8 €7.8 €0.6 €0.4 €20.4
200bp more, i.e. 10.3% €8.2 €4.8 €1.1 €8.3 €0.7 €0.4 €23.6
300bp more, i.e. 11.3% €9.2 €5.9 €1.4 €8.9 €0.9 €0.5 €26.8
400bp more, i.e. 12.3% €10.2 €7.0 €1.7 €9.5 €1.0 €0.6 €30.1
* Projected equity shortfall ignores RWA benefit of NAMA, which reduces capital requirements at the banks; figures for ANGL are before €4bn government
injection and any buyback gains
Source: Davy estimates
9 Davy Research
10. Research Report: Government finances and banks July 8, 2009
As to what this minimum is and whether the Regulator's interpretation
of this will change, we note a recent statement from the Minister for
Finance in the Dáil.
"Regarding the suggestion that there was a danger in raising capital
ratios, the UK raised them to give confidence to markets in respect of
the banks. We did not follow suit, keeping with the minimum capital
ratios. I do not propose to change that because I agree … that if one
raises capital ratios too high we will inhibit lending. We must have a
minimum and that must be adhered to."
This would seem to confirm our suspicion that the Irish government is
not planning on setting the capital bar particularly high for the Irish
banks post-NAMA. Instead, it plans to let the preference shares help
offset a slightly lower level of equity tier 1 (maybe 5%+) versus UK
peers. In Ireland, the minimum capital requirement is a core tier 1 of
4%, whereas in the UK the new FSA requirement is 4% but after a
severe stress test.
NAMA risk weighting benefit means bottom-up analysis generates
a lower re-cap number than top-down – this is often ignored
Bottom-up analysis suggests initial
As each bank's circumstances are different, with NAMA providing a
re-cap requirement of €19bn
significant RWA benefit, Table 7 looks at the problem from a bottom-
up basis. We can identify €19bn of capital needed across the six covered
banks, €14.6bn of which currently will have to come from the Irish
government.
ANGL is the biggest driver of this The single biggest driver of this number is ANGL. The Irish
government is committed to investing €4bn, and we envisage at most
another €1bn on top assuming that €1.3bn in equity can be generated
from a debt buyback (so total of €6.3bn). Intuitively, this may seem like
a small number given that we are allowing for the bank's worst-case
impairment number of €11bn over three years. However, the RWA
benefit from NAMA is very significant (we assume €27bn of assets move
across) and is not taken into account by media reports, which tend to
talk of a capital injection of nearer €7.5bn. The same logic also applies
to INBS, where we pencil in up to €1bn in capital (if the loans were kept
on balance sheet, the figure would be well in excess of this).
The final bill will obviously depend on many variables, including what
level of capital the government lets ANGL run with (we have used 7.5%
core equity post-NAMA).
As the bank is in state hands, it arguably does not need to reach the same
bar as ALBK or BKIR, particularly if it is subsequently sold on in parts
down the road (this just gets reflected in the consideration received).
Another factor we have not been able to model is the benefit of the
temporary derogations that ANGL has received from the Regulator.
These probably run to a few hundred million (see p51/52 of the
interims).
Our system figure compares with the €20-25bn identified by S&P in its
recent rating report on Ireland. We understand that this was worked off
10 Davy Research
11. Research Report: Government finances and banks July 8, 2009
a minimum hurdle of 6% for core tier 1 in 2011, albeit skewed upwards
by a few billion to reflect the rating link with the sovereign credit.
Table 7: Bottom-up re-cap assessment taking account of NAMA (€bn)
Preference Equity Self help Total
shares measures capital
ALBK 3.5 1.3 1.5 6.3
BKIR 3.5 0.0 1.0 4.5
ANGL 0.0 5.0 1.3 6.3
IPM 0.0 0.0 0.5 0.5
INBS 0.0 1.0 0.0 1.0
EBS 0.0 0.3 0.0 0.3
Total 7.0 7.6 4.3 18.9
Source: Davy estimates
No more than €14.6bn should need
Our analysis points to a maximum of €14.6bn coming from the Irish
to come from the state initially
state initially. Some of this could be clawed back later as the funding
window for banks has opened up again, and we see BKIR in a strong
position to do a rights issue in Q4 and repay €1.5bn+ of the government
preference shares. ALBK could possibly be in a position to do likewise,
while there is the possibility that the bank could generate significantly
more than the market thinks from any disposal of Poland.
Our losses now on a par with early 1990s Sweden, but initial
government re-cap costs will be at least in line with Finland (9% of
GNP)
Cumulative loan losses over three
Cumulative loan losses over three years of 8%+ would put us on a par
years of 8%+ would put us on a par
with the damage seen in Sweden in with the damage seen in Sweden in the early 1990s (see Figure 4).
the early 1990s However, our equivalent initial re-cap costs as a percentage of GDP, if
they are to be fully satisfied by the Irish government (as opposed to the
market), will be a lot higher.
In Sweden, government re-cap costs were 4% of GDP (according to the
IMF) due to two of their large banks eventually being able to tap the
markets for equity rather than relying on government. Our €14.6bn,
excluding self help measures, would be nearer 9% of Ireland's peak
GNP.
As we have commented before, the adjustment in the Irish economy
The adjustment in the Irish
economy more closely resembles
more closely resembles what happened to Finland rather than Sweden.
what happened to Finland rather There, loan losses in the commercial sector were less than 6%, with far
than Sweden greater damage caused in the savings banks (the equivalent of the credit
unions in Ireland). Re-cap costs, however, were closer to the same 9% of
GDP.
11 Davy Research
12. Research Report: Government finances and banks July 8, 2009
Figure 2: Financial crises: recap costs as % of GDP
40%
35%
30%
25%
20% €19bn would be up here
15%
10%
5%
0%
Philippines
Argentina
Bolivia
Czech Republic
Paraguay
Estonia
Lithuania
Sweden
Colombia
Ecuador
Bulgaria
Norway
Croatia
Sri Lanka
Mexico
Colombia
Brazil
Vietnam
Venezuala
Ghana
Uruguay
Japan
Finland
Argentina
Jamaica
Malaysia
Thailand
Korea
Turkey
Chile
Indonesia
Source: IMF
Figure 3: Loan loss provisions in Finland (early 1990s) Figure 4: Loan loss provisions in Sweden (early 1990s)
8 5
7
4
% of balance sheet total
% of balance sheet total
6
5 3
4 2
3
1
2
1 0
0 -1
1980 1985 1990 1995 2000 1980 1985 1990 1995 2000
Commercial banks Savings banks Cooperative banks Commercial banks Savings banks Cooperative banks
Source: Drees and Pazarbasioglu; OECD Source: Drees and Pazarbasioglu; OECD
System re-cap cost of €19bn ignores second loss
Our analysis so far ignores the unrealised liability to the state
sitting in NAMA – this is €4bn today at a minimum
Our post-NAMA and base case loan loss projections in our earnings
models are more or less aligned, with only differences in timing
impacting the capital ratios. The logic for this is that NAMA will pay
'economic value' rather than market value for the assets, so it makes no
real sense to assume the post-NAMA outcome will be materially worse.
This is particularly so given that our base case models for ALBK and
BKIR build in a far worse outcome for impairment than the banks are
guiding today.
A question investors will ask though is what, if our loan loss projections
prove to be accurate, unrealised liability for the state will be buried
within NAMA's portfolio. This is the flipside to the RWA 'benefit' we
allude to above in our discussion of ANGL. Strictly speaking, it is a
question that one cannot really answer as many of the assets NAMA
acquires could be sitting on its books for maybe ten years or more by
which time values may have recovered.
12 Davy Research
13. Research Report: Government finances and banks July 8, 2009
Nevertheless, in our research note of April 29th (Irish banks: "Haircuts:
not styled purely on property values"), we tried to put a figure on this
based on today's market conditions.
Unrealised loss sitting in NAMA In Table 8, we show a haircut of 25% for ALBK and 22% for BKIR.
likely to be at least €4bn based on The latter was originally 20%, but we have reduced the assets transferred
today's property values
from €20bn to €17bn on the basis of guidance from the bank. Given
that our NAMA models assume a collective write-down of €8.7bn for
the two banks, NAMA is paying c.€2.4bn above market on this basis.
Extrapolating this across all six covered banks, one is possibly looking at
€4bn in today's money.
NAMA to operate as a statutory body so capital can be injected as
required to cover any realised losses
If values do not recover, then as NAMA assets are realised for cash this
'€4bn' will have to be found and injected into NAMA in the form of
capital. Adding this €4bn to our €18.9bn from earlier gives a total
capital cost of nearer €23bn in today's terms.
Note we understand that NAMA will not be capitalised up-front like a
bank or corporate entity but will be operated as a statutory body. This
means that the state can inject capital on a phased basis as it is needed.
Table 8: ALBK and BKIR mark to market haircut calculation
% haircut on transfer ALBK BKIR
Land bank 40% 36%
Ireland 44% 44%
UK 24% 24%
Residential development 23% 22%
Ireland 25% 25%
UK 20% 20%
Commercial development 20% 20%
Ireland 21% 21%
UK 19% 19%
Total development 32% 27%
Residential investment 7% 6%
Ireland 8% 8%
UK 5% 5%
Commercial investment 8% 7%
Ireland 9% 9%
UK 5% 5%
Total investment 7% 7%
Development loans (€bn) 21.3 12.4
Investment loans (€bn) 8.7 4.6
Transferred loans (€bn) 30 17
Total haircut % 25% 22%
Market based write-down (€bn) 7.4 3.7
Economic based write-down (20% and 16%) 6.0 2.7
NAMA overpayment 1.4 1.0
Source: Davy estimates
13 Davy Research
14. Research Report: Government finances and banks July 8, 2009
'Phantom equity' suggests gap between market and economic value
could be a lot bigger than our €4bn estimate
Risks to our €4bn skewed to the
However, our €4bn figure comes with a number of caveats. For instance,
upside
we used published LTVs supplied by BKIR and ALBK, whereas we
know that some players offered more generous terms. More importantly,
our modelling was built on the basis that every development land had
equity in the deal (i.e. LTVs were typically 50-60%). However, some of
this equity was never cash – it was borrowed on the back of equity tied
up in other sites, investment properties and business interests.
To the extent that this security is 'real' or realisable (e.g. if it was an
equity release loan on an investment property where the bank geared up
to say a standard maximum LTV of 70-80%), then this is captured in
our model (i.e. in the loss on investment property loans).
However, if the equity in the land deal was borrowed on the strength of
a business which has gone bust or on the basis of just a personal
guarantee, then this equity has evaporated (i.e. it is 'phantom equity').
It is impossible for us to know how significant a factor this is. However,
it does suggest that the difference between market and economic value
or the unrealised loss that NAMA is taking on could be a lot bigger than
our €4bn estimate.
If NAMA records a loss, then the Ultimately, it is the government's intention to levy the banking sector so
state plans to recover this from the as to recover any NAMA-related loss in the future. But until this is done,
banks
the state will have to shoulder any burden.
14 Davy Research
15. Important disclosures
Analyst certification
Each research analyst primarily responsible for the content of this research report certifies that: (1) the views expressed in this research report accurately reflect
his or her personal views about any or all of the subject securities or issuers referred to in this report and (2) no part of his or her compensation was, is, or will be,
directly or indirectly related to the specific recommendations or views expressed in this report.
Investment ratings definitions
Davy ratings are indicators of the expected performance of the stock relative to its sector index (FTSE E300) over the next 12 months. At times, the performance
might fall outside the general ranges stated below due to near-term events, market conditions, stock volatility or – in some cases – company-specific issues.
Research reports and ratings should not be relied upon as individual investment advice. As always, an investor's decision to buy or sell a security must depend on
individual circumstances, including existing holdings, time horizons and risk tolerance.
Our ratings are based on the following parameters:
Outperform: Outperforms the relevant E300 sector by 10% or more over the next 12 months.
Neutral: Performs in-line with the relevant E300 sector (+/-10%) over the next 12 months.
Underperform: Underperforms the relevant E300 sector by 10% or more over the next 12 months.
Under Review: Rating is actively under review.
Suspended: Rating is suspended until further notice.
Restricted: The rating has been removed in accordance with Davy policy and/or applicable law and regulations where Davy is engaged in an investment banking
transaction and in certain other circumstances.
Distribution of ratings/investment banking relationships
Investment banking services/Past 12 months
Rating Count Percent Count Percent
Outperform 37 48 24 58
Neutral 22 28 12 29
Underperform 12 15 1 2
Under Review 3 3 2 4
Suspended 1 1 1 2
Restricted 1 1 1 2
This is a summary of Davy ratings for all companies under research coverage, including those companies under coverage to which Davy has provided material
investment banking services in the previous 12 months. This summary is updated on a quarterly basis. The term 'material investment banking services' includes
Davy acting as broker as well as the provision of corporate finance services, such as underwriting and managing or advising on a public offer.
Regulatory and other important information
Davy is regulated by the Financial Regulator and is a member of the Irish Stock Exchange and London Stock Exchange. Davy is authorised by the Irish Financial
Regulator and regulated by the Financial Services Authority for the conduct of business in the UK. No part of this document is to be reproduced without our
written permission. This publication is solely for information purposes and does not constitute an offer or solicitation to buy or sell securities. This document does
not constitute investment advice and has been prepared without regard to the individual financial circumstances and objectives of persons who receive it. The
securities/strategy discussed in this report may not be suitable or appropriate for all investors. The value of investments can fall as well as rise and there is no
guarantee that investors will receive back their capital invested. Past performance and simulated performance is not a reliable guide to future performance.
Projected returns are estimates only and are not a reliable guide to the future performance of this investment. Forecasted returns depend on assumptions that
involve subjective judgment and on analysis that may or may not be correct. Any information related to the tax status of the securities discussed herein is not
intended to provide tax advice or to be used as tax advice. You should consult your tax adviser about the rules that apply in your individual circumstances.
This document has been prepared and issued by Davy on the basis of publicly available information, internally developed data and other sources believed to be
reliable. Whilst all reasonable care has been taken in the preparation of this document, we do not guarantee the accuracy or completeness of the information
contained herein. Any opinion expressed (including estimates and forecasts) may be subject to change without notice. We or any of our connected or affiliated
companies or their employees may have a position in any of the securities or may have provided, within the last twelve months, significant advice or investment
services in relation to any of the securities or related investments referred to in this document.
Share ownership policy
Davy allows analysts to own shares in companies they issue recommendations on, subject to strict compliance with our internal rules governing own-account
trading by staff members.
We would like to advise you that: Scott Rankin holds shares in Bank of Ireland.
We are satisfied that our internal policy on share ownership does not compromise the objectivity of analysts in issuing recommendations.
15 Davy Research