SlideShare uma empresa Scribd logo
1 de 12
Baixar para ler offline
Developing Country Studies                                                                           www.iiste.org
ISSN 2224-607X (Paper) ISSN 2225-0565 (Online)
Vol 2, No.10, 2012


 Does the End Use of Remittance Matter? A Macro Simulation of
                     the Nigerian Economy
                                     Moses O. Oduh1*, and Nathaniel E. Urama2
                         1. Debt Management Office (DMO), The Presidency, Abuja, Nigeria
         2.   Department of Economics, School of Politics, Economics and International Relations, University of
                                   Reading, United Kingdom (unathaniel@ymail.com)
                             *E-mail of corresponding Author: oduhmoses@yahoo.com


Abstract
International remittance has changed the landscape of international migration from brain drain to brain
circulation; and provided the developing countries the opportunity to raise alternative sources of consumption
and investment financing. However, the tendency that remittances will be poverty-reducing as well as growth-
financing depends on its end use, particularly in import-dependent economies. The importance of focusing
attention on the use of remittances is to checkmate early signs of another round of potential Dutch Diseases
Syndrome which bedeviled the Nigeria’s oil sector from occurring in remittance. Macro-econometric model with
six behavioral equations and six identities where used to estimate and simulate the effects of remittances inflow
on aggregate demand in Nigeria. The simulation result shows that the much touted poverty-reducing effect of
remittances is non-growth-financing for import-dependent country like Nigeria because of its negative impact on
current account balance; despite its positive effects on private consumption and investment.
Keywords: Nigeria, remittance, consumption, investment, import demand, macroeconometric model
1. Introduction
Nigeria like most developing countries has had its fair share of political instability and economic stagnation that
consequently resulted in upsurge in the volume of migrants and brain drain to the outside world, which in itself,
constituted a drag in the socioeconomic development of Nigeria. In 2010, statistics shows that Nigeria has a pull
of stock of emigrants of about 1.0 million with the United States, the United Kingdom, Chad, Cameroon, Italy,
Benin, Côte d’Ivoire, Spain, Sudan, Niger being the top ten highest recipients of Nigerian emigrants (World
Bank, 2011). In the past, Nigerian migrants were only portrayed in the negative sense either in hard drug related
cases, money laundering, child trafficking and financial crimes or “419i”, but today, remittances from Nigerian
migrants have become the single largest source of capital flow and a contributor to household welfare and
poverty reduction. Available data shows that remittance is the second largest source of foreign exchange next to
oil. The work of (Goldberg and Levi, 2008) recorded that remittances inflow to Nigeria was about US$3.2
billion in 2005, 14.8 per cent annual increase from 1995-2005, while the CBN statistics shows that it increased to
US$18 billion in 2007, 50 per cent higher than the World Bank estimate in the same period. If the CBN official
estimate is correct, then Nigeria is the fifth largest destination in the world behind India, China, Mexico, and
Philippine. The current World Bank report in 2011 shows that it hovers around $10 billion, about 5.3 per cent
increase from the 2009 estimate, and more than three-times net FDI inflows; thus, making it the world’s top tenth
recipient country in 2010.
Globally, the contribution of remittances both as a source of external funding and poverty reduction, especially
in the developing economies continues to attract important economic discuss. For example, see studies by
(Odimuko and Riddell, 1979); (Ratha, 2004); (Nwajiuba, 2005); (Ghosh, 2006); (Ambrosius, 2006); (Kireyev,
2006); (Orozco, 2007); (Gupta, Pattillo, and Wagh, 2007); (Lindley, 2008); (Ratha, 2009); (Ratha, Sanket, and
Vijayalakshmi, 2009); (Purnima Mane, 2011); (Sackey, 2011); and (Gupta and Tyagi, 2012). According to the
World Bank report in 2011 there are 215.8 million migrants around the world, representing about 3.2 per cent of
the world’s population. It further shows that since 1995 the global inward remittances amounted to more than $2
746.9 billion of which 71 per cent or $1 950.5 went to the developing economies. The top ten destinations
include: India ($55.0 billion); China ($51.0 billion); Mexico ($22.6 billion); Philippines ($21.3 billion); France

                                                         48
Developing Country Studies                                                                              www.iiste.org
ISSN 2224-607X (Paper) ISSN 2225-0565 (Online)
Vol 2, No.10, 2012


($15.9 billion); Germany ($11.6 billion), Bangladesh ($11.1 billion); Belgium ($10.4 billion), Spain ($10.2
billion); and Nigeria ($10.0 billion). Of interest also is that Sub-Saharan Africa SSA accounts for about 10 per
cent of the world’s stock of migrants representing 2.5 per cent of its total population; and remitting more than
$120 billion, equivalent to 4 per cent of the world remittances and 6 per cent of developing country. Of this,
Nigeria accounts for about 50 per cent of the total remittances inflow to SSA and 77 per cent of the total
remittance inflow to West African Countries.
The questions however, without prejudice to the existing studies which suggest that remittance is growth-
enhancing and poverty-reducing, is whether this huge inflow actually translated into poverty reduction and
economic growth? Does the story of growth and poverty at the global, Sub-Saharan Africa SSA, and Nigeria in
particular support these findings; or is it that remittance has poverty-reducing potential that is yet to be harnessed.
Perhaps a brief overview of the trends in poverty vis-à-vis remittance inflow will help clear the air on the
poverty-reducing potentials and poverty-reducing impact of remittances in the destination countries. This will
further buttress the points made by studies like (Adams Jr., Richard H, Cuecuecha, Alfredo; and Page, John,
2009) which question the uses of remittance as distinct from remittance impact analysis. As was rightly observed
by (Ratha, 2004) that there is tremendous potential for using remittances to encourage development in countries.
Yet, though much progress has been made toward understanding remittances, their potential impact is
significantly reduced. Thus, development policymakers will need much more research on how to use remittances
so that they positively contribute to migrants’ home communities and countries.
At the global and regional level, using the 2005 PPP and $1.25/day poverty line, one observes a negative
correlationi between poverty headcount in the world and SSA and remittance inflow. Globally, remittance
increased from 0.3 per cent in 1984 to about 18 per cent and 61 per cent in the periods 1993 and 2008
respectively; while poverty headcount fell from 52 per cent in 1981 to about 41 per cent and 22 per cent in 1993
and 2008 respectively; for Sub-Saharan Africa poverty headcount rose from 53 per cent in 1981 to 59 per cent in
1993 before declining to 48 per cent in 2008, as remittances increased from -19 per cent in 1984 to 39 per cent
and 127 per cent in 1993 and 2008 respectively; while for Nigeria poverty headcount rose from 54 per cent in
1985 to 63 per cent and 68 per cent in 2003 and 2009 respectively. Remittances inflow rose from (-17 per cent)
in 1981 to (-12 per cent) and 8 per cent in 2003 and 2008 respectively. What it means is that at the global and
regional level remittance may have reduced poverty, but within countries poverty is still pervasive despite the
increase in remittance.
In the foregoing context, and given the peculiarity of the developing countries as consuming, and in most cases
import-dependent; study on remittance-economy interaction is in the second phase of enquiry which attempts to
answer the question about the uses of remittance. Inquiry about the uses of remittances predisposes that its use
determines its socioeconomic effect. And it is in this context that the current student attempts to examine how
remittance inflow into Nigeria is used as against the numerous impact studies in Nigeria.
1.2 Policy gap in perspectives
The Excitement about the supposed negative a priori relationship between remittance and poverty assumed-away
the fact that this straight jacket relationship can only hold in a closed economy; which even when assumed
negates the nomenclature of remittance from existing in the first place. Ideally, putting away trade effects, one
can, without any contradiction generate the kind of conclusion that remittance is both poverty-reducing and
growth-enhancing. Under such strict, but unrealistic assumption, remittance will reduce poverty; impact savings
and investment; and consequently enhance economic growth. But in a global economy, the interaction between
remittance and the aggregate economy is beyond the rule-of-thumb approach, considering the positive
relationship between increase in income and demand for import and the attendant exchange rate and potential
Dutch Disease Syndrome DDS effects - Nigerians are living witnesses to the oil-poverty-growth paradox and the
resources curse hypothesis.
Notwithstanding the conclusions that remittances inflow to Nigeria is poverty-reducing, its growth-financing
potential poses another challenging research question; given the country’s non-inclusive growth and import-
dependent posture. On the interaction between remittances, poverty and the aggregate economy, it is evident that
the country receives about 50 per cent of the total remittance inflow to SSA, yet poverty increased from 54 per
cent in 2004 to about 69 per cent and 72 per cent in 2010 and 2011 respectively. Thus, if it is true that remittance
reduces poverty, its impact is short-lived and unsustainable and there could be a negative shockwave from the
                                                          49
Developing Country Studies                                                                            www.iiste.org
ISSN 2224-607X (Paper) ISSN 2225-0565 (Online)
Vol 2, No.10, 2012


aggregate economy such that the macroeconomic effects of remittance out-clouded the poverty reducing effects,
resulting to welfare loss and increase in poverty in the long run. Consequent upon that is the need to address the
question about what recipients do with remittance, particularly given that consumer goods constitute more than
43 per cent of Nigeria’s total import demand.
While the current study does not align with the opinion that remittance inflow to Nigeria has attracted little
attention from writers; it rather posits that existing studies as tremendous and overwhelming as they are, were
either targeted mainly at the household level – poverty and inequality; while the macro components fairly dealt
with either the determinants of remittances or the generalization of the impact of remittances on growth. Like
most studies in Sub-Saharan Africa SSA, its long-term interaction with macro economy is unclear. Studies by
(Lindley, 2008); and (Gupta, Pattillo, and Wagh, 2007) respectively observed that in spite of the fact that SSA
constitutes about 8.4 per cent of the world’s 190 million stock of migrants in the past 20 years, the long-term
development potentials impacts of what remains after consumption is unclear; nonetheless studies relying on
household data from different countries yield some insights into core, private intra-family or intra-community
income transfers that directly address poverty.
What it shows is that remittance in a wider sense transcend micro impact assessment and may have more serious
implications for major macroeconomic variables like private consumption expenditure, domestic price level,
exchange rate, interest rate, trade flow, and consequently on the aggregate economy- which would ultimately
affect internal and external balances of the recipient country. Moreover, in a small open economy such as Nigeria
with a shallow foreign exchange market and insufficient instruments for the conduct of monetary policy resulting
from low credibility and autonomy of the central bank, the sheer magnitude of foreign currency inflows and their
pronounced seasonal pattern could create significant uncertainties for monetary management, large impulsive
transmission mechanism and the attendant overshooting of reserve money targets and higher inflation (Kireyev,
2006). And finally, because remittances will respond to changes in economic conditions in both the receiving and
originating countries, such as the current global financial crunch, it tends to act as a source of external shock
resulting to balance of payment crisis to the receiving economy (Loser, Lockwood, Minson, and Balcazar, 2006).
Given this, it is reasonable to suppose that there are two (positive and negative) opposing effects of remittance
on the recipient economy whose net outcome depends on the relative strength of the push (factor that push
household to poverty) and pull (factors that push them out of poverty) factors. The current study attempts to
answer the question bothering on what households receiving remittances do with it; and whether remittance is
growth-financing. It used quarterly macro level data from Central Bank of Nigeria’s Macro-econometric Model
of the Nigerian Economy 1981-2007 to add some insights into Nigeria country-specific role of remittances; their
uses and how it impacts on the aggregate economy.
1.3 Objective and research problem
Generally, the purpose of this study is to ascertain the impact of international remittance inflow on aggregate
spending in Nigeria. Specifically, it addresses the following objectives: (1) evaluating the impact of remittances
on food and non-food consumption; oil and non-oil investment; and consumer and non-consumer import demand;
(2) identifying what household do with remittance through a scenario building using macro-econometric model
simulation.
2. Review of Studies on Remittances in Nigeria
There are three generic groups of studies on remittances in Nigeria: analytical issues; micro; and macro level
studies. Analytically, (Odimuko and Riddell, 1979) dealt with urban-rural cash remittances in the South-Eastern
Nigeria; (Nwajiuba, 2005) exemplified the general characteristics of migrants in the southern Nigeria; while
(Hernández-Coss and Bun, 2007) studied the analytical issues relating to UK-Nigeria remittances corridor. In
another study, (Chukwudi, Olise, and Ewuim, 2011) streesed that migrants’ remittal enterprise plays a role in
investment and enterprise growth; and sorts Governments support and protection for Nigerian migrants in order
to protect and respect their human rights, and to ensure that they are not exploited; and that their earnings in the
host countries are safeguarded.
At the micro level (Chukwuone, Amaechina, Iyoko, Enebeli-Uzor, and Okpukpara, 2007); (Ajayi, et al., 2009);
(Olowa O. , 2009); (Odozia, Awoyemia, and Omonona, 2010 ); (Fonta, Onyukwu, and Nwosu, 2011);
(Babatunde and Martinetti, 2011); and (Olowa and Shittu, 2012) studied the impact of remittances on poverty
                                                         50
Developing Country Studies                                                                            www.iiste.org
ISSN 2224-607X (Paper) ISSN 2225-0565 (Online)
Vol 2, No.10, 2012


and inequality; and concluded that remittance reduces poverty and inequality, hence welfare-improving; but
(Olowa O. , 2009) went beyond the welfare implication and concluded that, it is counter-cyclical; which also has
implication for economic growth. Apart from the consumption consequence of remittances, (Osili, 2005)
investigated migrants’ housing investments in their communities of origin, aligning with literature that seeks to
understand the economic ties that migrants maintain with their origin communities. Among the conclusions in
the study is that migrants to a very large extent have ties with their respective communities by channelling part
of the remittance to house investment. The house investment reduces remittances to households at home, but
rises as the house is completed. Thus, the importance of remittances is its investment and altruistic use.
The macro counterpart was concerned with the determinants of remittances inflow. That was the primary focus
of (Ojapinwa, 2012) which identified real GDP, labour market situation and population growth rate as major
determinants of remittances. Other macro level analyses include (Uadiale, Oke, and Okpala, 2011) which found
a posiitve link between remittances and financial through its impact on loanable funds; (Kure and Nwosu, 2008);
(Udah, 2011) found a positive impact of remittances on economic macroeconomic, via human and material
investment.
One take from the foregoing is that the outright conclusion about the positive impacts of remittances inflow on
growth and poverty-reducing seems to have ignored the outright consequences of increased in income and the
growing import demand in Nigeria. Summary of Nigeria’s trade statistics shows that aside oil it has a consistent
unfavourable balance of payment since the late 1970s. To cap it all, bulk (43 per cent) of the total import into the
country is consumer goods; while capital and intermediate goods account for about 40 per cent and 17 per cent
respectively. If higher proportion of remittance inflow is spent on consumption, particularly on import; where
will the growth-financing impact of remittance come from so as to reduce poverty? This has question has pushed
the frontier of research away from impact analysis to the uses of remittances.
3. Methodology
To simulate the aggregate spending effects of remittance, a four-sector Keynesian dynamic macro econometric
model with six behavioural equations and six identities were estimated. The behavioural equations are:
consumption (food and non-food); investment (oil and non-oil); and import demand (consumer and non-
consumer goods) equations; while the identities are: private consumption and investment; net export,
government spending, and aggregate demand. All the variables are real variables.
In answering the question on what households do with remittances, four uses namely, consumption; investment;
health; and education spending were identified by (Ratha, 2009). However the NBS data generating process
DGP included health and education spending, together with clothing and footwear, rent, fuel/light, household
goods, transport, water, entertainment, and other services as constituting the non-food consumption (NBS, 2012).
The study follows this classification which appeals to Keynesian DD model.
3.1 The Model
3.1.1 Household (consumption block)
Private consumption (CO) is disaggregated into food consumption (CF) and non-food consumption (CN). The
predictors of consumption in Nigeria (combining economic theory and Nigeria country-specific peculiarities-
both from research and intuitive reasoning) include income (Yi), pricesii of core (non-food) and non-core items
(food items), exchange rate (REER), remittances (RMT), and deposit rate (SVR)- controlling for savings. The
predictors of food and non-food consumption are specified in equations (1) and (2), while case (3) is the
consumption (CO) identity that closes the private consumption block.


        CF=α 0 +α1REER + α 2 Yi+α 3 RMT+α 4SVR+α 5G+µ1                                              (1)
        CN=α 6 +α 7 REER + α 8 Yi+α 9 RMT + α10 SVR + α11G + µ2                                     (2)
        CO=CF+CN                                                                                    (3)
3.1.2 Firm (investment block)
The model of private investment (INV) relied, in addition to the traditional Keynesian approach, on
irreversibility theory of investment which incorporate business environment. We found this theory specifically
                                                         51
Developing Country Studies                                                                            www.iiste.org
ISSN 2224-607X (Paper) ISSN 2225-0565 (Online)
Vol 2, No.10, 2012


appealing in the case of Nigeria, given that interest rate in Nigeria is over identified; and coupled with the weak
link between interest rate and the real sector which prompted the use of quantitative easing by the monetary
Authorities to stimulate the economy. Determinants of private investment is modelled to include average lending
rate (RD), domestic output (YO), real exchange rate (REER), gross domestic savings (GDS); financial deepening
(FD) to account for mobilization of funds; remittance inflow (RMT), and business environment (macroeconomic
volatility). Cases 4 and 5 are the behavioural equations; the identity is defined in case (6). The sector is
disaggregated into oil (INVO) and non-oil (INVN) investment.


         INVN=β 0 +β1RD+β 2 REER+β 3 FD+β 4 RMT+β 5 YO + β 6 BUS+β 7 GDS+μ 3                          (4)

         INVO=β8 +β 9 RD+β10 REER+β11FD+β12 RMT+β13 BUS+β14 GDS+μ 4                                   (5)

         INV=INVO+INVN                                                                                 (6)

3.1.3 External sector (External block)
Import (M) is disaggregated into consumer (MC) and non-consumer (MN) goods. Non-consumer goods are
intermediate and capital goods. Import demand is modelled to depend on real effective exchange rate (REER),
income (Yi), remittances (RMT), and international trade restrictions captured with implicit tariff rate (TAR). In
addition, net export (NX) is specified as the difference between export (X) and import demand (M).
Accordingly, equations 7 (import of consumer goods) and 8 (import of non-consumer goods) are the predictors
of import demand. Cases 8 and 9 are import and net export identities.


         MC=χ 0 +χ 2 REER+χ 3 Yi+χ 4 RMT+χ 5 TAR+μ 5                                                  (7)
         MN=χ 6 + χ 7 REER+χ 8 Yi+χ 9 RMT+χ10 TAR+μ 6                                               (8)
         M=MC+MN                                                                                    (9)
         NX=X-M                                                                                    (10)

3.1.4 Government sector (Government block)
Government consumption expenditure is model strictly as exogenous variable; it is specified as an identity.
Government is the largest consumer in the economy and has been identified as the source and effect of changing
aggregate consumption, partly because of the increasing size and the attendant corruption in the economy.


         G=G0                                                                                      (11)
3.1.5 Aggregate economy (Aggregate demand)
Following the traditional Keynesian aggregate demand (DD) identity, we close the model as the sum of private
demand (private consumption and investment); exogenous government consumption (G); and net export.


         DD=CO+INV+G0+NX                                                                           (12)

4. Presentation and Analysis of results
4.1Data handling and regression results
All the variables were tested for unit root and co-integration, but for brevity the results are not presented. Apart
from remittance that is integrated of order-two, others are integrated of order-one. Explanatory variables with the
same order of integration with their respective endogenous variables are found to be co-integrated except
                                                         52
Developing Country Studies                                                                            www.iiste.org
ISSN 2224-607X (Paper) ISSN 2225-0565 (Online)
Vol 2, No.10, 2012


consumption of food and non-food. Consequently, error correction models were used for investment and import
demand equations. The error correction (ECM) variables used in the equations are: ECM_INVN (investment-
non-oil); ECM_INVO (investment-oil); ECM_MC (import of consumer goods); and ECM_MN (import non-
consumer goods).
Table 1 (appendix A) depicts the determinants of consumption; investment; and import demand. It also contains
the long run (LR) co-integrating equations of investment and import. Determinants of consumption include:
remittance, income, real exchange rate, and government consumption expenditure; investment: financial
deepening, remittances, business environment, real exchange rate, gross domestic savings, and domestic average
lending; while import restriction, remittances, income, and real exchange rate are determinants of import
demand.
4.2 Simulation experiment
Table 2 shows one-period percentage change (annual) of the baseline simulation (in-sample) scenario of 5 per
cent and 15 per centiii increase in migrant remittances inflow on total consumption (CO), consumption of food
(CF) and non-food (CN); total private investment (INV), investment-oil (INVO) and investment non-oil (INVN);
total import demand (M), import of consumer (MC) and non-consumer (MN) goods; net export (NX); and finally
on aggregate demand (DD).
On the average, increase in remittances inflow increases consumption by about 1.7 per cent; with 1.6 per cent
allocated to food while 1.7 per cent is allocated to non-food – consumers attach equal weights to both food and
non-food, though non-food is marginally higher. Investment in the non-oil sector increases by 19 per cent, while
oil-sector increases by 19.4 per cent giving an average of 18 per cent increase in total private investment. On the
other hand, total import demand will rise by 23 per cent out of which demand for consumer goods accounts for
29 per cent while non-consumer goods accounts 20 per cent. On the average, aggregate demand will decrease by
about 0.8 per cent resulting from the decline in current account balance by average of 17 per cent; that is 12.7 per
cent (5 per cent simulation) and 21.7 per cent (15 per cent simulation) respectively. Figure 1 is a summary of
percentage distribution of aggregate spending effect of remittances extracted from simulation experiment in table
2.
Thus, if remittance is poverty-reducing, there must be an unknown transmission mechanism; because obviously
from the simulation result in table 2 it might not be through economic growth because of the negative growth
effect associated with the balance of payment deficit. Although there are improvements in domestic investment
(oil and non-oil); and smoothing consumption (food and non-food); they were not strong enough to offset the
negative consequences of current account deficit associated with high import demand. Considering that
economic growth has inverse relationship with poverty; the observed negative effect of remittances on macro
economy is expected to have adverse effect on poverty. Thus, the conclusion that remittances decreases poverty
and inequality may be a short run phenomenon or that the impact of remittances as increasing function of
consumption is misunderstood to be poverty-reducing.
5. Conclusion
The paper examines the macroeconomic effects of migrant remittances inflow to Nigeria using a small macro-
econometric model. The selected macroeconomic variables are consumption; private investment; import demand;
and net export.
The simulation result revealed two important findings. It confirms the importance of migrant remittances as both
sources of direct and deferred consumption through its impact on private consumption and investment.
Recipients of remittances spend more on investment than on consumption. However, the investment component
of remittance spending is not strong enough to off-set the negative impact of import demand; thus, raising the
fear that growth-financing of remittances inflow is neutralised by high-import dependence of the country.
Instructively the benefits of remittances can only be growth-financing if the destination country has a policy of
import substitution particularly for consumer goods. Further study is however, required to ascertain whether the
multiplier effect of the increase in investment and the attendant employment by-product could off-set the balance
of payment deficit effect.
References

                                                         53
Developing Country Studies                                                                   www.iiste.org
ISSN 2224-607X (Paper) ISSN 2225-0565 (Online)
Vol 2, No.10, 2012


Adams, Jr., Richard H; Cuecuecha, Alfredo; and Page, John. (2009, March). Topic 10 – Remittances,
Consumption and Investment. Retrieved from Social Science Research Council, SSRC:
http://www.ssrc.org/publications/view/96D00F02-4155-DE11-AFAC-001CC477EC70/
Ajayi, M. A., Ijaiya, M. A., Ijaiya, G. T., Bello, R. A., Ijaiya, M. A., and Adeyemi, S. L. (2009).
International remittances and well-being in Sub-saharan Africa. Journal of Economics and International
Finance , 078-084,; Vol. 1(3).
Ambrosius, C. (2006). Financial Stabilization through Remittances? Some remarks on the macroeconomic
effects of migrant remittances. Finance-led Capitalism?Macroeconomic Effects of Changes in the
Financial Sector. Berlin.
Babatunde, R., and Martinetti, E. (2011). Impacts of migrant remittances on food security and nutrition of
Farming Households in Kwara State, Nigeria. Shocks in Developing Countries.
Chukwudi, I., Olise, M., and Ewuim, N. (2011). Protecting Human Rights of Nigerian Migrants: The Case
of Migrant's’ Remittances Enterprise for Sustanable Development in Nigeria. Kuwait Chapter of Arabian
Journal of Business and Management Review, 40-50; Vol. 1, No.1.
Chukwuone, N., Amaechina, E., Iyoko, E., Enebeli-Uzor, S. E., and Okpukpara, B. (2007). Analysis of
impact of Remittances on Poverty and Inequality in Nigeria. PEP Research Network.
Fonta, W. M., Onyukwu, O. E., and Nwosu, E. O. (2011). International Remittance Inflows and Household
Welfare:Empirical Evidence from Nigeria. Research Journal of Finance and Accounting, 140-149.
Ghosh, B. (2006). Migrants’ Remittances and Development:Myths, Rhetoric and Realities. Switzerland and
The Netherlands: International Organization for Migration and The Hague Process on Refugees and
Migration.
Goldberg, M. A., and Levi, M. D. (2008). The Impact of Remittances on Economic Growth. MasterCard
World Wide.
Gupta, D., and Tyagi, R. (2012). Migration of Skilled Professionals from Developing Countries:Study of
India. Developing Country Studies, 14-22.
Gupta, S., Pattillo, C., and Wagh, S. (2007, June 27, 44 (2)). Making Remittances Work for Africa. Finance
and Development.
Hernández-Coss, R., and Bun, C. E. (2007). “The UK-Nigeria Remittance Corridor Challenges of
Embracing Formal Transfer Systems in a Dual Financial Environment”. . World Bank Working Paper
No.92.
Kireyev, A. (2006). The Macroeconomic of Remittances: The caseTajikistan. International Monetary Fund;
Working Paper .
Kure, E., and Nwosu, C. P. (2008). Woker's Remittances and Economic Growth: Evidence from Nigeria.
Young Statisticians Conference. Saint George Hotel, Pretoria, South Africa.
Lindley, A. (2008, May 27). African Remittances and Progress: Opportunities and Challenges (ARI) .
Retrieved                   from                   Real              Instituto             Elcano:
http://www.realinstitutoelcano.org/wps/portal/rielcano_eng/Content?WCM_GLOBAL_CONTEXT=/elcano
/elcano_in/zonas_in/sub-saharan+africa/ari52-2008
Loser, C., Lockwood, C., Minson, A., and Balcazar, L. (2006). The Macro-Economic Impact of Remittances
in Latin America Dutch Disease or Latin Cure? mimeo, Inter American Dialogue.
NBS. (2012). Consumption Pattern in Nigeria 2009/2010. FCT: National Bureau of Statistics, Abuja.
Nwajiuba, C. (2005). International Migration and Livelihoods in Southeastern Nigeria. Global
Commission on International Migration.
Odimuko, C. L., and Riddell, J. B. (1979). Remittances in the south-eastern Nigeria. Blackwell Publishing
on behalf of The Royal Geographical Society (with the Institute of British Geographers).
Odozia, J. C., Awoyemia, T. T., and Omonona, B. T. (2010 ). Household poverty and inequality: the

                                                    54
Developing Country Studies                                                                   www.iiste.org
ISSN 2224-607X (Paper) ISSN 2225-0565 (Online)
Vol 2, No.10, 2012


implication of migrants’ remittances in Nigeria. Journal of Economic Policy Reform , 191-199; 13(2).
Ojapinwa, T. V. (2012). Determinants of Migrants’ Remittances in Nigeria: An Econometrics Analysis.
International Journal of Humanities and Social Science, 295-301; Vol. 2 No. 14.
Olowa, O. (2009). The Impact of Remittances on Household Welfare in Rural Nigeria. Medwell Journals,
59-64.
Olowa, O. W., and Shittu, A. M. (2012). Remittances and income inequality in rural Nigeria. Journal of
Business Management and Economics, 210-221; Vol. 3(5).
Orozco, M. (2007). Remittances, Competition and Fair Financial Access Opportunities in Nigeria. USAID.
Osili, U. (2005). "Migrants and Housing Investments: Theory and Evidence from Nigeria," . Economic
Development and Cultural Change, 821–849; 52 (4).
Purnima Mane. (2011, February 18). Highlighting Importance of Women Migrants’ Remittances. Retrieved
from A Celebration of Women: http://acelebrationofwomen.org/2011/02/unfpa-ms-purnima-mane-
importance-of-women-migrants-remittances/
Ratha, D. (2004, October). Understanding the Importance of Remittances . Retrieved from Migration
Policy Institute MPI: http://www.migrationinformation.org/Feature/display.cfm?ID=256
Ratha, D. (2009, December 29; 46 (4)). Remittances in Development. Finance and Development.
Ratha, D., Sanket, and Vijayalakshmi, K. (2009, February 18). People Move: A blog about Remittance,
Migration        and       Development.       Retrieved       from       World     bank       Blog:
http://blogs.worldbank.org/peoplemove/remittance-flows-to-developing-countries
Sackey, F. G. (2011). Microeconomic Determinants of Private Inward Remittances to Households in Ghana:
a case study. Journal of Economics and Sustainable Development.
Uadiale, O. M., Oke, B. O., and Okpala, O. P. ( 2011). Impact of Workers’ Remittances on Financial
Development in Nigeria. International Business Research, 218-225; Vol. 4, No. 4.
Udah, E. B. (2011). Remittances, Human Capital and Economic Peformance in Nigeria. Journal of
Sustainable Development in Africa, 300-318; Volume 13, No.4.
World Bank. (2011). Migration and Remittances Factbook; Second Edition. 1818 H Street NW,
Washington DC 20433: The International Bank for Reconstruction and Development / The World Bank.


                                                    55
Developing Country Studies                                                                       www.iiste.org
ISSN 2224-607X (Paper) ISSN 2225-0565 (Online)
Vol 2, No.10, 2012


Appendix A: Regression results and baseline simulation experiment
Table 1: Regression results
                CONSUMPTION FOOD               Dep. Var:     DLOG(CF)
                     Variable                  Coefficient    Std. Error   t-Statistic   Prob.

                   DLOG(CF(-1))                   0.5547        0.0717       7.7331      0.0000
                  DLOG(RMT(-4),2)                 0.0733        0.0155       4.7204      0.0000
                   DLOG(YI(-4))                   0.0753        0.0289       2.6049      0.0107
                    DLOG(G(-4))                  -0.1407        0.0438      -3.2148      0.0018
                     D(SVR(-8))                  -0.0007        0.0004      -2.0010      0.0483
                  DLOG(REER(-5))                 -0.0834        0.0282      -2.9620      0.0039

              CONSUMPTION NON-FOOD             Dep. Var:     DLOG(CN)
                     Variable                  Coefficient    Std. Error   t-Statistic   Prob.

                   DLOG(CN(-1))                   0.5529        0.0748       7.3929      0.0000
                  DLOG(RMT(-4),2)                 0.0524        0.0151       3.4786      0.0008
                   DLOG(YI(-4))                   0.0663        0.0283       2.3460      0.0210
                    DLOG(G(-4))                  -0.1302        0.0427      -3.0482      0.0030
                  DLOG(REER(-5))                 -0.1033        0.0280      -3.6966      0.0004

                     EQ01_LRINVN               Dep. Var:     LOG(INVN)
                       Variable                Coefficient    Std. Error   t-Statistic   Prob.

                      LOG(YO(-1))                 0.2425        0.0293       8.2634      0.0000
                     LOG(REER(-1))                0.0423        0.0585       0.7230      0.4713
                      LOG(FD(-1))                -0.1546        0.1446      -1.0692      0.2875
                        RD(-1)                   -0.0018        0.0017      -1.0560      0.2935
                     LOG(GDS(-1))                 0.8441        0.0370      22.8086      0.0000

                     EQ02_LRINVO               Dep. Var:     LOG(INVO)
                       Variable                Coefficient    Std. Error   t-Statistic   Prob.

                      LOG(YO(-1))                -0.1615        0.1278      -1.2641      0.2091
                     LOG(REER(-1))                0.0573        0.0689       0.8323      0.4072
                      LOG(FD(-1))                -0.4186        0.1656      -2.5279      0.0130
                        RD(-1)                   -0.0029        0.0019      -1.5438      0.1258
                     LOG(GDS(-1))                 0.8501        0.0397      21.4062      0.0000
                          C                       4.2554        1.6807       2.5319      0.0129

                      EQ03_LRMC                Dep. Var:      LOG(MC)
                        Variable               Coefficient    Std. Error   t-Statistic   Prob.

                      LOG(YI(-1))                 0.8259        0.0219      37.7957      0.0000
                     LOG(REER(-1))               -0.2510        0.0612      -4.1037      0.0001
                     LOG(TAR(-1))                -0.3795        0.0767      -4.9474      0.0000


                                                     56
Developing Country Studies                                                               www.iiste.org
ISSN 2224-607X (Paper) ISSN 2225-0565 (Online)
Vol 2, No.10, 2012


                   EQ04_LRMN          Dep. Var:           LOG(MN)
                     Variable         Coefficient         Std. Error   t-Statistic   Prob.

                   LOG(YI(-1))          0.8902              0.0219      40.6096      0.0000
                  LOG(REER(-1))        -0.1698              0.0614      -2.7680      0.0067
                  LOG(TAR(-1))         -0.4299              0.0770      -5.5867      0.0000

           IMPORT CONSUMER GOODS      Dep. Var:          DLOG(MC)
                   Variable           Coefficient         Std. Error   t-Statistic   Prob.

                 DLOG(MC(-2))           0.1661              0.0616       2.6988      0.0083
                DLOG(RMT(-7),2)         0.1941              0.0762       2.5477      0.0125
                   DLOG(YI)             0.4480              0.1502       2.9816      0.0037
                 DLOG(REER)            -0.4661              0.1416      -3.2926      0.0014
                  DLOG(TAR)            -0.6870              0.0854      -8.0447      0.0000
                  ECM_MC(-1)           -0.3082              0.0584      -5.2728      0.0000

            IMPORT NON-CONSUMER
                   GOODS              Dep. Var:          DLOG(MN)
                   Variable           Coefficient         Std. Error   t-Statistic   Prob.

                DLOG(RMT(-6),2)         0.2498              0.0728       3.4314      0.0009
                 DLOG(YI(-7))           0.5422              0.1420       3.8192      0.0002
                DLOG(REER(-1))         -0.3286              0.1328      -2.4745      0.0151
                  DLOG(TAR)            -0.9560              0.0807     -11.8427      0.0000
                  ECM_MN(-1)           -0.1890              0.0599      -3.1549      0.0022

              INVESTMENT NON-OIL      Dep. Var:          DLOG(INVN)
                    Variable          Coefficient         Std. Error   t-Statistic   Prob.

                 DLOG(INVN(-5))         0.3676              0.0894       4.1139      0.0001
                  DLOG(FD(-4))          1.2229              0.2812       4.3496      0.0000
                  DLOG(RMT,2)           0.4370              0.1163       3.7568      0.0003
                   DLOG(YO)             1.1833              0.4365       2.7108      0.0081
                 DLOG(BUS(-4),2)       -1.0336              0.2989      -3.4577      0.0008
                    D(RD(-8))          -0.0078              0.0026      -3.0529      0.0030
                 DLOG(REER(-9))         0.4031              0.1892       2.1302      0.0359
                 DLOG(GDS(-1))          0.9435              0.2159       4.3711      0.0000
                  ECM_INVN(-1)         -0.6834              0.2189      -3.1220      0.0024

                INVESTMENT OIL        Dep. Var:          DLOG(INVO)
                    Variable          Coefficient         Std. Error   t-Statistic   Prob.

                 DLOG(INVO(-5))         0.4609              0.0820       5.6191      0.0000
                  DLOG(FD(-4))          1.2047              0.2863       4.2083      0.0001
                  DLOG(RMT,2)           0.2890              0.1082       2.6715      0.0089
                 DLOG(BUS(-7),2)       -0.7300              0.2565      -2.8456      0.0055
                    D(RD(-8))          -0.0066              0.0027      -2.4217      0.0174
                 DLOG(REER(-8))         0.3822              0.1904       2.0076      0.0476
                 DLOG(GDS(-1))          1.1606              0.1645       7.0547      0.0000
                  ECM_INVO(-1)         -0.8759              0.1508      -5.8074      0.0000

Source: Regression results

                                                    57
www.iiste.org


                                                                                                   Table 2: Baseline simulation experiment of macroeconomic effects of Migrants’ remittances


                                                                                                                                                                                                                                               5 per cent                                                                                   15 per cent
                                                                                                                                                                                               Element
                                                                                                                                                                                                           CF     CN     CO      DD     INV      INVN       INVO       M      MC      MN        NX     CF      CN     CO      DD     INV       INVN       INVO       M      MC      MN      NX


                                                                                                                                                                                                                                                                                                                                                                                                   Source: Simulation of macroeconomic model of Migrant remittances inflow to Nigeria.
                                                                                                                                                                                                 1984      3.1    2.2    2.7    -9.8   -36.5      -37.5     -34.5     -8.8     4.5   -13.0    -12.9    3.7   2.63     3.2    -9.7   -36.3       -37.3      -34.3    -8.8     4.5    -13     -13
                                                                                                                                                                                                 1985    12.3     6.0    9.6     4.0   -21.4      -11.3      -40.6   23.0    68.4      5.8      2.5   13.6   6.87    10.8     4.6   -20.2        -10       -39.9   25.9    71.2      8.7     2
                                                                                                                                                                                                 1986     -1.8   -1.8   -1.8   -10.8   -42.8      -36.9     -59.5    74.7    133.1   39.5     -18.8   -1.7   -1.73   -1.7   -10.8   -42.3      -36.5       -59.2   75.2    135.2   39.5     -19
                                                                                                                                                                                                 1987      0.1    5.0    2.1    -6.0   -26.7      -20.9     -52.0    145.2   178.2   111.9    -21.1    0.1   4.96     2.1    -6.1   -26.4       -20.8      -51.9   145.2   178.3   111.9    -22
                                                                                                                                                                                                 1988    19.1    24.5   21.3    -1.4   -11.0       -7.2      -39.3     9.0   14.8      1.4    -50.0   19.1   24.45   21.3    -1.2   -10.9        -7.1      -39.2      9    14.8      1.4    -51
                                                                                                                                                                                                 1989      8.1   10.7    9.2    -6.7   -49.7      -49.6      -50.0   77.7    67.9    92.2     -85.7    8.1   10.66    9.2    -6.9   -49.6       -49.6       -50    77.7    67.9    92.2     -89
                                                                                                                                                                                                 1990    11.2     5.1    8.5    -1.5    -3.2        0.1     -40.2    43.3    63.6    16.7    -515.5   11.2   5.13     8.5    -1.6    -3.2         0.1      -40.1   43.3    63.6    16.7    -712
                                                                                                                                                                                                 1991     -6.3   -5.2   -5.8   -24.2   -35.7      -34.0     -67.6    54.8    43.8    74.9     194.4   -6.3   -5.16   -5.8   -24.5   -35.7        -34       -67.6   54.8    43.8    74.9     183
                                                                                                                                                                                                 1992     -4.7    1.7   -2.0   -14.3   -17.6      -16.7     -52.6     -4.2   -12.8     8.9    29.5    -4.7   1.65     -2    -14.3   -17.6       -16.7      -52.5    -4.2   -12.8     8.9     28


                                                                                                                                                                                                                                                                                                                                                                                                                                                                                         58
                                                                                                                                                                                                 1993    10.4     9.6   10.1     4.3   13.6       14.2       -28.7   12.7      8.4   17.8     23.6    10.4   9.63    10.1     4.3   13.6        14.2       -28.7   12.7      8.4   17.8      23
                                                                                                                                                                                                 1994     -2.9   -5.3   -4.0     4.5   53.6       54.4      -24.0    -23.0   -14.6   -32.4    -21.0   -2.9   -5.25    -4       5    53.6        54.4        -24     -23    -14.6   -32.4    -21
                             ISSN 2224-607X (Paper) ISSN 2225-0565 (Online)


                                                                                                                                                                                                 1995      3.0   -0.9    1.3   -38.8   -35.3      -35.2     -58.4    64.8    74.3    51.5     81.4      3    -0.91    1.3   -39.4   -35.3       -35.2      -58.4   64.8    74.3    51.5      81
                                                                                                                                                                                                 1996      9.6    3.7    7.1   75.7    13.9       13.9        6.1    -41.3   -40.8   -42.1    -41.8    9.6   3.71     7.1   77.7    13.9        13.9        6.1    -41.3   -40.8   -42.1    -42
                                                                                                                                                                                                 1997      2.4    3.7    2.9     2.1     6.8        6.9      -14.0     7.0    -2.3   22.4       5.5    2.4     3.7    2.9     2.1     6.8         6.9       -14       7     -2.3   22.4      6
                                                                                                                                                                                                 1998    -10.0   -5.9   -8.3   -10.9    -3.8       -3.8     -27.3     -1.4   -13.0   13.9      -1.0   -10    -5.87   -8.3    -11     -3.8        -3.8      -27.3    -1.4    -13    13.9      -1
                                                                                                                                                                                                 1999     -8.4   -7.3   -8.0     8.4   -15.6      -15.5     -51.5    -31.8   -34.3   -29.3    -32.8   -8.4   -7.31    -8      8.6   -15.6       -15.5      -51.5   -31.8   -34.3   -29.3    -33
                                                                                                                                                                                                 2000     -5.1   -3.0   -4.2     1.9   24.5       24.5      -27.4    -18.1   -16.0   -20.1    -19.9   -5.1   -2.99   -4.2      2    24.5        24.5       -27.4   -18.1    -16    -20.1    -20
                                                                                                                                                                                                 2001      4.8    8.1    6.3     9.1   -45.5      -45.5      -72.1    -5.4   -14.1     3.1     -2.4    4.8   8.14     6.3     9.1   -45.5       -45.5      -72.1    -5.4   -14.1     3.1     -3
                                                                                                                                                                                                 2002     -5.6   -6.7   -6.1     2.8   139.3      139.3     226.9    -35.5   -45.2   -27.4    -37.8   -5.6   -6.67   -6.1      3    139.3      139.3      226.9    -35.4   -45.2   -27.4    -38
                                                                                                                                                                                                 2003      1.3   -0.2    0.6    -4.9   147.5      147.5     185.7    65.2    49.3    75.0     70.6     1.3    -0.2    0.6    -4.9   147.5      147.5      185.7    65.2    49.3      75      70
Developing Country Studies


                                                                                                                                                                                                 2004     -2.0   -0.6   -1.4   10.8    238.7      238.7     340.7      0.7     9.0    -3.6      1.7    -2    -0.57   -1.4   11.6    238.7      238.7      340.7      0.7      9     -3.6     2
                                                                                                                                                                                                 2005      1.1   -0.4    0.4   13.0    70.5       70.5      131.0     -4.2    -1.1    -6.0     -4.2    1.1   -0.38    0.4   13.6    70.5        70.5        131     -4.2    -1.1     -6      -4
                                                                                                                                                                                                 2006     -2.5   -1.8   -2.2    -8.2   30.3       30.2      120.8    65.7    75.0    59.8     66.8    -2.5   -1.84   -2.2    -7.9   30.3        30.2      120.8    65.7      75    59.8      67
                                                                              Vol 2, No.10, 2012


                                                                                                                                                                                                 2007      0.1   -0.8   -0.3   -20.0   27.9       27.7      193.5    80.1    99.8    66.5     85.3     0.1   -0.76   -0.3   -19.4   27.9        27.7      193.5      80    99.8    66.5      85
                                                                                                                                                                                               Average     1.6    1.7    1.6    -0.9   17.6       18.9       19.4    22.9    29.0    20.3     -12.7    1.6     1.7    1.7    -0.7   17.7        19.0       19.4    23.1    29.2    20.4    -21.7
Developing Country Studies                                                                              www.iiste.org
ISSN 2224-607X (Paper) ISSN 2225-0565 (Online)
Vol 2, No.10, 2012


                   -17.2
                                    Net export


                                                                                       23
                                        Import


                                                                               17.6
                                    Investment


                                                        1.6
                                  Consumption


                                          -0.8
                           Aggregate Economy


                  -20            -10             0                 10         20             30
                                             Percentage distribution


Figure 1: Summary of percentage distribution of aggregate spending effect of remittance

Source: Authors’ estimate based on simulation result


Notes
i
 419” is an acronym given to kind of fraudulent financial practices in Nigeria whereby unsuspecting business
men and women, particularly foreigners, are dispossessed of their money and other financial assets with the ill
intention of helping the victims secure contracts or even facilitate money transfer or claims under the disguise
that the benefactor is or was a minister or any other well connected government official in Nigeria. It is derived
from section 4(19) of the Nigerian Constitution which makes advance fee fraud an offence in the Nigeria
criminal code. Most foreigners and even locals have fallen victims of this crime. It is one of the factors that
present Nigerian emigrants and citizens in a negative sense.
ii
  A quick correlation using remittances in flow and poverty headcount shows that there is a negative correlation
of 0.89 (world) and 0.8 (Sub-Saharan Africa); and for Nigeria there is a positive correlation of about 0.54 from
the period 1985 -2009.
iii
      Prices of food and non-food items are excluded from the equations because the variables are real variables.
iv
  Studies by (Goldberg and Levi, 2008); and (World Bank, 2011) recorded that the average annual growth rate of
remittances inflow to Nigeria from the period 1995-2005; and from 2009-2010 were approximately 15 per cent,
and 5 per cent respectively. These figures were used for simulation.


                                                              59

Mais conteúdo relacionado

Mais procurados

11 william fonta finalpaper--140-149
11 william fonta finalpaper--140-14911 william fonta finalpaper--140-149
11 william fonta finalpaper--140-149Alexander Decker
 
International labour migration
International labour migrationInternational labour migration
International labour migrationpriyesh_karne
 
RECIPIENTS AND CONTRIBUTORS: THE DUEL ROLE OF MIDDLE-INCOME COUNTRIES
RECIPIENTS AND CONTRIBUTORS: THE DUEL ROLE OF MIDDLE-INCOME COUNTRIESRECIPIENTS AND CONTRIBUTORS: THE DUEL ROLE OF MIDDLE-INCOME COUNTRIES
RECIPIENTS AND CONTRIBUTORS: THE DUEL ROLE OF MIDDLE-INCOME COUNTRIESDhaka university
 
Allianz Global Wealth Report
Allianz Global Wealth Report Allianz Global Wealth Report
Allianz Global Wealth Report Open Knowledge
 
World Wealth Report 2010
World Wealth Report 2010World Wealth Report 2010
World Wealth Report 2010Claudio Diniz
 
Impact of-remittances-on-poverty-reduction-on-kenya
Impact of-remittances-on-poverty-reduction-on-kenyaImpact of-remittances-on-poverty-reduction-on-kenya
Impact of-remittances-on-poverty-reduction-on-kenyaoircjournals
 
Foreign Direct Investment and Poverty Reduction in Nigeria
Foreign Direct Investment and Poverty Reduction in NigeriaForeign Direct Investment and Poverty Reduction in Nigeria
Foreign Direct Investment and Poverty Reduction in Nigeriainventionjournals
 
Global migration trends_2015_factsheet
Global migration trends_2015_factsheetGlobal migration trends_2015_factsheet
Global migration trends_2015_factsheetAnita Arias
 
Global Wealth Report 2013
Global Wealth Report 2013Global Wealth Report 2013
Global Wealth Report 2013Credit Suisse
 
Billionaires Report 2016
Billionaires Report 2016Billionaires Report 2016
Billionaires Report 2016Korina Markou
 
World Wealth Report 2010
World Wealth Report 2010World Wealth Report 2010
World Wealth Report 2010Capgemini
 
ubs-pwc-billionaires-report
ubs-pwc-billionaires-reportubs-pwc-billionaires-report
ubs-pwc-billionaires-reportKorina Markou
 
Impact of labour migration on the countries of Eastern neighbourhood
Impact of labour migration on the countries of Eastern neighbourhoodImpact of labour migration on the countries of Eastern neighbourhood
Impact of labour migration on the countries of Eastern neighbourhoodMigrationPolicyCentre
 
Diaspora and Economy: Effects of Global Economic Slowdown on Remittances
Diaspora and Economy: Effects of Global Economic Slowdown on RemittancesDiaspora and Economy: Effects of Global Economic Slowdown on Remittances
Diaspora and Economy: Effects of Global Economic Slowdown on RemittancesMuhammad Sohaib
 
China’s Real Estate Sector
China’s Real Estate Sector China’s Real Estate Sector
China’s Real Estate Sector France Houdard
 
World Wealth Report 2012
World Wealth Report 2012World Wealth Report 2012
World Wealth Report 2012Wealth Partners
 

Mais procurados (19)

11 william fonta finalpaper--140-149
11 william fonta finalpaper--140-14911 william fonta finalpaper--140-149
11 william fonta finalpaper--140-149
 
International labour migration
International labour migrationInternational labour migration
International labour migration
 
RECIPIENTS AND CONTRIBUTORS: THE DUEL ROLE OF MIDDLE-INCOME COUNTRIES
RECIPIENTS AND CONTRIBUTORS: THE DUEL ROLE OF MIDDLE-INCOME COUNTRIESRECIPIENTS AND CONTRIBUTORS: THE DUEL ROLE OF MIDDLE-INCOME COUNTRIES
RECIPIENTS AND CONTRIBUTORS: THE DUEL ROLE OF MIDDLE-INCOME COUNTRIES
 
Allianz Global Wealth Report
Allianz Global Wealth Report Allianz Global Wealth Report
Allianz Global Wealth Report
 
World Wealth Report 2010
World Wealth Report 2010World Wealth Report 2010
World Wealth Report 2010
 
Impact of-remittances-on-poverty-reduction-on-kenya
Impact of-remittances-on-poverty-reduction-on-kenyaImpact of-remittances-on-poverty-reduction-on-kenya
Impact of-remittances-on-poverty-reduction-on-kenya
 
The Euromoney 2012 guide Uruguay
The Euromoney 2012 guide UruguayThe Euromoney 2012 guide Uruguay
The Euromoney 2012 guide Uruguay
 
HUMAN MIGRATION
HUMAN MIGRATIONHUMAN MIGRATION
HUMAN MIGRATION
 
Journal Dr Subair
Journal Dr SubairJournal Dr Subair
Journal Dr Subair
 
Foreign Direct Investment and Poverty Reduction in Nigeria
Foreign Direct Investment and Poverty Reduction in NigeriaForeign Direct Investment and Poverty Reduction in Nigeria
Foreign Direct Investment and Poverty Reduction in Nigeria
 
Global migration trends_2015_factsheet
Global migration trends_2015_factsheetGlobal migration trends_2015_factsheet
Global migration trends_2015_factsheet
 
Global Wealth Report 2013
Global Wealth Report 2013Global Wealth Report 2013
Global Wealth Report 2013
 
Billionaires Report 2016
Billionaires Report 2016Billionaires Report 2016
Billionaires Report 2016
 
World Wealth Report 2010
World Wealth Report 2010World Wealth Report 2010
World Wealth Report 2010
 
ubs-pwc-billionaires-report
ubs-pwc-billionaires-reportubs-pwc-billionaires-report
ubs-pwc-billionaires-report
 
Impact of labour migration on the countries of Eastern neighbourhood
Impact of labour migration on the countries of Eastern neighbourhoodImpact of labour migration on the countries of Eastern neighbourhood
Impact of labour migration on the countries of Eastern neighbourhood
 
Diaspora and Economy: Effects of Global Economic Slowdown on Remittances
Diaspora and Economy: Effects of Global Economic Slowdown on RemittancesDiaspora and Economy: Effects of Global Economic Slowdown on Remittances
Diaspora and Economy: Effects of Global Economic Slowdown on Remittances
 
China’s Real Estate Sector
China’s Real Estate Sector China’s Real Estate Sector
China’s Real Estate Sector
 
World Wealth Report 2012
World Wealth Report 2012World Wealth Report 2012
World Wealth Report 2012
 

Destaque

The Impact of Consumer Confidence and Expectation on Consumption in Nigeria: ...
The Impact of Consumer Confidence and Expectation on Consumption in Nigeria: ...The Impact of Consumer Confidence and Expectation on Consumption in Nigeria: ...
The Impact of Consumer Confidence and Expectation on Consumption in Nigeria: ...Moses Oduh
 
Understanding the Predictors of Consumer Sentiments: Lessons for Inflation Ta...
Understanding the Predictors of Consumer Sentiments: Lessons for Inflation Ta...Understanding the Predictors of Consumer Sentiments: Lessons for Inflation Ta...
Understanding the Predictors of Consumer Sentiments: Lessons for Inflation Ta...Moses Oduh
 
Trade Openness and Output variability in Nigeria: Implications for EU-ACP Eco...
Trade Openness and Output variability in Nigeria: Implications for EU-ACP Eco...Trade Openness and Output variability in Nigeria: Implications for EU-ACP Eco...
Trade Openness and Output variability in Nigeria: Implications for EU-ACP Eco...Moses Oduh
 
Homogenous Economic Policy and Heterogeneous Consumer Economy: Empirical Anal...
Homogenous Economic Policy and Heterogeneous Consumer Economy: Empirical Anal...Homogenous Economic Policy and Heterogeneous Consumer Economy: Empirical Anal...
Homogenous Economic Policy and Heterogeneous Consumer Economy: Empirical Anal...Moses Oduh
 
Modelling the Long Run Determinants of Foreign Portfolio in Nigeria
Modelling the Long Run Determinants of Foreign Portfolio in NigeriaModelling the Long Run Determinants of Foreign Portfolio in Nigeria
Modelling the Long Run Determinants of Foreign Portfolio in NigeriaMoses Oduh
 
’’norma dan adat istiadat keluarga membentuk pribadi mahasiswa berbudaya”
’’norma dan adat istiadat keluarga membentuk pribadi mahasiswa berbudaya”’’norma dan adat istiadat keluarga membentuk pribadi mahasiswa berbudaya”
’’norma dan adat istiadat keluarga membentuk pribadi mahasiswa berbudaya”Candra Waskito
 
Norma dan Adat Istiadat Keluarga Membentuk Pribadi Mahasiswa Berbudaya
Norma dan Adat Istiadat Keluarga Membentuk Pribadi Mahasiswa BerbudayaNorma dan Adat Istiadat Keluarga Membentuk Pribadi Mahasiswa Berbudaya
Norma dan Adat Istiadat Keluarga Membentuk Pribadi Mahasiswa BerbudayaCandra Waskito
 
makalah ibd periode 3 peran budaya daerah menciptakan pendapatan asli daerah
makalah ibd periode 3 peran budaya daerah menciptakan pendapatan asli daerah makalah ibd periode 3 peran budaya daerah menciptakan pendapatan asli daerah
makalah ibd periode 3 peran budaya daerah menciptakan pendapatan asli daerah Candra Waskito
 

Destaque (9)

The Impact of Consumer Confidence and Expectation on Consumption in Nigeria: ...
The Impact of Consumer Confidence and Expectation on Consumption in Nigeria: ...The Impact of Consumer Confidence and Expectation on Consumption in Nigeria: ...
The Impact of Consumer Confidence and Expectation on Consumption in Nigeria: ...
 
Understanding the Predictors of Consumer Sentiments: Lessons for Inflation Ta...
Understanding the Predictors of Consumer Sentiments: Lessons for Inflation Ta...Understanding the Predictors of Consumer Sentiments: Lessons for Inflation Ta...
Understanding the Predictors of Consumer Sentiments: Lessons for Inflation Ta...
 
Trade Openness and Output variability in Nigeria: Implications for EU-ACP Eco...
Trade Openness and Output variability in Nigeria: Implications for EU-ACP Eco...Trade Openness and Output variability in Nigeria: Implications for EU-ACP Eco...
Trade Openness and Output variability in Nigeria: Implications for EU-ACP Eco...
 
Homogenous Economic Policy and Heterogeneous Consumer Economy: Empirical Anal...
Homogenous Economic Policy and Heterogeneous Consumer Economy: Empirical Anal...Homogenous Economic Policy and Heterogeneous Consumer Economy: Empirical Anal...
Homogenous Economic Policy and Heterogeneous Consumer Economy: Empirical Anal...
 
Modelling the Long Run Determinants of Foreign Portfolio in Nigeria
Modelling the Long Run Determinants of Foreign Portfolio in NigeriaModelling the Long Run Determinants of Foreign Portfolio in Nigeria
Modelling the Long Run Determinants of Foreign Portfolio in Nigeria
 
’’norma dan adat istiadat keluarga membentuk pribadi mahasiswa berbudaya”
’’norma dan adat istiadat keluarga membentuk pribadi mahasiswa berbudaya”’’norma dan adat istiadat keluarga membentuk pribadi mahasiswa berbudaya”
’’norma dan adat istiadat keluarga membentuk pribadi mahasiswa berbudaya”
 
Norma dan Adat Istiadat Keluarga Membentuk Pribadi Mahasiswa Berbudaya
Norma dan Adat Istiadat Keluarga Membentuk Pribadi Mahasiswa BerbudayaNorma dan Adat Istiadat Keluarga Membentuk Pribadi Mahasiswa Berbudaya
Norma dan Adat Istiadat Keluarga Membentuk Pribadi Mahasiswa Berbudaya
 
Makalah
MakalahMakalah
Makalah
 
makalah ibd periode 3 peran budaya daerah menciptakan pendapatan asli daerah
makalah ibd periode 3 peran budaya daerah menciptakan pendapatan asli daerah makalah ibd periode 3 peran budaya daerah menciptakan pendapatan asli daerah
makalah ibd periode 3 peran budaya daerah menciptakan pendapatan asli daerah
 

Semelhante a Does the End Use of Remittance Matter? A Macro Simulation of the Nigerian Economy

Analysis On The Result And Implication Of The Policy
Analysis On The Result And Implication Of The PolicyAnalysis On The Result And Implication Of The Policy
Analysis On The Result And Implication Of The PolicyCrystal Torres
 
Analysis of the effects of capital flight on economic growth evidence from ni...
Analysis of the effects of capital flight on economic growth evidence from ni...Analysis of the effects of capital flight on economic growth evidence from ni...
Analysis of the effects of capital flight on economic growth evidence from ni...Alexander Decker
 
Increase of extreme poverty and hunger in the context of millennium developme...
Increase of extreme poverty and hunger in the context of millennium developme...Increase of extreme poverty and hunger in the context of millennium developme...
Increase of extreme poverty and hunger in the context of millennium developme...Alexander Decker
 
IMF report on djibouti all sector 2012
IMF report on djibouti all sector 2012IMF report on djibouti all sector 2012
IMF report on djibouti all sector 2012Parti Djibouti
 
Features of globalization and india in global economy
Features of globalization and india in global economyFeatures of globalization and india in global economy
Features of globalization and india in global economyRajan Kumar Upadhyay
 
EFFECT OF NON BANK FINANCIAL INSTITUTIONS CREDIT ON POVERTY
EFFECT OF NON BANK FINANCIAL INSTITUTIONS CREDIT ON POVERTYEFFECT OF NON BANK FINANCIAL INSTITUTIONS CREDIT ON POVERTY
EFFECT OF NON BANK FINANCIAL INSTITUTIONS CREDIT ON POVERTYMoses Mutharime Mwito
 
Rwanda Case Study
Rwanda Case StudyRwanda Case Study
Rwanda Case StudyMandy Cross
 
Pub impact of high population on nigerian economy
Pub impact of high population on nigerian economyPub impact of high population on nigerian economy
Pub impact of high population on nigerian economyOnyeka Okwuosa
 
The effeect of illicit financial flows on time to reach the fouth mdg in sub ...
The effeect of illicit financial flows on time to reach the fouth mdg in sub ...The effeect of illicit financial flows on time to reach the fouth mdg in sub ...
The effeect of illicit financial flows on time to reach the fouth mdg in sub ...Dr Lendy Spires
 

Semelhante a Does the End Use of Remittance Matter? A Macro Simulation of the Nigerian Economy (20)

Analysis On The Result And Implication Of The Policy
Analysis On The Result And Implication Of The PolicyAnalysis On The Result And Implication Of The Policy
Analysis On The Result And Implication Of The Policy
 
Analysis of the effects of capital flight on economic growth evidence from ni...
Analysis of the effects of capital flight on economic growth evidence from ni...Analysis of the effects of capital flight on economic growth evidence from ni...
Analysis of the effects of capital flight on economic growth evidence from ni...
 
PROJECT COMPILATION_2
PROJECT COMPILATION_2PROJECT COMPILATION_2
PROJECT COMPILATION_2
 
A Conceptual Relationship between Microfinance and Poverty Reduction in Nigeria
A Conceptual Relationship between Microfinance and Poverty Reduction in NigeriaA Conceptual Relationship between Microfinance and Poverty Reduction in Nigeria
A Conceptual Relationship between Microfinance and Poverty Reduction in Nigeria
 
Increase of extreme poverty and hunger in the context of millennium developme...
Increase of extreme poverty and hunger in the context of millennium developme...Increase of extreme poverty and hunger in the context of millennium developme...
Increase of extreme poverty and hunger in the context of millennium developme...
 
IMF report on djibouti all sector 2012
IMF report on djibouti all sector 2012IMF report on djibouti all sector 2012
IMF report on djibouti all sector 2012
 
Empirical Appraisal of Poverty-Unemployment Relationship in Nigeria
Empirical Appraisal of Poverty-Unemployment Relationship in NigeriaEmpirical Appraisal of Poverty-Unemployment Relationship in Nigeria
Empirical Appraisal of Poverty-Unemployment Relationship in Nigeria
 
Remittances
RemittancesRemittances
Remittances
 
Glob
GlobGlob
Glob
 
Sub-Saharan Africa Economic Outlook
Sub-Saharan Africa Economic OutlookSub-Saharan Africa Economic Outlook
Sub-Saharan Africa Economic Outlook
 
Features of globalization and india in global economy
Features of globalization and india in global economyFeatures of globalization and india in global economy
Features of globalization and india in global economy
 
EFFECT OF NON BANK FINANCIAL INSTITUTIONS CREDIT ON POVERTY
EFFECT OF NON BANK FINANCIAL INSTITUTIONS CREDIT ON POVERTYEFFECT OF NON BANK FINANCIAL INSTITUTIONS CREDIT ON POVERTY
EFFECT OF NON BANK FINANCIAL INSTITUTIONS CREDIT ON POVERTY
 
Rwanda Case Study
Rwanda Case StudyRwanda Case Study
Rwanda Case Study
 
Pub impact of high population on nigerian economy
Pub impact of high population on nigerian economyPub impact of high population on nigerian economy
Pub impact of high population on nigerian economy
 
Remittance Report
Remittance ReportRemittance Report
Remittance Report
 
DESA News, July 2012
DESA News, July 2012DESA News, July 2012
DESA News, July 2012
 
International Capital Flows and Inclusive Growth in Nigeria
International Capital Flows and Inclusive Growth in NigeriaInternational Capital Flows and Inclusive Growth in Nigeria
International Capital Flows and Inclusive Growth in Nigeria
 
Impact of Monetary Policy on Capital Inflows in Nigeria
Impact of Monetary Policy on Capital Inflows in NigeriaImpact of Monetary Policy on Capital Inflows in Nigeria
Impact of Monetary Policy on Capital Inflows in Nigeria
 
Globalization
GlobalizationGlobalization
Globalization
 
The effeect of illicit financial flows on time to reach the fouth mdg in sub ...
The effeect of illicit financial flows on time to reach the fouth mdg in sub ...The effeect of illicit financial flows on time to reach the fouth mdg in sub ...
The effeect of illicit financial flows on time to reach the fouth mdg in sub ...
 

Mais de Moses Oduh

Macroeconomic Models and the Challenge of Growth in African Economies: The Co...
Macroeconomic Models and the Challenge of Growth in African Economies: The Co...Macroeconomic Models and the Challenge of Growth in African Economies: The Co...
Macroeconomic Models and the Challenge of Growth in African Economies: The Co...Moses Oduh
 
The Dynamics of Poverty and Income Distribution: Is the Nigerian Middle Class...
The Dynamics of Poverty and Income Distribution: Is the Nigerian Middle Class...The Dynamics of Poverty and Income Distribution: Is the Nigerian Middle Class...
The Dynamics of Poverty and Income Distribution: Is the Nigerian Middle Class...Moses Oduh
 
The Impact of ICT Development on Poverty in Nigeria
The Impact of ICT Development on Poverty in NigeriaThe Impact of ICT Development on Poverty in Nigeria
The Impact of ICT Development on Poverty in NigeriaMoses Oduh
 
Revenue Implications of Nigeria’s Tax System in Nigeria
Revenue Implications of Nigeria’s Tax System in NigeriaRevenue Implications of Nigeria’s Tax System in Nigeria
Revenue Implications of Nigeria’s Tax System in NigeriaMoses Oduh
 
Economic Partnership Agreements, Common External Tariff and Prospects for …
Economic Partnership Agreements, Common External Tariff and Prospects for …Economic Partnership Agreements, Common External Tariff and Prospects for …
Economic Partnership Agreements, Common External Tariff and Prospects for …Moses Oduh
 
Determinants of Willingness to Pay for Mobile Telecommunications Services in ...
Determinants of Willingness to Pay for Mobile Telecommunications Services in ...Determinants of Willingness to Pay for Mobile Telecommunications Services in ...
Determinants of Willingness to Pay for Mobile Telecommunications Services in ...Moses Oduh
 

Mais de Moses Oduh (6)

Macroeconomic Models and the Challenge of Growth in African Economies: The Co...
Macroeconomic Models and the Challenge of Growth in African Economies: The Co...Macroeconomic Models and the Challenge of Growth in African Economies: The Co...
Macroeconomic Models and the Challenge of Growth in African Economies: The Co...
 
The Dynamics of Poverty and Income Distribution: Is the Nigerian Middle Class...
The Dynamics of Poverty and Income Distribution: Is the Nigerian Middle Class...The Dynamics of Poverty and Income Distribution: Is the Nigerian Middle Class...
The Dynamics of Poverty and Income Distribution: Is the Nigerian Middle Class...
 
The Impact of ICT Development on Poverty in Nigeria
The Impact of ICT Development on Poverty in NigeriaThe Impact of ICT Development on Poverty in Nigeria
The Impact of ICT Development on Poverty in Nigeria
 
Revenue Implications of Nigeria’s Tax System in Nigeria
Revenue Implications of Nigeria’s Tax System in NigeriaRevenue Implications of Nigeria’s Tax System in Nigeria
Revenue Implications of Nigeria’s Tax System in Nigeria
 
Economic Partnership Agreements, Common External Tariff and Prospects for …
Economic Partnership Agreements, Common External Tariff and Prospects for …Economic Partnership Agreements, Common External Tariff and Prospects for …
Economic Partnership Agreements, Common External Tariff and Prospects for …
 
Determinants of Willingness to Pay for Mobile Telecommunications Services in ...
Determinants of Willingness to Pay for Mobile Telecommunications Services in ...Determinants of Willingness to Pay for Mobile Telecommunications Services in ...
Determinants of Willingness to Pay for Mobile Telecommunications Services in ...
 

Does the End Use of Remittance Matter? A Macro Simulation of the Nigerian Economy

  • 1. Developing Country Studies www.iiste.org ISSN 2224-607X (Paper) ISSN 2225-0565 (Online) Vol 2, No.10, 2012 Does the End Use of Remittance Matter? A Macro Simulation of the Nigerian Economy Moses O. Oduh1*, and Nathaniel E. Urama2 1. Debt Management Office (DMO), The Presidency, Abuja, Nigeria 2. Department of Economics, School of Politics, Economics and International Relations, University of Reading, United Kingdom (unathaniel@ymail.com) *E-mail of corresponding Author: oduhmoses@yahoo.com Abstract International remittance has changed the landscape of international migration from brain drain to brain circulation; and provided the developing countries the opportunity to raise alternative sources of consumption and investment financing. However, the tendency that remittances will be poverty-reducing as well as growth- financing depends on its end use, particularly in import-dependent economies. The importance of focusing attention on the use of remittances is to checkmate early signs of another round of potential Dutch Diseases Syndrome which bedeviled the Nigeria’s oil sector from occurring in remittance. Macro-econometric model with six behavioral equations and six identities where used to estimate and simulate the effects of remittances inflow on aggregate demand in Nigeria. The simulation result shows that the much touted poverty-reducing effect of remittances is non-growth-financing for import-dependent country like Nigeria because of its negative impact on current account balance; despite its positive effects on private consumption and investment. Keywords: Nigeria, remittance, consumption, investment, import demand, macroeconometric model 1. Introduction Nigeria like most developing countries has had its fair share of political instability and economic stagnation that consequently resulted in upsurge in the volume of migrants and brain drain to the outside world, which in itself, constituted a drag in the socioeconomic development of Nigeria. In 2010, statistics shows that Nigeria has a pull of stock of emigrants of about 1.0 million with the United States, the United Kingdom, Chad, Cameroon, Italy, Benin, Côte d’Ivoire, Spain, Sudan, Niger being the top ten highest recipients of Nigerian emigrants (World Bank, 2011). In the past, Nigerian migrants were only portrayed in the negative sense either in hard drug related cases, money laundering, child trafficking and financial crimes or “419i”, but today, remittances from Nigerian migrants have become the single largest source of capital flow and a contributor to household welfare and poverty reduction. Available data shows that remittance is the second largest source of foreign exchange next to oil. The work of (Goldberg and Levi, 2008) recorded that remittances inflow to Nigeria was about US$3.2 billion in 2005, 14.8 per cent annual increase from 1995-2005, while the CBN statistics shows that it increased to US$18 billion in 2007, 50 per cent higher than the World Bank estimate in the same period. If the CBN official estimate is correct, then Nigeria is the fifth largest destination in the world behind India, China, Mexico, and Philippine. The current World Bank report in 2011 shows that it hovers around $10 billion, about 5.3 per cent increase from the 2009 estimate, and more than three-times net FDI inflows; thus, making it the world’s top tenth recipient country in 2010. Globally, the contribution of remittances both as a source of external funding and poverty reduction, especially in the developing economies continues to attract important economic discuss. For example, see studies by (Odimuko and Riddell, 1979); (Ratha, 2004); (Nwajiuba, 2005); (Ghosh, 2006); (Ambrosius, 2006); (Kireyev, 2006); (Orozco, 2007); (Gupta, Pattillo, and Wagh, 2007); (Lindley, 2008); (Ratha, 2009); (Ratha, Sanket, and Vijayalakshmi, 2009); (Purnima Mane, 2011); (Sackey, 2011); and (Gupta and Tyagi, 2012). According to the World Bank report in 2011 there are 215.8 million migrants around the world, representing about 3.2 per cent of the world’s population. It further shows that since 1995 the global inward remittances amounted to more than $2 746.9 billion of which 71 per cent or $1 950.5 went to the developing economies. The top ten destinations include: India ($55.0 billion); China ($51.0 billion); Mexico ($22.6 billion); Philippines ($21.3 billion); France 48
  • 2. Developing Country Studies www.iiste.org ISSN 2224-607X (Paper) ISSN 2225-0565 (Online) Vol 2, No.10, 2012 ($15.9 billion); Germany ($11.6 billion), Bangladesh ($11.1 billion); Belgium ($10.4 billion), Spain ($10.2 billion); and Nigeria ($10.0 billion). Of interest also is that Sub-Saharan Africa SSA accounts for about 10 per cent of the world’s stock of migrants representing 2.5 per cent of its total population; and remitting more than $120 billion, equivalent to 4 per cent of the world remittances and 6 per cent of developing country. Of this, Nigeria accounts for about 50 per cent of the total remittances inflow to SSA and 77 per cent of the total remittance inflow to West African Countries. The questions however, without prejudice to the existing studies which suggest that remittance is growth- enhancing and poverty-reducing, is whether this huge inflow actually translated into poverty reduction and economic growth? Does the story of growth and poverty at the global, Sub-Saharan Africa SSA, and Nigeria in particular support these findings; or is it that remittance has poverty-reducing potential that is yet to be harnessed. Perhaps a brief overview of the trends in poverty vis-à-vis remittance inflow will help clear the air on the poverty-reducing potentials and poverty-reducing impact of remittances in the destination countries. This will further buttress the points made by studies like (Adams Jr., Richard H, Cuecuecha, Alfredo; and Page, John, 2009) which question the uses of remittance as distinct from remittance impact analysis. As was rightly observed by (Ratha, 2004) that there is tremendous potential for using remittances to encourage development in countries. Yet, though much progress has been made toward understanding remittances, their potential impact is significantly reduced. Thus, development policymakers will need much more research on how to use remittances so that they positively contribute to migrants’ home communities and countries. At the global and regional level, using the 2005 PPP and $1.25/day poverty line, one observes a negative correlationi between poverty headcount in the world and SSA and remittance inflow. Globally, remittance increased from 0.3 per cent in 1984 to about 18 per cent and 61 per cent in the periods 1993 and 2008 respectively; while poverty headcount fell from 52 per cent in 1981 to about 41 per cent and 22 per cent in 1993 and 2008 respectively; for Sub-Saharan Africa poverty headcount rose from 53 per cent in 1981 to 59 per cent in 1993 before declining to 48 per cent in 2008, as remittances increased from -19 per cent in 1984 to 39 per cent and 127 per cent in 1993 and 2008 respectively; while for Nigeria poverty headcount rose from 54 per cent in 1985 to 63 per cent and 68 per cent in 2003 and 2009 respectively. Remittances inflow rose from (-17 per cent) in 1981 to (-12 per cent) and 8 per cent in 2003 and 2008 respectively. What it means is that at the global and regional level remittance may have reduced poverty, but within countries poverty is still pervasive despite the increase in remittance. In the foregoing context, and given the peculiarity of the developing countries as consuming, and in most cases import-dependent; study on remittance-economy interaction is in the second phase of enquiry which attempts to answer the question about the uses of remittance. Inquiry about the uses of remittances predisposes that its use determines its socioeconomic effect. And it is in this context that the current student attempts to examine how remittance inflow into Nigeria is used as against the numerous impact studies in Nigeria. 1.2 Policy gap in perspectives The Excitement about the supposed negative a priori relationship between remittance and poverty assumed-away the fact that this straight jacket relationship can only hold in a closed economy; which even when assumed negates the nomenclature of remittance from existing in the first place. Ideally, putting away trade effects, one can, without any contradiction generate the kind of conclusion that remittance is both poverty-reducing and growth-enhancing. Under such strict, but unrealistic assumption, remittance will reduce poverty; impact savings and investment; and consequently enhance economic growth. But in a global economy, the interaction between remittance and the aggregate economy is beyond the rule-of-thumb approach, considering the positive relationship between increase in income and demand for import and the attendant exchange rate and potential Dutch Disease Syndrome DDS effects - Nigerians are living witnesses to the oil-poverty-growth paradox and the resources curse hypothesis. Notwithstanding the conclusions that remittances inflow to Nigeria is poverty-reducing, its growth-financing potential poses another challenging research question; given the country’s non-inclusive growth and import- dependent posture. On the interaction between remittances, poverty and the aggregate economy, it is evident that the country receives about 50 per cent of the total remittance inflow to SSA, yet poverty increased from 54 per cent in 2004 to about 69 per cent and 72 per cent in 2010 and 2011 respectively. Thus, if it is true that remittance reduces poverty, its impact is short-lived and unsustainable and there could be a negative shockwave from the 49
  • 3. Developing Country Studies www.iiste.org ISSN 2224-607X (Paper) ISSN 2225-0565 (Online) Vol 2, No.10, 2012 aggregate economy such that the macroeconomic effects of remittance out-clouded the poverty reducing effects, resulting to welfare loss and increase in poverty in the long run. Consequent upon that is the need to address the question about what recipients do with remittance, particularly given that consumer goods constitute more than 43 per cent of Nigeria’s total import demand. While the current study does not align with the opinion that remittance inflow to Nigeria has attracted little attention from writers; it rather posits that existing studies as tremendous and overwhelming as they are, were either targeted mainly at the household level – poverty and inequality; while the macro components fairly dealt with either the determinants of remittances or the generalization of the impact of remittances on growth. Like most studies in Sub-Saharan Africa SSA, its long-term interaction with macro economy is unclear. Studies by (Lindley, 2008); and (Gupta, Pattillo, and Wagh, 2007) respectively observed that in spite of the fact that SSA constitutes about 8.4 per cent of the world’s 190 million stock of migrants in the past 20 years, the long-term development potentials impacts of what remains after consumption is unclear; nonetheless studies relying on household data from different countries yield some insights into core, private intra-family or intra-community income transfers that directly address poverty. What it shows is that remittance in a wider sense transcend micro impact assessment and may have more serious implications for major macroeconomic variables like private consumption expenditure, domestic price level, exchange rate, interest rate, trade flow, and consequently on the aggregate economy- which would ultimately affect internal and external balances of the recipient country. Moreover, in a small open economy such as Nigeria with a shallow foreign exchange market and insufficient instruments for the conduct of monetary policy resulting from low credibility and autonomy of the central bank, the sheer magnitude of foreign currency inflows and their pronounced seasonal pattern could create significant uncertainties for monetary management, large impulsive transmission mechanism and the attendant overshooting of reserve money targets and higher inflation (Kireyev, 2006). And finally, because remittances will respond to changes in economic conditions in both the receiving and originating countries, such as the current global financial crunch, it tends to act as a source of external shock resulting to balance of payment crisis to the receiving economy (Loser, Lockwood, Minson, and Balcazar, 2006). Given this, it is reasonable to suppose that there are two (positive and negative) opposing effects of remittance on the recipient economy whose net outcome depends on the relative strength of the push (factor that push household to poverty) and pull (factors that push them out of poverty) factors. The current study attempts to answer the question bothering on what households receiving remittances do with it; and whether remittance is growth-financing. It used quarterly macro level data from Central Bank of Nigeria’s Macro-econometric Model of the Nigerian Economy 1981-2007 to add some insights into Nigeria country-specific role of remittances; their uses and how it impacts on the aggregate economy. 1.3 Objective and research problem Generally, the purpose of this study is to ascertain the impact of international remittance inflow on aggregate spending in Nigeria. Specifically, it addresses the following objectives: (1) evaluating the impact of remittances on food and non-food consumption; oil and non-oil investment; and consumer and non-consumer import demand; (2) identifying what household do with remittance through a scenario building using macro-econometric model simulation. 2. Review of Studies on Remittances in Nigeria There are three generic groups of studies on remittances in Nigeria: analytical issues; micro; and macro level studies. Analytically, (Odimuko and Riddell, 1979) dealt with urban-rural cash remittances in the South-Eastern Nigeria; (Nwajiuba, 2005) exemplified the general characteristics of migrants in the southern Nigeria; while (Hernández-Coss and Bun, 2007) studied the analytical issues relating to UK-Nigeria remittances corridor. In another study, (Chukwudi, Olise, and Ewuim, 2011) streesed that migrants’ remittal enterprise plays a role in investment and enterprise growth; and sorts Governments support and protection for Nigerian migrants in order to protect and respect their human rights, and to ensure that they are not exploited; and that their earnings in the host countries are safeguarded. At the micro level (Chukwuone, Amaechina, Iyoko, Enebeli-Uzor, and Okpukpara, 2007); (Ajayi, et al., 2009); (Olowa O. , 2009); (Odozia, Awoyemia, and Omonona, 2010 ); (Fonta, Onyukwu, and Nwosu, 2011); (Babatunde and Martinetti, 2011); and (Olowa and Shittu, 2012) studied the impact of remittances on poverty 50
  • 4. Developing Country Studies www.iiste.org ISSN 2224-607X (Paper) ISSN 2225-0565 (Online) Vol 2, No.10, 2012 and inequality; and concluded that remittance reduces poverty and inequality, hence welfare-improving; but (Olowa O. , 2009) went beyond the welfare implication and concluded that, it is counter-cyclical; which also has implication for economic growth. Apart from the consumption consequence of remittances, (Osili, 2005) investigated migrants’ housing investments in their communities of origin, aligning with literature that seeks to understand the economic ties that migrants maintain with their origin communities. Among the conclusions in the study is that migrants to a very large extent have ties with their respective communities by channelling part of the remittance to house investment. The house investment reduces remittances to households at home, but rises as the house is completed. Thus, the importance of remittances is its investment and altruistic use. The macro counterpart was concerned with the determinants of remittances inflow. That was the primary focus of (Ojapinwa, 2012) which identified real GDP, labour market situation and population growth rate as major determinants of remittances. Other macro level analyses include (Uadiale, Oke, and Okpala, 2011) which found a posiitve link between remittances and financial through its impact on loanable funds; (Kure and Nwosu, 2008); (Udah, 2011) found a positive impact of remittances on economic macroeconomic, via human and material investment. One take from the foregoing is that the outright conclusion about the positive impacts of remittances inflow on growth and poverty-reducing seems to have ignored the outright consequences of increased in income and the growing import demand in Nigeria. Summary of Nigeria’s trade statistics shows that aside oil it has a consistent unfavourable balance of payment since the late 1970s. To cap it all, bulk (43 per cent) of the total import into the country is consumer goods; while capital and intermediate goods account for about 40 per cent and 17 per cent respectively. If higher proportion of remittance inflow is spent on consumption, particularly on import; where will the growth-financing impact of remittance come from so as to reduce poverty? This has question has pushed the frontier of research away from impact analysis to the uses of remittances. 3. Methodology To simulate the aggregate spending effects of remittance, a four-sector Keynesian dynamic macro econometric model with six behavioural equations and six identities were estimated. The behavioural equations are: consumption (food and non-food); investment (oil and non-oil); and import demand (consumer and non- consumer goods) equations; while the identities are: private consumption and investment; net export, government spending, and aggregate demand. All the variables are real variables. In answering the question on what households do with remittances, four uses namely, consumption; investment; health; and education spending were identified by (Ratha, 2009). However the NBS data generating process DGP included health and education spending, together with clothing and footwear, rent, fuel/light, household goods, transport, water, entertainment, and other services as constituting the non-food consumption (NBS, 2012). The study follows this classification which appeals to Keynesian DD model. 3.1 The Model 3.1.1 Household (consumption block) Private consumption (CO) is disaggregated into food consumption (CF) and non-food consumption (CN). The predictors of consumption in Nigeria (combining economic theory and Nigeria country-specific peculiarities- both from research and intuitive reasoning) include income (Yi), pricesii of core (non-food) and non-core items (food items), exchange rate (REER), remittances (RMT), and deposit rate (SVR)- controlling for savings. The predictors of food and non-food consumption are specified in equations (1) and (2), while case (3) is the consumption (CO) identity that closes the private consumption block. CF=α 0 +α1REER + α 2 Yi+α 3 RMT+α 4SVR+α 5G+µ1 (1) CN=α 6 +α 7 REER + α 8 Yi+α 9 RMT + α10 SVR + α11G + µ2 (2) CO=CF+CN (3) 3.1.2 Firm (investment block) The model of private investment (INV) relied, in addition to the traditional Keynesian approach, on irreversibility theory of investment which incorporate business environment. We found this theory specifically 51
  • 5. Developing Country Studies www.iiste.org ISSN 2224-607X (Paper) ISSN 2225-0565 (Online) Vol 2, No.10, 2012 appealing in the case of Nigeria, given that interest rate in Nigeria is over identified; and coupled with the weak link between interest rate and the real sector which prompted the use of quantitative easing by the monetary Authorities to stimulate the economy. Determinants of private investment is modelled to include average lending rate (RD), domestic output (YO), real exchange rate (REER), gross domestic savings (GDS); financial deepening (FD) to account for mobilization of funds; remittance inflow (RMT), and business environment (macroeconomic volatility). Cases 4 and 5 are the behavioural equations; the identity is defined in case (6). The sector is disaggregated into oil (INVO) and non-oil (INVN) investment. INVN=β 0 +β1RD+β 2 REER+β 3 FD+β 4 RMT+β 5 YO + β 6 BUS+β 7 GDS+μ 3 (4) INVO=β8 +β 9 RD+β10 REER+β11FD+β12 RMT+β13 BUS+β14 GDS+μ 4 (5) INV=INVO+INVN (6) 3.1.3 External sector (External block) Import (M) is disaggregated into consumer (MC) and non-consumer (MN) goods. Non-consumer goods are intermediate and capital goods. Import demand is modelled to depend on real effective exchange rate (REER), income (Yi), remittances (RMT), and international trade restrictions captured with implicit tariff rate (TAR). In addition, net export (NX) is specified as the difference between export (X) and import demand (M). Accordingly, equations 7 (import of consumer goods) and 8 (import of non-consumer goods) are the predictors of import demand. Cases 8 and 9 are import and net export identities. MC=χ 0 +χ 2 REER+χ 3 Yi+χ 4 RMT+χ 5 TAR+μ 5 (7) MN=χ 6 + χ 7 REER+χ 8 Yi+χ 9 RMT+χ10 TAR+μ 6 (8) M=MC+MN (9) NX=X-M (10) 3.1.4 Government sector (Government block) Government consumption expenditure is model strictly as exogenous variable; it is specified as an identity. Government is the largest consumer in the economy and has been identified as the source and effect of changing aggregate consumption, partly because of the increasing size and the attendant corruption in the economy. G=G0 (11) 3.1.5 Aggregate economy (Aggregate demand) Following the traditional Keynesian aggregate demand (DD) identity, we close the model as the sum of private demand (private consumption and investment); exogenous government consumption (G); and net export. DD=CO+INV+G0+NX (12) 4. Presentation and Analysis of results 4.1Data handling and regression results All the variables were tested for unit root and co-integration, but for brevity the results are not presented. Apart from remittance that is integrated of order-two, others are integrated of order-one. Explanatory variables with the same order of integration with their respective endogenous variables are found to be co-integrated except 52
  • 6. Developing Country Studies www.iiste.org ISSN 2224-607X (Paper) ISSN 2225-0565 (Online) Vol 2, No.10, 2012 consumption of food and non-food. Consequently, error correction models were used for investment and import demand equations. The error correction (ECM) variables used in the equations are: ECM_INVN (investment- non-oil); ECM_INVO (investment-oil); ECM_MC (import of consumer goods); and ECM_MN (import non- consumer goods). Table 1 (appendix A) depicts the determinants of consumption; investment; and import demand. It also contains the long run (LR) co-integrating equations of investment and import. Determinants of consumption include: remittance, income, real exchange rate, and government consumption expenditure; investment: financial deepening, remittances, business environment, real exchange rate, gross domestic savings, and domestic average lending; while import restriction, remittances, income, and real exchange rate are determinants of import demand. 4.2 Simulation experiment Table 2 shows one-period percentage change (annual) of the baseline simulation (in-sample) scenario of 5 per cent and 15 per centiii increase in migrant remittances inflow on total consumption (CO), consumption of food (CF) and non-food (CN); total private investment (INV), investment-oil (INVO) and investment non-oil (INVN); total import demand (M), import of consumer (MC) and non-consumer (MN) goods; net export (NX); and finally on aggregate demand (DD). On the average, increase in remittances inflow increases consumption by about 1.7 per cent; with 1.6 per cent allocated to food while 1.7 per cent is allocated to non-food – consumers attach equal weights to both food and non-food, though non-food is marginally higher. Investment in the non-oil sector increases by 19 per cent, while oil-sector increases by 19.4 per cent giving an average of 18 per cent increase in total private investment. On the other hand, total import demand will rise by 23 per cent out of which demand for consumer goods accounts for 29 per cent while non-consumer goods accounts 20 per cent. On the average, aggregate demand will decrease by about 0.8 per cent resulting from the decline in current account balance by average of 17 per cent; that is 12.7 per cent (5 per cent simulation) and 21.7 per cent (15 per cent simulation) respectively. Figure 1 is a summary of percentage distribution of aggregate spending effect of remittances extracted from simulation experiment in table 2. Thus, if remittance is poverty-reducing, there must be an unknown transmission mechanism; because obviously from the simulation result in table 2 it might not be through economic growth because of the negative growth effect associated with the balance of payment deficit. Although there are improvements in domestic investment (oil and non-oil); and smoothing consumption (food and non-food); they were not strong enough to offset the negative consequences of current account deficit associated with high import demand. Considering that economic growth has inverse relationship with poverty; the observed negative effect of remittances on macro economy is expected to have adverse effect on poverty. Thus, the conclusion that remittances decreases poverty and inequality may be a short run phenomenon or that the impact of remittances as increasing function of consumption is misunderstood to be poverty-reducing. 5. Conclusion The paper examines the macroeconomic effects of migrant remittances inflow to Nigeria using a small macro- econometric model. The selected macroeconomic variables are consumption; private investment; import demand; and net export. The simulation result revealed two important findings. It confirms the importance of migrant remittances as both sources of direct and deferred consumption through its impact on private consumption and investment. Recipients of remittances spend more on investment than on consumption. However, the investment component of remittance spending is not strong enough to off-set the negative impact of import demand; thus, raising the fear that growth-financing of remittances inflow is neutralised by high-import dependence of the country. Instructively the benefits of remittances can only be growth-financing if the destination country has a policy of import substitution particularly for consumer goods. Further study is however, required to ascertain whether the multiplier effect of the increase in investment and the attendant employment by-product could off-set the balance of payment deficit effect. References 53
  • 7. Developing Country Studies www.iiste.org ISSN 2224-607X (Paper) ISSN 2225-0565 (Online) Vol 2, No.10, 2012 Adams, Jr., Richard H; Cuecuecha, Alfredo; and Page, John. (2009, March). Topic 10 – Remittances, Consumption and Investment. Retrieved from Social Science Research Council, SSRC: http://www.ssrc.org/publications/view/96D00F02-4155-DE11-AFAC-001CC477EC70/ Ajayi, M. A., Ijaiya, M. A., Ijaiya, G. T., Bello, R. A., Ijaiya, M. A., and Adeyemi, S. L. (2009). International remittances and well-being in Sub-saharan Africa. Journal of Economics and International Finance , 078-084,; Vol. 1(3). Ambrosius, C. (2006). Financial Stabilization through Remittances? Some remarks on the macroeconomic effects of migrant remittances. Finance-led Capitalism?Macroeconomic Effects of Changes in the Financial Sector. Berlin. Babatunde, R., and Martinetti, E. (2011). Impacts of migrant remittances on food security and nutrition of Farming Households in Kwara State, Nigeria. Shocks in Developing Countries. Chukwudi, I., Olise, M., and Ewuim, N. (2011). Protecting Human Rights of Nigerian Migrants: The Case of Migrant's’ Remittances Enterprise for Sustanable Development in Nigeria. Kuwait Chapter of Arabian Journal of Business and Management Review, 40-50; Vol. 1, No.1. Chukwuone, N., Amaechina, E., Iyoko, E., Enebeli-Uzor, S. E., and Okpukpara, B. (2007). Analysis of impact of Remittances on Poverty and Inequality in Nigeria. PEP Research Network. Fonta, W. M., Onyukwu, O. E., and Nwosu, E. O. (2011). International Remittance Inflows and Household Welfare:Empirical Evidence from Nigeria. Research Journal of Finance and Accounting, 140-149. Ghosh, B. (2006). Migrants’ Remittances and Development:Myths, Rhetoric and Realities. Switzerland and The Netherlands: International Organization for Migration and The Hague Process on Refugees and Migration. Goldberg, M. A., and Levi, M. D. (2008). The Impact of Remittances on Economic Growth. MasterCard World Wide. Gupta, D., and Tyagi, R. (2012). Migration of Skilled Professionals from Developing Countries:Study of India. Developing Country Studies, 14-22. Gupta, S., Pattillo, C., and Wagh, S. (2007, June 27, 44 (2)). Making Remittances Work for Africa. Finance and Development. Hernández-Coss, R., and Bun, C. E. (2007). “The UK-Nigeria Remittance Corridor Challenges of Embracing Formal Transfer Systems in a Dual Financial Environment”. . World Bank Working Paper No.92. Kireyev, A. (2006). The Macroeconomic of Remittances: The caseTajikistan. International Monetary Fund; Working Paper . Kure, E., and Nwosu, C. P. (2008). Woker's Remittances and Economic Growth: Evidence from Nigeria. Young Statisticians Conference. Saint George Hotel, Pretoria, South Africa. Lindley, A. (2008, May 27). African Remittances and Progress: Opportunities and Challenges (ARI) . Retrieved from Real Instituto Elcano: http://www.realinstitutoelcano.org/wps/portal/rielcano_eng/Content?WCM_GLOBAL_CONTEXT=/elcano /elcano_in/zonas_in/sub-saharan+africa/ari52-2008 Loser, C., Lockwood, C., Minson, A., and Balcazar, L. (2006). The Macro-Economic Impact of Remittances in Latin America Dutch Disease or Latin Cure? mimeo, Inter American Dialogue. NBS. (2012). Consumption Pattern in Nigeria 2009/2010. FCT: National Bureau of Statistics, Abuja. Nwajiuba, C. (2005). International Migration and Livelihoods in Southeastern Nigeria. Global Commission on International Migration. Odimuko, C. L., and Riddell, J. B. (1979). Remittances in the south-eastern Nigeria. Blackwell Publishing on behalf of The Royal Geographical Society (with the Institute of British Geographers). Odozia, J. C., Awoyemia, T. T., and Omonona, B. T. (2010 ). Household poverty and inequality: the 54
  • 8. Developing Country Studies www.iiste.org ISSN 2224-607X (Paper) ISSN 2225-0565 (Online) Vol 2, No.10, 2012 implication of migrants’ remittances in Nigeria. Journal of Economic Policy Reform , 191-199; 13(2). Ojapinwa, T. V. (2012). Determinants of Migrants’ Remittances in Nigeria: An Econometrics Analysis. International Journal of Humanities and Social Science, 295-301; Vol. 2 No. 14. Olowa, O. (2009). The Impact of Remittances on Household Welfare in Rural Nigeria. Medwell Journals, 59-64. Olowa, O. W., and Shittu, A. M. (2012). Remittances and income inequality in rural Nigeria. Journal of Business Management and Economics, 210-221; Vol. 3(5). Orozco, M. (2007). Remittances, Competition and Fair Financial Access Opportunities in Nigeria. USAID. Osili, U. (2005). "Migrants and Housing Investments: Theory and Evidence from Nigeria," . Economic Development and Cultural Change, 821–849; 52 (4). Purnima Mane. (2011, February 18). Highlighting Importance of Women Migrants’ Remittances. Retrieved from A Celebration of Women: http://acelebrationofwomen.org/2011/02/unfpa-ms-purnima-mane- importance-of-women-migrants-remittances/ Ratha, D. (2004, October). Understanding the Importance of Remittances . Retrieved from Migration Policy Institute MPI: http://www.migrationinformation.org/Feature/display.cfm?ID=256 Ratha, D. (2009, December 29; 46 (4)). Remittances in Development. Finance and Development. Ratha, D., Sanket, and Vijayalakshmi, K. (2009, February 18). People Move: A blog about Remittance, Migration and Development. Retrieved from World bank Blog: http://blogs.worldbank.org/peoplemove/remittance-flows-to-developing-countries Sackey, F. G. (2011). Microeconomic Determinants of Private Inward Remittances to Households in Ghana: a case study. Journal of Economics and Sustainable Development. Uadiale, O. M., Oke, B. O., and Okpala, O. P. ( 2011). Impact of Workers’ Remittances on Financial Development in Nigeria. International Business Research, 218-225; Vol. 4, No. 4. Udah, E. B. (2011). Remittances, Human Capital and Economic Peformance in Nigeria. Journal of Sustainable Development in Africa, 300-318; Volume 13, No.4. World Bank. (2011). Migration and Remittances Factbook; Second Edition. 1818 H Street NW, Washington DC 20433: The International Bank for Reconstruction and Development / The World Bank. 55
  • 9. Developing Country Studies www.iiste.org ISSN 2224-607X (Paper) ISSN 2225-0565 (Online) Vol 2, No.10, 2012 Appendix A: Regression results and baseline simulation experiment Table 1: Regression results CONSUMPTION FOOD Dep. Var: DLOG(CF) Variable Coefficient Std. Error t-Statistic Prob. DLOG(CF(-1)) 0.5547 0.0717 7.7331 0.0000 DLOG(RMT(-4),2) 0.0733 0.0155 4.7204 0.0000 DLOG(YI(-4)) 0.0753 0.0289 2.6049 0.0107 DLOG(G(-4)) -0.1407 0.0438 -3.2148 0.0018 D(SVR(-8)) -0.0007 0.0004 -2.0010 0.0483 DLOG(REER(-5)) -0.0834 0.0282 -2.9620 0.0039 CONSUMPTION NON-FOOD Dep. Var: DLOG(CN) Variable Coefficient Std. Error t-Statistic Prob. DLOG(CN(-1)) 0.5529 0.0748 7.3929 0.0000 DLOG(RMT(-4),2) 0.0524 0.0151 3.4786 0.0008 DLOG(YI(-4)) 0.0663 0.0283 2.3460 0.0210 DLOG(G(-4)) -0.1302 0.0427 -3.0482 0.0030 DLOG(REER(-5)) -0.1033 0.0280 -3.6966 0.0004 EQ01_LRINVN Dep. Var: LOG(INVN) Variable Coefficient Std. Error t-Statistic Prob. LOG(YO(-1)) 0.2425 0.0293 8.2634 0.0000 LOG(REER(-1)) 0.0423 0.0585 0.7230 0.4713 LOG(FD(-1)) -0.1546 0.1446 -1.0692 0.2875 RD(-1) -0.0018 0.0017 -1.0560 0.2935 LOG(GDS(-1)) 0.8441 0.0370 22.8086 0.0000 EQ02_LRINVO Dep. Var: LOG(INVO) Variable Coefficient Std. Error t-Statistic Prob. LOG(YO(-1)) -0.1615 0.1278 -1.2641 0.2091 LOG(REER(-1)) 0.0573 0.0689 0.8323 0.4072 LOG(FD(-1)) -0.4186 0.1656 -2.5279 0.0130 RD(-1) -0.0029 0.0019 -1.5438 0.1258 LOG(GDS(-1)) 0.8501 0.0397 21.4062 0.0000 C 4.2554 1.6807 2.5319 0.0129 EQ03_LRMC Dep. Var: LOG(MC) Variable Coefficient Std. Error t-Statistic Prob. LOG(YI(-1)) 0.8259 0.0219 37.7957 0.0000 LOG(REER(-1)) -0.2510 0.0612 -4.1037 0.0001 LOG(TAR(-1)) -0.3795 0.0767 -4.9474 0.0000 56
  • 10. Developing Country Studies www.iiste.org ISSN 2224-607X (Paper) ISSN 2225-0565 (Online) Vol 2, No.10, 2012 EQ04_LRMN Dep. Var: LOG(MN) Variable Coefficient Std. Error t-Statistic Prob. LOG(YI(-1)) 0.8902 0.0219 40.6096 0.0000 LOG(REER(-1)) -0.1698 0.0614 -2.7680 0.0067 LOG(TAR(-1)) -0.4299 0.0770 -5.5867 0.0000 IMPORT CONSUMER GOODS Dep. Var: DLOG(MC) Variable Coefficient Std. Error t-Statistic Prob. DLOG(MC(-2)) 0.1661 0.0616 2.6988 0.0083 DLOG(RMT(-7),2) 0.1941 0.0762 2.5477 0.0125 DLOG(YI) 0.4480 0.1502 2.9816 0.0037 DLOG(REER) -0.4661 0.1416 -3.2926 0.0014 DLOG(TAR) -0.6870 0.0854 -8.0447 0.0000 ECM_MC(-1) -0.3082 0.0584 -5.2728 0.0000 IMPORT NON-CONSUMER GOODS Dep. Var: DLOG(MN) Variable Coefficient Std. Error t-Statistic Prob. DLOG(RMT(-6),2) 0.2498 0.0728 3.4314 0.0009 DLOG(YI(-7)) 0.5422 0.1420 3.8192 0.0002 DLOG(REER(-1)) -0.3286 0.1328 -2.4745 0.0151 DLOG(TAR) -0.9560 0.0807 -11.8427 0.0000 ECM_MN(-1) -0.1890 0.0599 -3.1549 0.0022 INVESTMENT NON-OIL Dep. Var: DLOG(INVN) Variable Coefficient Std. Error t-Statistic Prob. DLOG(INVN(-5)) 0.3676 0.0894 4.1139 0.0001 DLOG(FD(-4)) 1.2229 0.2812 4.3496 0.0000 DLOG(RMT,2) 0.4370 0.1163 3.7568 0.0003 DLOG(YO) 1.1833 0.4365 2.7108 0.0081 DLOG(BUS(-4),2) -1.0336 0.2989 -3.4577 0.0008 D(RD(-8)) -0.0078 0.0026 -3.0529 0.0030 DLOG(REER(-9)) 0.4031 0.1892 2.1302 0.0359 DLOG(GDS(-1)) 0.9435 0.2159 4.3711 0.0000 ECM_INVN(-1) -0.6834 0.2189 -3.1220 0.0024 INVESTMENT OIL Dep. Var: DLOG(INVO) Variable Coefficient Std. Error t-Statistic Prob. DLOG(INVO(-5)) 0.4609 0.0820 5.6191 0.0000 DLOG(FD(-4)) 1.2047 0.2863 4.2083 0.0001 DLOG(RMT,2) 0.2890 0.1082 2.6715 0.0089 DLOG(BUS(-7),2) -0.7300 0.2565 -2.8456 0.0055 D(RD(-8)) -0.0066 0.0027 -2.4217 0.0174 DLOG(REER(-8)) 0.3822 0.1904 2.0076 0.0476 DLOG(GDS(-1)) 1.1606 0.1645 7.0547 0.0000 ECM_INVO(-1) -0.8759 0.1508 -5.8074 0.0000 Source: Regression results 57
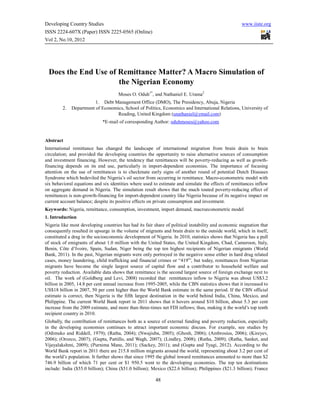
  • 11. www.iiste.org Table 2: Baseline simulation experiment of macroeconomic effects of Migrants’ remittances 5 per cent 15 per cent Element CF CN CO DD INV INVN INVO M MC MN NX CF CN CO DD INV INVN INVO M MC MN NX Source: Simulation of macroeconomic model of Migrant remittances inflow to Nigeria. 1984 3.1 2.2 2.7 -9.8 -36.5 -37.5 -34.5 -8.8 4.5 -13.0 -12.9 3.7 2.63 3.2 -9.7 -36.3 -37.3 -34.3 -8.8 4.5 -13 -13 1985 12.3 6.0 9.6 4.0 -21.4 -11.3 -40.6 23.0 68.4 5.8 2.5 13.6 6.87 10.8 4.6 -20.2 -10 -39.9 25.9 71.2 8.7 2 1986 -1.8 -1.8 -1.8 -10.8 -42.8 -36.9 -59.5 74.7 133.1 39.5 -18.8 -1.7 -1.73 -1.7 -10.8 -42.3 -36.5 -59.2 75.2 135.2 39.5 -19 1987 0.1 5.0 2.1 -6.0 -26.7 -20.9 -52.0 145.2 178.2 111.9 -21.1 0.1 4.96 2.1 -6.1 -26.4 -20.8 -51.9 145.2 178.3 111.9 -22 1988 19.1 24.5 21.3 -1.4 -11.0 -7.2 -39.3 9.0 14.8 1.4 -50.0 19.1 24.45 21.3 -1.2 -10.9 -7.1 -39.2 9 14.8 1.4 -51 1989 8.1 10.7 9.2 -6.7 -49.7 -49.6 -50.0 77.7 67.9 92.2 -85.7 8.1 10.66 9.2 -6.9 -49.6 -49.6 -50 77.7 67.9 92.2 -89 1990 11.2 5.1 8.5 -1.5 -3.2 0.1 -40.2 43.3 63.6 16.7 -515.5 11.2 5.13 8.5 -1.6 -3.2 0.1 -40.1 43.3 63.6 16.7 -712 1991 -6.3 -5.2 -5.8 -24.2 -35.7 -34.0 -67.6 54.8 43.8 74.9 194.4 -6.3 -5.16 -5.8 -24.5 -35.7 -34 -67.6 54.8 43.8 74.9 183 1992 -4.7 1.7 -2.0 -14.3 -17.6 -16.7 -52.6 -4.2 -12.8 8.9 29.5 -4.7 1.65 -2 -14.3 -17.6 -16.7 -52.5 -4.2 -12.8 8.9 28 58 1993 10.4 9.6 10.1 4.3 13.6 14.2 -28.7 12.7 8.4 17.8 23.6 10.4 9.63 10.1 4.3 13.6 14.2 -28.7 12.7 8.4 17.8 23 1994 -2.9 -5.3 -4.0 4.5 53.6 54.4 -24.0 -23.0 -14.6 -32.4 -21.0 -2.9 -5.25 -4 5 53.6 54.4 -24 -23 -14.6 -32.4 -21 ISSN 2224-607X (Paper) ISSN 2225-0565 (Online) 1995 3.0 -0.9 1.3 -38.8 -35.3 -35.2 -58.4 64.8 74.3 51.5 81.4 3 -0.91 1.3 -39.4 -35.3 -35.2 -58.4 64.8 74.3 51.5 81 1996 9.6 3.7 7.1 75.7 13.9 13.9 6.1 -41.3 -40.8 -42.1 -41.8 9.6 3.71 7.1 77.7 13.9 13.9 6.1 -41.3 -40.8 -42.1 -42 1997 2.4 3.7 2.9 2.1 6.8 6.9 -14.0 7.0 -2.3 22.4 5.5 2.4 3.7 2.9 2.1 6.8 6.9 -14 7 -2.3 22.4 6 1998 -10.0 -5.9 -8.3 -10.9 -3.8 -3.8 -27.3 -1.4 -13.0 13.9 -1.0 -10 -5.87 -8.3 -11 -3.8 -3.8 -27.3 -1.4 -13 13.9 -1 1999 -8.4 -7.3 -8.0 8.4 -15.6 -15.5 -51.5 -31.8 -34.3 -29.3 -32.8 -8.4 -7.31 -8 8.6 -15.6 -15.5 -51.5 -31.8 -34.3 -29.3 -33 2000 -5.1 -3.0 -4.2 1.9 24.5 24.5 -27.4 -18.1 -16.0 -20.1 -19.9 -5.1 -2.99 -4.2 2 24.5 24.5 -27.4 -18.1 -16 -20.1 -20 2001 4.8 8.1 6.3 9.1 -45.5 -45.5 -72.1 -5.4 -14.1 3.1 -2.4 4.8 8.14 6.3 9.1 -45.5 -45.5 -72.1 -5.4 -14.1 3.1 -3 2002 -5.6 -6.7 -6.1 2.8 139.3 139.3 226.9 -35.5 -45.2 -27.4 -37.8 -5.6 -6.67 -6.1 3 139.3 139.3 226.9 -35.4 -45.2 -27.4 -38 2003 1.3 -0.2 0.6 -4.9 147.5 147.5 185.7 65.2 49.3 75.0 70.6 1.3 -0.2 0.6 -4.9 147.5 147.5 185.7 65.2 49.3 75 70 Developing Country Studies 2004 -2.0 -0.6 -1.4 10.8 238.7 238.7 340.7 0.7 9.0 -3.6 1.7 -2 -0.57 -1.4 11.6 238.7 238.7 340.7 0.7 9 -3.6 2 2005 1.1 -0.4 0.4 13.0 70.5 70.5 131.0 -4.2 -1.1 -6.0 -4.2 1.1 -0.38 0.4 13.6 70.5 70.5 131 -4.2 -1.1 -6 -4 2006 -2.5 -1.8 -2.2 -8.2 30.3 30.2 120.8 65.7 75.0 59.8 66.8 -2.5 -1.84 -2.2 -7.9 30.3 30.2 120.8 65.7 75 59.8 67 Vol 2, No.10, 2012 2007 0.1 -0.8 -0.3 -20.0 27.9 27.7 193.5 80.1 99.8 66.5 85.3 0.1 -0.76 -0.3 -19.4 27.9 27.7 193.5 80 99.8 66.5 85 Average 1.6 1.7 1.6 -0.9 17.6 18.9 19.4 22.9 29.0 20.3 -12.7 1.6 1.7 1.7 -0.7 17.7 19.0 19.4 23.1 29.2 20.4 -21.7
  • 12. Developing Country Studies www.iiste.org ISSN 2224-607X (Paper) ISSN 2225-0565 (Online) Vol 2, No.10, 2012 -17.2 Net export 23 Import 17.6 Investment 1.6 Consumption -0.8 Aggregate Economy -20 -10 0 10 20 30 Percentage distribution Figure 1: Summary of percentage distribution of aggregate spending effect of remittance Source: Authors’ estimate based on simulation result Notes i 419” is an acronym given to kind of fraudulent financial practices in Nigeria whereby unsuspecting business men and women, particularly foreigners, are dispossessed of their money and other financial assets with the ill intention of helping the victims secure contracts or even facilitate money transfer or claims under the disguise that the benefactor is or was a minister or any other well connected government official in Nigeria. It is derived from section 4(19) of the Nigerian Constitution which makes advance fee fraud an offence in the Nigeria criminal code. Most foreigners and even locals have fallen victims of this crime. It is one of the factors that present Nigerian emigrants and citizens in a negative sense. ii A quick correlation using remittances in flow and poverty headcount shows that there is a negative correlation of 0.89 (world) and 0.8 (Sub-Saharan Africa); and for Nigeria there is a positive correlation of about 0.54 from the period 1985 -2009. iii Prices of food and non-food items are excluded from the equations because the variables are real variables. iv Studies by (Goldberg and Levi, 2008); and (World Bank, 2011) recorded that the average annual growth rate of remittances inflow to Nigeria from the period 1995-2005; and from 2009-2010 were approximately 15 per cent, and 5 per cent respectively. These figures were used for simulation. 59