Assessing the risk and return of financial trading systems - a large deviation approach
•
0 gostou•258 visualizações

N. Navet, R. Schott, "Assessing the risk and return of financial trading systems - a large deviation approach", 6th International Conference on Computational Intelligence in Economics & Finance (CIEF2007), Salt-Lake City, USA, July 18-24, 2007.
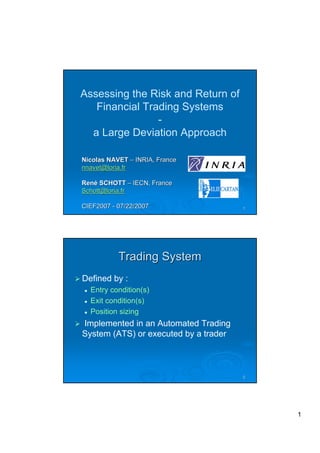
![Performance of a trading system
Performance metric : return (P&L), Sharpe ratio, ..
Reference period – e.g: day, week, …
P&L interval Probability k
(−3, −2] 1/25 −2.5
(−2, −1] 2/25 −1.5
(−1, −0] 3/25 −0.5
(0, 1] 12/25 0.5
(1, 2] 4/25 1.5
(2, 3] 2/25 2.5
(3, 4] 1/25 3.5
Distribution of the performance metric
3
Obtaining the distribution of the
performance metric
1. Prior use of the TS
2. Back-testing on historical data, but :
Does not account for slippage and delays
Data-mining bias if a large number of systems are
Data-
tested
Performance must be adjusted accordingly!
4
2](data:image/gif;base64,R0lGODlhAQABAIAAAAAAAP///yH5BAEAAAAALAAAAAABAAEAAAIBRAA7)
Recomendados
Recomendados
Mais conteúdo relacionado
Destaque
Destaque (8)
Último
Último (20)
Assessing the risk and return of financial trading systems - a large deviation approach
- 1. Assessing the Risk and Return of Financial Trading Systems - a Large Deviation Approach Nicolas NAVET – INRIA, France nnavet@loria.fr René SCHOTT – IECN, France Schott@loria.fr CIEF2007 - 07/22/2007 1 Trading System Defined by : Entry condition(s) Exit condition(s) Position sizing Implemented in an Automated Trading System (ATS) or executed by a trader 2 1
- 2. Performance of a trading system Performance metric : return (P&L), Sharpe ratio, .. Reference period – e.g: day, week, … P&L interval Probability k (−3, −2] 1/25 −2.5 (−2, −1] 2/25 −1.5 (−1, −0] 3/25 −0.5 (0, 1] 12/25 0.5 (1, 2] 4/25 1.5 (2, 3] 2/25 2.5 (3, 4] 1/25 3.5 Distribution of the performance metric 3 Obtaining the distribution of the performance metric 1. Prior use of the TS 2. Back-testing on historical data, but : Does not account for slippage and delays Data-mining bias if a large number of systems are Data- tested Performance must be adjusted accordingly! 4 2
- 3. Notations and Assumptions Xi : performance at period i X1 , X2 , . . . , Xn : 1) are mutually independent and identically distributed 2) obey a distribution law that does not change over time 5 How to assess the risks ? n X We want to estimate p = P [ Xi < x$] i 1. Monte-Carlo simulation 2. Analytic approaches: 1. Markov’s, Tchebychev’s, Chernoff’s upper bounds 2. Large deviation 6 3
- 4. Monte-Carlo simulation Generate n random trading sequences and compute an estimate of the probability CLT tells us that the estimate will convergence to p but slowly and p p(1 − p) percentage error = √ · 100 np Error bound of 1% with p=10-5 requires n=109 Problem : random number generators are not perfect .. 7 Analytic approaches Weak law of large numbers : µ¯ Pn ¯ ¶ ¯ i Xi ¯ lim P ¯ ¯ n − E[X]¯ < ² ¯ ∀² > 0 n→∞ But the rate of convergence is unknown .. Elements of solution: 1 1. Markov’s inequality : ∀α P (X ≥ αE[X]) ≤ α 1 2. Tchebychev’s inequality : P (|X − E[X]| ≥ kσ[X]) ≤ k2 Not tight enough for real-world applications 8 4
- 5. Large deviation: main result n 1X Mn = Xi : mean performance over n n i=1 periods Cramer’s theorem : if Xn i.i.d. r.v. P (Mn ∈ G) ³ e−n inf x∈G I(x) e.g. G = (−∞, −k$] with I(x) the rate function X +∞ τX I(x) = sup[τ x − log E(e )] = sup[τ x − log pk ekτ ] τ >0 τ >0 k=−∞ 9 Technical contribution Can deal with distributions given as frequency histogram (no closed-form) I(x) is the sup. of affine functions and thus convex Computing the point where first derivative equal zero is thus enough Can be done with standard numerical methods 10 5
- 6. Risk over a given time interval 1 x=0 0.9 x=-0.5 0.8 r = 0.08 x=-1 Upper bound on the probability 0.7 P [Mn < 0$] ≤ 0.42 0.6 0.5 0.4 r = 0.32 0.3 P [Mn < −0.5K$] ≤ 0.04 0.2 0.1 r = 0.68 0 5 10 15 20 25 30 35 40 45 50 Time interval in days (n) P [Mn < −1K$] ≤ 0.001 11 Quantifying the uncertainty The uncertainty of trading system Sp to achieve a performance x over n time periods is U(x, n) = P [Mn ≤ x/n] ≤ e−n inf y≤x/n I(y) Sp is with performance objective x over n time periods is less uncertain than Sp’ with return objective x' over n' time periods if U(x, n) ≤ U 0 (x0 , n0 ) 12 6
- 7. Detecting changing market conditions Idea: if a TS performs way below what was foreseeable, it suggests that market conditions have changed E.g., if the current performance level had a probability less than 10-6 13 Portfolio of Trading Systems Assumption: TS are independent n 1X 1 Comes to evaluate : P[ (Xi + Xi + ... + Xim ) < x$] 2 n i=1 Sum of 2 id. r.v. = convolution, computed using Fast Fourier Transform : f ? g = F F T −1 (F F T (x) · F F T (y)) 14 7
- 8. Conclusion LD is better suited than simulation for rare events (<10-4) LD can serve to validate simulation results LD helps to detect changing market conditions Our approach is practical : No need for closed-form distributions Easily implementable Work for portfolio of TS Can be embedded in a broader analysis 15 Extensions There are ways to address the cases: There are serial dependencies in the trade outcomes The market conditions are changing over time p.d.f. non-homogeneous in time 16 8