SlideShare uma empresa Scribd logo
1 de 31
Baixar para ler offline
Vol.:(0123456789)
Environment, Development and Sustainability (2022) 24:2315–2344
https://doi.org/10.1007/s10668-021-01535-5
1 3
Comparison of multi‑influence factor, weight of evidence
and frequency ratio techniques to evaluate groundwater
potential zones of basaltic aquifer systems
Nitin L. Rane1
· Geetha K. Jayaraj2
Received: 11 September 2020 / Accepted: 19 May 2021 / Published online: 25 May 2021
© The Author(s), under exclusive licence to Springer Nature B.V. 2021
Abstract
Groundwater is the largest available reservoir of freshwater. But the rapid increase in the
population and urbanisation, has led to over exploitation of groundwater which imposed
tremendous pressure on global groundwater resources. Because of the hidden and dynamic
nature of groundwater, it requires appropriate quantification for the formulation of ground-
water planning and management strategies. The present study evaluates the efficacy of
geospatial technology based Multi Influence Factor (MIF), Weight of Evidence (WofE)
and Frequency Ratio (FR) technique to evaluate groundwater potential using a case study
of basaltic terrain. The thematic layers influencing the groundwater occurrence viz. rain-
fall, slope, geomorphology, soil type, land use, drainage density, lineament density, and
elevation were prepared using satellite images, hydrologic, hydrogeologic and relevant
field data. Based on the conceptual frameworks of MIF, WofE and FR techniques these
thematic layers and their features were assigned with appropriate weight and then inte-
grated in the ArcGIS platform for the generation of aggregated raster layer which portray
the groundwater potential zones. The results of validation showed that the groundwater
potential delineated using MIF technique has a prediction accuracy of 81.94%, followed by
WofE technique (76.19%) and FR techniques (71.43%). It is concluded that for evaluation
of groundwater potential, the MIF technique is most reliable, followed by the WofE tech-
nique. The evaluated groundwater potential zones are useful as a scientific guide to identify
the suitable location of wells and recharge structure in a cost-efficient way and also for the
development of structured and pragmatic groundwater management strategies.
Keywords Groundwater potential zones · Multi influence factor · Weight of evidence ·
Frequency ratio · Geospatial techniques · Basaltic aquifer
* Nitin L. Rane
nitinrane33@gmail.com
Geetha K. Jayaraj
jayaraj.geetha@gmail.com
1
Department of Civil Engineering, Pillai HOC College of Engineering and Technology,
New Mumbai, India
2
Shivajirao S Jondhle College of Engg & Technology, Asangaon, Thane, India
Content courtesy of Springer Nature, terms of use apply. Rights reserved.
2316 N. L. Rane, G. K. Jayaraj
1 3
1 Introduction
Groundwater is an essential freshwater source for agriculture, human survival, industrial
development, and ecosystem conservation, so it must be managed prudently. The mis-
management of this treasured resource leads to the negative effect on the sustainability of
groundwater, causing decreases in groundwater level and triggering environmental prob-
lems such as groundwater quality deterioration, land subsidence, and seawater intrusion
for the present as well as for future generation (Aksever et al., 2015; Bear et al., 1999;
Katpatal et al., 2014; Parisi et al., 2018; Vasanthavigar et al., 2010; Voudouris, 2006; Wada
et al., 2010; Yesilnacar et al., 2008). Many river basins in the world have experienced
severe groundwater stresses (Ghasemi et al., 2017; Palmer et al., 2008; Tsanis & Aposto-
laki, 2009). Agriculture in India is demographically the large economic sector and ranks
second in the world in terms of agriculture production (Ghude et al., 2014; Shah, 2010).
Groundwater is the major freshwater resource of livelihood because more than 60% irriga-
tion in agriculture relying on groundwater and therefore has an important role in the overall
socioeconomic structure of India (Ghude et al., 2014; CGWB 2017). In recent years, due
to increase in the demand of groundwater, causing considerable groundwater depletion in
India (Selvakumar et al., 2018). The groundwater demand in future may increase due to
insufficient storage capacity of surface water resources and unpredictable monsoon. Fur-
thermore, climatic change and socioeconomic factors are likely to increase water issues
(Asoka et al., 2017; Gurdak, 2017; Shah, 2009). These water conditions have severe impli-
cations for the agricultural sustainability, economic development, energy and food security,
ecosystem conservation and industrial development of the country. Therefore, it is required
to use modern tools and techniques to develop a comprehensive database of the quality and
quantity of groundwater, to retrieve the declined trend of groundwater level.
Integrated use of Remote Sensing (RS) and Geographic Information System (GIS)
technology is becoming a useful and powerful tool for identifying and delineation of
groundwater potential (Arulbalaji et al., 2019; Mahmoud, 2014; Singh et al., 2018; Zhu
& Abdelkareem, 2021). The application of RS in hydrogeologic monitoring and investiga-
tion provides useful information in spatio-temporal scales, which is significant to evaluate,
predict, and validate the groundwater models effectively (Kaur et al., 2020; Kim et al 2019;
Singh et al., 2014;). The capabilities of satellite images to cover large spatial scales is cru-
cial for mapping the hydrogeographic characteristics of the basin, such as geomorphology,
drainage density, slope, land use, lineament, and elevation (Devi et al., 2001; Roy et al.,
2019). Such characteristics are the main requirement for assessment and exploration of
groundwater resources (Raju et al., 2019). On the other hand, GIS provides a distinct work-
ing environment that can effectively process and store georeferenced data gathered from
various sources, such as land surveys, maps, and satellite images etc. (Adimalla & Taloor,
2020; Yeh et al., 2009, 2016).
Groundwater exploration using traditional methods, namely field-based surveys, stra-
tigraphy analysis and test drilling are very expensive, time-consuming and laborious
(Chowdhury et al., 2009; Das et al., 2019; Lee et al., 2012; Shahinuzzaman et al., 2021).
Moreover, the groundwater resources planning and development need long term data-
base that is generally not available in numerous regions, especially in developing coun-
tries. The use of RS and GIS overcomes this restriction to some extent and becomes
an efficient tool to monitor, assess and manage the groundwater resources (Achu et al.,
2020; Fashae et al., 2014; Gnanachandrasamy et al., 2018; Jha et al., 2007; Machiwal
et al., 2011; Mahmoud, 2014; Tolche, 2021; Waikar & Nilawar, 2014). The groundwater
Content courtesy of Springer Nature, terms of use apply. Rights reserved.
2317
Comparison of multi‑influence factor, weight of evidence and…
1 3
occurrence is controlled by various factors such as drainage density, lineament density,
slope, soil type, elevation, lithology, geomorphology, land use and interrelation among
these factors (Jenifer & Jha, 2017; Magesh et al., 2012; Murthy, 2000; Razandi et al.,
2015; Sahoo et al., 2017; Thapa et al., 2018). The application of RS and GIS to delin-
eate the groundwater potential comprises the integration of hydrological as well as
geological factors, which influence the groundwater occurrence (Gupta & Srivastava,
2010; Pande et al., 2019; Shahid et al., 2000). Several researchers across the world have
used RS and GIS techniques with or without Multi Influence Factor (MIF) technique to
delineate groundwater potential zones in various hydrogeological settings (e.g., Fashae
et al., 2014; Ganapuram et al., 2009; Gupta & Srivastava, 2010; Gumma & Pavelic.,
2013;Ghorbani Nejad et al., 2017; Kumar et al., 2007; Machiwal et al., 2011; Magesh
et al., 2012; Pinto et al., 2017; Pande et al., 2019; Srinivasa and Jugran 2003;).
In addition to conventional Geospatial technology-based MIF technique in the
last few years, the Geospatial technology-based Weight of Evidence (WofE) and Fre-
quency Ratio (FR) technique have been used for evaluating the groundwater potential.
The WofE technique has been employed to water quality evaluation (Lee & Jones-Lee,
2004; Sanderson et al., 2006), assessment of landslide vulnerability (Hong et al., 2017;
Kayastha et al., 2012; Mohammady et al., 2019; Xu et al., 2012), delineation of soil
erosion susceptible zones (Gayen & Saha, 2017; Hembram et al., 2019) prediction of
flood prone zones (Hong et al., 2018; Tehrany et al., 2014) and groundwater potential
zones mapping (Corsini et al., 2009; Tahmassebipoor et al., 2016). Moreover, another
Geospatial technology-based Frequency Ratio (FR) technique has attracted the research-
er’s attention from different disciplines such as landslide hazard mapping (Akgun et al.,
2008; Lee & Pradhan, 2007), prediction of flash flood hazard susceptibility (Cao et al.,
2016). Also, it has been used to evaluate the groundwater potential (Das & Pardeshi,
2018; Razandi et al., 2015; Sahoo et al., 2015). The results show that both the WofE and
FR techniques having the good ability to reliably delineate groundwater potential.
The literature shows that most of the evaluations based on RS and GIS techniques to
delineate the groundwater potential have assessed single MIF or WofE or FR technique.
Thus, identification of appropriate technique is required to provide a higher prediction
accuracy for evaluating the groundwater potential. The primary objective of the study
is to comparatively evaluate the applicability of MIF, WofE and FR technique to iden-
tify and delineate the groundwater potential zones in the study area. The findings and
described framework in this study helpful to identify the efficacy and usefulness of MIF,
WofE and FR technique which gives higher prediction precision to assess the ground-
water potential.
1.1 Study Area
The Kadva river, a tributary of Godavari River is bounded by latitude 20°1′6.27N to
20°26′44.78N and longitude 73°36′43.10E to 74°11′34.02E and encompasses an area
of 1705.24 ­
km2
in Nashik district, India, as shown in Fig. 1. The average annual pre-
cipitation in study area is about 700 mm, in which 80% predominates from the monsoon
winds from the South-West. The climate in the study area is semi-arid with temperature
ranging from 5 to 42 °C in winter and summer season (CGWB 2014). A major part of
basin is covered by agriculture land. The area is primarily irrigated with rivers, canal
water and groundwater (Wagh et al., 2017).
Content courtesy of Springer Nature, terms of use apply. Rights reserved.
2318 N. L. Rane, G. K. Jayaraj
1 3
1.2 Hydrogeology
Geologically the study area is covered by basaltic lava flows from Upper Cretaceous to
Eocene age and contains aa and pahoehoe lava flows of basaltic structure (GSI, 2001).
Weathered and fractured units underlain by massive basalt units serve as the main aquifer
system in study area. The aquifer has lack of primary porosity but possesses secondary
Fig. 1  Location of the study area with rain gauge station and elevation
Content courtesy of Springer Nature, terms of use apply. Rights reserved.
2319
Comparison of multi‑influence factor, weight of evidence and…
1 3
porosity due to fractured and weathered basalt. The upper weathered and fractured units
comprise the unconfined aquifers, and the occurrence of groundwater is in unconfined con-
dition. The groundwater occurrence at a deep level is under the semi-confined to confined
condition (CGWB 2014). The unconfined aquifer is mainly limited to fractured basalt, and
moderately weathered basalt and the main groundwater source to the large diameter wells.
The basaltic aquifer possesses high heterogeneity in nature and varies over the small dis-
tance because of difference in structural features, texture and lithology. The semi-confined
to confined aquifer is primarily composed of fractured jointed amygdular and vesicular
basalt of considerable thickness and it has developed into semi-confined to confined con-
dition. Groundwater exists in the pore spaces of interconnected vesicular units and in the
jointed and fractured units of a massive basalt of individual flow (Rane  Jayaraj, 2021).
Groundwater levels in the study area vary from 0.85 to 13.36 m below ground level (bgl)
in the weathered residuum which is tapping by the hand dug wells, whereas deep fractured
basalt is tapping by the borewells.
1.3 Water issues
From this current study, it is observed that 986.07 ­
km2
area falls under the agricultural land
which is coming as 57.83% of the whole area taken up for the study and it is apparent that
agricultural practices are supported by groundwater and surface water. In many cases, the
supply of surface water is associated with precipitation leading to excessive availability of
water in monsoon period and shortage in the subsequent dry period. Moreover, the ground-
water level in the dry period ranges 2.40–13.36 m (bgl), and post-monsoon groundwater
level ranges 0.85–10.36 m (bgl). The seasonal fluctuations in groundwater level indicate
substantial aquifer recharge during the monsoon season. In dry season, canal network is
unable to supply sufficient water for intensive crops; therefore, water scarcity issues are
severe in dry season, because groundwater is only feasible water resource in such a sit-
uation. This situation results in the increase in the number of wells that exacerbate the
groundwater depletion in the study area. In addition, groundwater availability is limited
in the study area due to the basaltic aquifer, that has low storage capacities. According to
CGWB (2014), the groundwater development stage for two talukas located in the study
area, namely Niphad and Chandwad, are classified as semi-critical areas in which the stage
of groundwater development is 84% and 89%, respectively. This indicates the study area
is using 84% and 89% of the groundwater resources in the Niphad and Chandwad talukas
respectively. In addition, the demand for groundwater increased in recent years because of
the change in population and expansion of agriculture in the study area (Wagh et al., 2017).
These situations illustrate the need of sustainable groundwater management in the study
area.
2 Material and methodology
2.1 Geospatial database preparation
Groundwater potential is controlled by various surface parameters, such as geomorphol-
ogy, anthropogenic activities, lineament, slope, soil type, land use, drainage density, eleva-
tion, rainfall, etc. and subsurface properties such as infiltration capacity, geology, storage
coefficient of aquifer, hydraulic conductivity of aquifer, etc. According to the availability
Content courtesy of Springer Nature, terms of use apply. Rights reserved.
2320 N. L. Rane, G. K. Jayaraj
1 3
of field observed and geospatial data and also by consideration of effects of the factors, the
factors which influence the groundwater potential were chosen to evaluate the groundwater
potential through geospatial technology-based MIF, WofE and FR techniques. In the pre-
sent study, eight hydrologic and hydrogeologic factors were selected to evaluate groundwa-
ter potential, and for each factor, the thematic layer was prepared. The daily rainfall data of
six rain gauge station were collected from Department of Water Resources, Maharashtra
and used to prepare the map of rainfall. The annual precipitation data of 18 years were
averaged and assigned to each rain gauge station for the preparation of rainfall map. The
30 m Shuttle Radar Topography Mission (SRTM) DEM data were used for the generation
of slope, drainage density and elevation maps through the ArcGIS spatial analyst tool. The
toposheets acquired from Survey of India were used to digitize the lakes and rivers in the
study area as well as verified using Landsat-8 imagery. The soil type map was acquired
from FAO global soil data map (http://​www.​fao.​org). The land use map was prepared in
ERDAS Imagine 2015 software using supervised classification. In addition to above geo-
spatial data, discharge data were collected from the 72 pumping wells. Figure 4 shows the
location of the pumping wells in study area.
2.2 Delineation of groundwater potential zones
In order to identify and delineate the groundwater potential zones, thematic layers of soil
type, drainage density, rainfall, elevation, lineament, geomorphology, land use, and slope
were used which influence the groundwater occurrence. In the present study, three tech-
niques, namely Multi Influence Factor (MIF) technique, Weight of Evidence (WofE) and
Frequency Ratio (FR) technique were used and comparatively evaluated to identify and
delineate the groundwater potential zones with high prediction accuracy in the study area.
The prediction accuracy is found out by using the number of wells agreed for the actual
groundwater yield data divided by the total number of wells. These three techniques briefly
described in the following sections.
2.2.1 MIF technique
Evaluating the influence of factors separately on groundwater potential cannot portray
the real scenarios. Thus, it is required to use the MIF technique where all input factors
are integrated by taking into consideration of all possible interactions between each fac-
tor. As each factor has a different degree of influence on groundwater occurrence, a
weighted approach is used so that all factors will be incorporated interactively. Flowchart
of groundwater potential delineation using MIF technique is depicted in Fig. 2. In order
to estimate weights of different factors, the influence between all factors should be deter-
mined, and that was carried out according to the schematic interrelation depicted in Fig. 3.
The interrelation is carried out on the basis of prior understanding of the influence factors
for groundwater occurrence from the past research and literature review (Das  Pardeshi,
2018; Fashae et al., 2014; Ganapuram et al., 2009; Gumma  Pavelic, 2013; Jenifer  Jha,
2017; Krishnamurthy et al., 1996; Kumar et al., 2007; Mahmoud, 2014; Pande et al., 2019;
Razandi et al., 2015; Sahoo et al., 2015; Thapa et al., 2018). The factors with a major influ-
ence are assigned a weight of 1.0, while, a minor influence is assigned with a weight of
0.5 and the factor with no effect on groundwater occurrence is assigned a weight of zero.
Then the total relative effect of each factor is calculated by adding values of both major and
minor effect as shown in Table 1.
Content courtesy of Springer Nature, terms of use apply. Rights reserved.
2321
Comparison of multi‑influence factor, weight of evidence and…
1 3
The weights for influencing factors are computed as:
where Ej is major interrelation between two factors and Ei is minor interrelation between
two factors.
(1)
� �
Ej + Ei
�
∑ �
Ej + Ei
�
�
X100
Fig. 2  Flowchart of groundwater potential delineation using MIF technique
Fig. 3  Interrelation among the multiple influence factors of groundwater potential in the study area
Content courtesy of Springer Nature, terms of use apply. Rights reserved.
2322 N. L. Rane, G. K. Jayaraj
1 3
The calculated relative weights are considered as the weights of corresponding fea-
tures. After computation of weights, rating classification for each feature was performed
by dividing the weight (Wi) by the number of features in each factor, as well as based on
heuristic approach of information on the conditions influencing the groundwater potential.
Table 1  Influence factors, their relative effect and corresponding weight
Factor Major effect (Ej) Minor effect
(Ei)
Relative
effect (Ej + Ei)
Weight of
influence
factor
(Wi)
Land use 1+1 0.5+0.5 3 16
Rainfall 1 0.5+0.5 2 11
Elevation 1 0.5+0.5 2 11
Lineament density 1+1 0 2 11
Soil type 1 0.5 1.5 8
Geomorphology 1+1+1 0.5 3.5 19
Drainage Density 1+1 0.5 2.5 13
Slope 1 0.5+0.5 2 11
∑ 18.5 ∑ 100
Fig. 4  Location map of training and validation wells in the study area
Content courtesy of Springer Nature, terms of use apply. Rights reserved.
2323
Comparison of multi‑influence factor, weight of evidence and…
1 3
The influencing factors assigned with weights and ranks were aggregated through follow-
ing formula.
where,—LUland use, RF—average annual rainfall, EL—elevation, LI—lineament, SO
—soil, G—geomorphology, DD—drainage density, SL—slope. In Eq. 2, w—layer weight
computed using MIF technique and, r refer to feature rank respectively.
2.3 WofE technique
The WofE is a quantitative data-driven technique concerning to Bayesian approach for
integrating data and used for the prediction of occurrence of events (Armas, 2012). This
technique calculates the weights for the presence or absence of groundwater influence fea-
tures based on the well existence in study area. The negative weight and positives weight
are the weights of evidence when a feature is absent and present, respectively. WofE tech-
nique requires data on pumping well’s location, as well as the thematic layers that influence
the groundwater potential. The location map of wells over the study area was prepared rep-
resenting 72 pumping wells, of which 51 pumping wells were utilized as training wells and
21 as validation wells as shown in Fig. 4. The verification wells were dedicatedly utilized
to verify results. The thematic layers which influence the groundwater occurrence were
overlaid on the training wells map. Based on this overlap, weights and WofE values of
probability were computed for each feature and employed for the demarcation of ground-
water potential zones.
The weights for each class of a layer were computed as:
where A—number of wells in feature, B—number of wells in study area, C—number of
pixels in feature, and D—number of pixels in study area.
WofE probability ­
(W+
P) for each feature were computed as:
where B—number of wells in study area, and D refers to number of pixels in study area.
2.3.1 FR technique
FR technique is a representative statistical approach used as a spatial mapping technique
for evaluating the association among observed and independent variables, together with
multiple features mapping (Oh et al., 2011). FR technique is based on the observed rela-
tionships, the correlation among each groundwater influencing factor and the location
of wells. FR technique requires the wells’ location and the thematic layers that influence
the groundwater occurrence. The location map of 72 pumping wells located in the study
(2)
Groundwater potential index = (LUW × LUr) + (RFW × RFr)
+(ELW × ELr) + (LIW × LIr)
+(SOW × SOr) + (GW × Gr)
+(DDW × DDr) + (SLW × SLr)
(3)
W+
= 1n
[
A∕B
C − A∕D − B
]
(4)
W+
P = exp
[∑
W+
1n
B
D
]
Content courtesy of Springer Nature, terms of use apply. Rights reserved.
2324 N. L. Rane, G. K. Jayaraj
1 3
area was prepared in which 51 were utilized as training wells and 21 wells to verify
results, as shown in Fig. 4. The thematic layers which influence groundwater occurrence
were superimposed over the training wells map, and FR value in each feature was com-
puted using the Eq. 5:
where P—number of wells present in each feature of the influencing factor; Q—num-
ber of total wells in study area; R—number of pixels present in each feature of the influ-
encing factor and, S—number of total pixels in study area. (Fig. 5).
After calculating FR, the groundwater potential map was created by summing up FR
values of each influencing factor and their features using the Eq. 6.
where FR—final weight for the FR technique and n refer to the number of total factors.
(5)
FR =
P∕Q
R∕S
(6)
Ground water potential index =
n
∑
i=1
FR
Fig. 5  Land use in the study area
Content courtesy of Springer Nature, terms of use apply. Rights reserved.
2325
Comparison of multi‑influence factor, weight of evidence and…
1 3
3 Results and discussion
3.1 Characterization of spatial variation of the hydrologic and hydrogeologic
conditions
The characterization of thematic layers was performed by classifying their features into appro-
priate groups that helpful for interpretation of their influence in the occurrence of groundwa-
ter. The features of eight influencing factors are described below, and the area occupied by
each feature is shown in Table 2. The study area experiences an average annual rainfall rang-
ing from 600 to 786 mm. The study area was clustered into five zones based on average annual
rainfall. Figure 6 revealed that the East-South portion of the basin receive lowest amount of
rainfall and western part experiences the highest rainfall. It is apparent from the slope map
that there is a steep slope (15.62°) present in the Northern mountains of the basin. As far as
concerned the ground water occurrence, this portion is considered as having poor groundwa-
ter potential because the water flows downward quickly and there is no time for infiltration.
From Fig. 11 it is discernible that, the East-South portion of the basin has almost flat topog-
raphy having 0–2.64% slope that indicates a favourable condition for groundwater potential.
The remaining part has an undulating topography which contributes to a slope of 2.6415.62°.
The thematic layer of drainage density in Fig. 10 indicates that about 66% of the area falls in
the drainage density of 0–0.77 km/km2
and considered as moderate and good for groundwater
potential. High drainage density results in the high runoff, indicating reduced infiltration and
therefore poor groundwater occurrence.
Lineament is associated with the secondary permeability in the basin. In order to determine
the lineament concentration in the study area the lineament density analysis was performed.
From Fig. 7 it is apparent that the lineament density varies from 0–0.09 km/km2
in the study
area whereas the density varies from 0.09–1.40 km/km2
, found in patches in north-western
portion. The higher lineament density is associated with the good groundwater occurrence.
The land use in study area is agricultural land (57.83%), vegetation (4.81%), water bodies
(3.70%), barren land (26.79%), and settlements (6.87%) (Fig. 5). Areas with a large num-
ber of concrete constructions and built-up areas are poor for groundwater occurrence due to
higher surface runoff, whereas agricultural land is good for groundwater occurrence because
of the availability of loose soil on the land. The clayey soil dominating in the study area, is
shown in Fig. 8 and is mostly seen on the land having gentle slope. Loam soil is present in the
higher elevations and inter hill basins. The loam soil is considered good for the groundwater
occurrence.
The topographic elevation in the study area is shown in Fig. 1. The study area has elevation
less than 615 m above mean sea level (AMSL) in the East-South parts, whereas the elevation
more than 733 m AMSL in the Northern portion as shown in Fig. 1. The high-altitudes results
in the poor groundwater potential since water flows towards the low altitude. The thematic
layer of geomorphology is shown in Fig. 9. The study area predominantly occupied by plateau
encompassing 90% of study area. The alluvium is observed along the middle course of river
covering about 1.5% of the area and structural and denudational hills occupying about 8.5% of
study area. (Figs. 10, 11).
Content courtesy of Springer Nature, terms of use apply. Rights reserved.
2326 N. L. Rane, G. K. Jayaraj
1 3
Table 2  Statistics of factors with their classes and area
Sr. No Thematic layer Feature of thematic layer Area ­(km2
) Area (%)
1 Land use Agricultural land 986.07 57.83
Vegetation 82.00 4.81
Water bodies 63.15 3.70
Barren land 456.86 26.79
Settlements 117.10 6.87
2 Rainfall (mm) 600–637 103.45 6.07
637–674 205.36 12.04
674–712 546.90 32.07
712–749 428.50 25.13
749–786 420.98 24.69
3 Elevation (m) 529–615 467.68 27.43
615–674 511.11 29.97
674–733 583.63 34.23
733–886 125.26 7.35
886–1,384 16.91 0.99
4 Lineament density (km/km2
) 0–0.09 1308.89 76.76
0.09–0.28 225.80 13.24
0.28–0.49 135.49 7.95
0.49–0.74 33.16 1.94
0.74–1.40 1.85 0.11
5 Soil Loam (Hydrologic soil group C) 144.80 8.49
Clay Loam (Hydrologic soil group D) 169.79 9.96
Clay Loam (Hydrologic soil group C) 449.09 26.34
Clay (Hydrologic soil group D: Clay 51%
wt.)
930.21 54.55
Clay (Hydrologic soil group D: Clay 52%
wt.)
12.30 0.72
6 Geomorphology Plateau 1544.63 90.58
Alluvium 20.73 1.22
Structural Hills 17.47 1.02
Denudational Hills 122.41 7.18
7 Drainage density(km/km2
) 0–0.46 378.01 22.17
0.46–0.77 746.80 43.80
0.77–1.06 504.10 29.56
1.06–1.38 72.34 4.24
1.38–2.50 3.93 0.23
8 Slope 0–2.64o
1014.73 59.51
2.64–6.88o
566.68 33.23
6.88–15.62o
89.55 5.25
15.62–29.66o
24.16 1.42
29.66–67.54o
9.52 0.56
Content courtesy of Springer Nature, terms of use apply. Rights reserved.
2327
Comparison of multi‑influence factor, weight of evidence and…
1 3
4 
Groundwater potential zone maps of the study area
4.1 MIF technique
According to the interrelationship among factors influencing the groundwater potential,
each thematic layer and their features were assigned with weights. The highest value
of weight shows the highest possibility of factor or feature on groundwater occurrence,
whereas the factor or feature having the lowest influence on groundwater occurrence is
assigned a minimum weight. The derivation of weights for the individual thematic layer
based on the interrelationship between factors is shown in Table 1. Table 3 shows the
assigned weights of each thematic layer and corresponding normalized weights of the
features.
The relative weights of eight hydrologic and hydrogeologic influencing factors and
their features were integrated, and groundwater potential was calculated in ArcGIS
platform. On the basis of groundwater potential, the study area was clustered into four
zones, namely ‘poor’, ‘moderate’, ‘good’, and ‘very good’ zones as shown in Fig. 12.
The 9.27% of study area is falling under ‘poor’ groundwater potential because of steep
slopes and dissected mountains present in these areas, while about 47.72% area is fall-
ing under ‘moderate’ potential. The ‘good’ groundwater potential area is found about
30.17% of the study area. Further, about 12.84% of study area is falling under ‘very
good’ groundwater potential.
Fig. 6  Rainfall in study area
Content courtesy of Springer Nature, terms of use apply. Rights reserved.
2328 N. L. Rane, G. K. Jayaraj
1 3
4.1.1 WofE technique
Table 4 presents the number of pixels and wells in each feature of the influencing factor.
The computation of WofE ­
(W+
) and WofE probability ­
(W+
P) for each feature of thematic
layer is computed using Eq. (3 and 4). The value obtained for ­
W+
and ­
W+
P for all the-
matic layers is tabulated and presented in Table 5. Finally, eight hydrologic and hydrogeo-
logic influencing factor were integrated in ArcGIS platform to delineate the groundwater
potential. Based on the groundwater potential, the study area was clustered into four zones,
namely ‘poor’, ‘moderate’, ‘good’, and ‘very good’ as shown in Fig. 13. According to the
groundwater potential delineated using WofE technique, 8.12% and 48.39% of area falls
under ‘poor’ and ‘moderate’ groundwater potential respectively. The 28.77% of study area
falling under ‘good’ groundwater potential while about 14.72% area falling under ‘very
good’ potential respectively.
4.1.2 FR technique
Referring Table 4, the number of pixels and wells in each feature of the influencing factor
are employed to compute FR value of each feature. The FR for each feature is computed
using Eq. 5 and presented in Table 5. Finally, eight hydrologic and hydrogeologic factors
Fig. 7  Lineament density in study area
Content courtesy of Springer Nature, terms of use apply. Rights reserved.
2329
Comparison of multi‑influence factor, weight of evidence and…
1 3
which influence the groundwater occurrence were aggregated in ArcGIS platform to delin-
eate groundwater potential. The identified groundwater potential further clustered into four
zones (Fig. 14). The ‘poor’ and ‘moderate’ groundwater potential are covering 7.83%, and
49.05% respectively of study area. Nearly 29.08% and 14.04% of study area are coming
under ‘good’ and ‘very good’ potential respectively.
4.2 Validation and efficacy of MIF, WofE and FR techniques
The verification of MIF technique through the yield data of 72 pumping wells shows that
3 ‘very high discharge’ (6 lps) wells out of 4 wells falls under ‘very good’ groundwater
potential and 32 ‘high discharge’ (4–6 lps) wells out of 34 wells falls under ‘good’ ground-
water potential. Moreover, 24 out of 33 ‘medium discharge’ (2–4 lps) wells falling under
‘moderate’ potential and no well out of 1 ‘low discharge’ (2 lps) well falling under ‘poor’
potential. The number of wells that agreed with the actual yield are 59, and the number of
pumping wells that disagreed with the actual yield are 13. Thus, the accuracy of prediction
using MIF technique is 81.94%.
The verification of WofE and FR technique was carried out through the yield data of
21 verification wells. The verification of WofE technique reveals that 1 out of 1 ‘very high
discharge’ well falls under ‘very good’ potential zone and 7 out of 8 ‘high discharge’ wells
under ‘good’ potential zone. While 8 out of 11 ‘medium discharge’ wells falling under
Fig. 8  Soil type in the study area
Content courtesy of Springer Nature, terms of use apply. Rights reserved.
2330 N. L. Rane, G. K. Jayaraj
1 3
‘moderate’ potential, and no well out of 1 ‘low discharge’ well falls under ‘poor’ potential
zone. The number of wells that agreed with actual yield are 16 and the number of wells
that disagreed with actual yield are 5. Thus, the accuracy of prediction using WofE model
is 76.19%.
The verification of FR technique reveals that 1 out of 1 ‘very high discharge’ wells falls
under ‘very good’ groundwater potential and 8 out of 8 ‘high discharge’ wells falls under
‘good’ potential. While, 6 out of 11 ‘medium discharge’ wells fall under ‘moderate’ poten-
tial, and no well out of 1 ‘low discharge’ well fall under ‘poor’ potential. The number of
wells that agreed with the actual yield are 15 and number of wells that disagreed with the
actual yield are 6. Thus, the accuracy of prediction using FR model is 71.43%.
The groundwater potential identified and delineated using MIF technique indicated that
‘poor’ groundwater potential covering 9.27% of the study area due to steep slopes and dis-
sected mountains are present in these areas, ‘moderate’ potential 47.72%, ‘good’ poten-
tial 30.17%, and ‘very good’ potential encompassing 12.84% of the study area. While the
groundwater potential delineated using WofE technique revealed that 8.12% of area has
‘poor’ potential, 48.39% ‘moderate’ potential, 28.77% ‘good’ potential and 14.72% ‘very
good’ potential. Moreover, the groundwater potential delineated using FR technique indi-
cated that 7.83% of the area falling under ‘poor’ potential, 49.05% of the area falls in the
‘moderate’ zone, 29.08% of the area falling under ‘good’ potential and 14.04% ‘very good’
potential. The main difference in the geospatial prediction is identified in poor zone of the
study area because there were no pumping wells in this zone. It is worth to note, that the
absence and presence of pumping wells influence the prediction of groundwater potential
in WofE technique, while the MIF technique only depends on the hydrologic and hydro-
geologic factors. Thus, the reliability of MIF technique is higher than the WofE and FR
Fig. 9  Geomorphology map of study area
Content courtesy of Springer Nature, terms of use apply. Rights reserved.
2331
Comparison of multi‑influence factor, weight of evidence and…
1 3
technique. Among the WofE and FR technique, the WofE technique outperformed than FR
technique. Therefore, it is recommended to use MIF technique to identify and delineate
groundwater potential zones. The WofE technique can be used as an alternate technique in
study area. Considering the requirement of pumping well data over the basin, the applica-
tion of WofE technique is limited, particularly in the regions where the data is scarce.
5 Conclusions
The primary objective of the present study was to evaluate the efficacy of geospatial tech-
nology-based MIF, WofE and FR techniques to predict groundwater potential of the basal-
tic aquifer system. The study considered the eight hydrological and hydrogeological factors
which influence the occurrence of groundwater. According to framework of these three
geospatial based techniques, thematic layers and their feature were assigned with suitable
weights and then these thematic layers were integrated into the ArcGIS platform. The pre-
dicted groundwater potential using the MIF technique showed ‘poor’ groundwater poten-
tial encompassing about 9.27% of study area, ‘moderate’ potential zone 47.72%, ‘good’
potential zone 30.17%, and ‘very good’ potential zone covering 12.84% of study area. In
comparison, predicted groundwater prospect using WofE method revealed that 8.12% of
area falling under ‘poor’ groundwater potential, 48.39% ‘moderate’ potential zone, 28.77%
Fig.10  
Drainage density in study area
Content courtesy of Springer Nature, terms of use apply. Rights reserved.
2332 N. L. Rane, G. K. Jayaraj
1 3
‘good’ potential zone and 14.72% ‘very good’ potential zone. Moreover, the predicted
groundwater potential using FR technique indicated that 7.83% of the area falling under
‘poor’ potential, 49.05% of area falling under ‘moderate’ potential, 29.08% of area fall-
ing under ‘good’ potential and 14.04% ‘very good’ potential. The validation showed that
the MIF technique has 81.94% prediction accuracy, followed by WofE technique (76.19%)
and FR technique (71.43%). Therefore, the MIF technique surpasses the WofE and FR
techniques.
It is concluded that the MIF technique is a most effective technique to evaluate the
groundwater potential zones on a large scale compared to WofE and FR techniques,
although the WofE technique performance somewhat comparable to the MIF technique.
Therefore, in order to obtain more reliable results, it is recommended to use MIF technique
to identify and demarcate the groundwater potential zones. If the sufficient data is available
to use WofE and FR technique, the use of WofE technique recommended over the FR tech-
nique. The delineated groundwater potential zones are useful for understanding the hidden
groundwater resource in study area and for identification of the suitable location of wells
and recharge structure in a cost-efficient way. Furthermore, it can be used to the hydrolo-
gists and planner to develop effective and pragmatic management strategies for addressing
uncertainties and risks associated with groundwater management. The results together with
the demonstrated framework can be reproduced in other basins for assessing the groundwa-
ter potential zones, regardless of hydrogeological conditions.
Fig. 11  Slope map of study area
Content courtesy of Springer Nature, terms of use apply. Rights reserved.
2333
Comparison of multi‑influence factor, weight of evidence and…
1 3
Table
3  Assigned
weights
of
the
eight
influencing
factors
with
normalized
weight
of
each
feature
Sr.
No
Thematic
layer
Weight
Feature
of
thematic
layer
Ranking
Normalized
weight
Total
weight
1
Land
use
16
Agricultural
land
12
0.26
0.0326
Vegetation
8
0.17
0.0217
Water
bodies
16
0.35
0.0435
Barren
land
6
0.13
0.0163
Settlements
4
0.09
0.0109
2
Rainfall
(mm)
11
600–637
3
0.09
0.0107
637–674
5
0.14
0.0179
674–712
7
0.20
0.0250
712–749
9
0.26
0.0321
749–786
11
0.31
0.0393
3
Elevation
(m)
11
529–615
11
0.31
0.0393
615–674
9
0.26
0.0321
674-
733
7
0.20
0.0250
733–886
5
0.14
0.0179
886–1,384
3
0.09
0.0107
4
Lineament
density
(km/km
2
)
11
0–0.09
3
0.09
0.0107
0.09–0.28
5
0.14
0.0179
0.28–0.49
7
0.20
0.0250
0.49–0.74
9
0.26
0.0321
0.74–1.40
11
0.31
0.0393
Content courtesy of Springer Nature, terms of use apply. Rights reserved.
2334 N. L. Rane, G. K. Jayaraj
1 3
Table
3  (continued)
Sr.
No
Thematic
layer
Weight
Feature
of
thematic
layer
Ranking
Normalized
weight
Total
weight
5
Soil
type
8
Loam
(Hydrologic
soil
group
C)
8
0.31
0.0385
Clay
Loam
(Hydrologic
soil
group
D)
5
0.19
0.0240
Clay
Loam
(Hydrologic
soil
group
C)
6
0.23
0.0288
Clay
(Hydrologic
soil
group
D:
Clay
51%
wt.)
4
0.15
0.0192
Clay
(Hydrologic
soil
group
D:
Clay
52%
wt.)
3
0.12
0.0144
6
Geomorphology
19
Plateau
9
0.23
0.0281
Alluvium
19
0.48
0.0594
Structural
Hills
5
0.13
0.0156
Denudational
Hills
7
0.18
0.0219
7
Drainage
Density
(km/km
2
)
13
0–0.46
5
0.11
0.0139
0.46–0.77
7
0.16
0.0194
0.77–1.06
9
0.20
0.0250
1.06–1.38
11
0.24
0.0306
1.38–2.50
13
0.29
0.0361
8
Slope
11
0–2.64
o
11
0.31
0.0393
2.64–6.88
o
9
0.26
0.0321
6.88–15.62
o
7
0.20
0.0250
15.62–29.66
o
5
0.14
0.0179
29.66–67.54
o
3
0.09
0.0107
Content courtesy of Springer Nature, terms of use apply. Rights reserved.
2335
Comparison of multi‑influence factor, weight of evidence and…
1 3
Fig.12  
Groundwater potential zones delineated using MIF Technique
Content courtesy of Springer Nature, terms of use apply. Rights reserved.
2336 N. L. Rane, G. K. Jayaraj
1 3
Table 4  Number of wells and pixels in each feature of the influencing factor
Sr. No Thematic layer Feature of thematic layer Number of
pixels in
domain
Number
of wells
1 Land use Agriculture 1,095,636 42
Vegetation 91,111 0
Water bodies 70,166 0
Barren land 507,625 0
Settlements 130,107 9
2 Rainfall (mm) 600–637 114,942 7
637–674 228,174 7
674–712 607,670 13
712–749 476,107 11
749–786 467,751 13
3 Elevation (m) 529–615 519,649 23
615–674 567,897 9
674–733 648,479 16
733–886 139,173 3
886–1,384 18,792 0
4 Lineament density (km/km2
) 0–0.09 1,454,325 35
0.09–0.28 250,884 8
0.28–0.49 150,544 5
0.49–0.74 36,839 3
0.74–1.40 2,053 0
5 Soil type Loam (Hydrologic soil group C) 160,884 3
Clay Loam (Hydrologic soil group D) 188,652 3
Clay Loam (Hydrologic soil group C) 498,986 14
Clay (Hydrologic soil group D: Clay 51%
wt.)
1,033,565 30
Clay (Hydrologic soil group D: Clay 52%
wt.)
13,662 1
6 Geomorphology Plateau 1,716,256 49
Alluvium 23,033 2
Structural Hills 19,411 0
Denudational Hills 136,011 0
7 Drainage Density (km/km2
) 0–0.46 420,008 4
0.46–0.77 829,776 27
0.77–1.06 560,106 17
1.06–1.38 80,383 3
1.38–2.50 4,372 0
8 Slope 0–2.64o
1,127,483 33
2.64–6.88o
629,649 15
6.88–15.62o 99,499 3
15.62–29.66o
26,839 0
29.66o
–67.54o
10,582 0
Content courtesy of Springer Nature, terms of use apply. Rights reserved.
2337
Comparison of multi‑influence factor, weight of evidence and…
1 3
Table
5  Spatial
relationship
among
each
influencing
factor
using
WofE
and
FR
technique
Sr.
No
Thematic
layer
Feature
of
thematic
layer
Area
%
Well
%
W
+
W
+
P
FR
1
Land
use/land
cover
Agriculture
57.83
82.35
0.3536
0.0000383
1.424
Vegetation
4.81
0.00
0.0000
0.0000269
0.000
Water
bodies
3.70
0.00
0.0000
0.0000269
0.000
Barren
land
26.79
0.00
0.0000
0.0000269
0.000
Settlements
6.87
17.65
0.9439
0.0000692
2.570
2
Rainfall
(mm)
600–637
6.07
13.73
0.8165
0.0000609
2.262
637–674
12.04
13.73
0.1308
0.0000307
1.140
674–712
32.07
25.49
−
0.2297
0.0000214
0.795
712–749
25.13
21.57
−
0.1528
0.0000231
0.858
749–786
24.69
25.49
0.0320
0.0000278
1.032
3
Elevation
(m)
529–615
27.43
45.10
0.4974
0.0000443
1.644
615–674
29.97
17.65
−
0.5297
0.0000158
0.589
674–733
34.23
31.37
−
0.0870
0.0000247
0.917
733–886
7.35
5.88
−
0.2221
0.0000216
0.801
886–1384
0.99
0.00
0.0000
0.0000269
0.000
4
Lineament
density
(km/km
2
)
0–0.09
76.76
68.63
−
0.1120
0.0000241
0.894
0.09–0.28
13.24
15.69
0.1695
0.0000319
1.185
0.28–0.49
7.95
9.80
0.2102
0.0000332
1.234
0.49–0.74
1.94
5.88
1.1071
0.0000814
3.025
0.74–1.40
0.11
0.00
0.0000
0.0000269
0.000
5
Soil
type
Loam
(Hydrologic
soil
group
C)
8.49
5.88
−
0.3671
0.0000186
0.693
Clay
Loam
(Hydrologic
soil
group
D)
9.96
5.88
−
0.5263
0.0000159
0.591
Clay
Loam
(Hydrologic
soil
group
C)
26.34
27.45
0.0415
0.0000281
1.042
Clay
(Hydrologic
soil
group
D:
Clay
51%
wt.)
54.55
58.82
0.0754
0.0000290
1.078
Clay
(Hydrologic
soil
group
D:
Clay
52%
wt.)
0.72
1.96
1.0004
0.0000732
2.719
Content courtesy of Springer Nature, terms of use apply. Rights reserved.
2338 N. L. Rane, G. K. Jayaraj
1 3
Table
5  (continued)
Sr.
No
Thematic
layer
Feature
of
thematic
layer
Area
%
Well
%
W
+
W
+
P
FR
6
Geomorphology
Plateau
90.58
96.08
0.0589
0.0000286
1.061
Alluvium
1.22
3.92
1.1713
0.0000868
3.226
Structural
Hills
1.02
0.00
0.0000
0.0000269
0.000
Denudational
Hills
7.18
0.00
0.0000
0.0000269
0.000
7
Drainage
Density
(km/km
2
)
0–0.46
22.17
7.84
−
1.0390
0.0000095
0.354
0.46–0.77
43.80
52.94
0.1897
0.0000325
1.209
0.77–1.06
29.56
33.33
0.1201
0.0000304
1.128
1.06–1.38
4.24
5.88
0.3268
0.0000373
1.386
1.38–2.50
0.23
0.00
0.0000
0.0000269
0.000
8
Slope
0–2.64
o
59.51
64.71
0.0838
0.0000293
1.087
2.64–6.88
o
33.23
29.41
−
0.1221
0.0000238
0.885
6.88–15.62
o
5.25
5.88
0.1135
0.0000302
1.120
15.62–29.66
o
1.42
0.00
0.0000
0.0000269
0.000
29.66–67.54
o
0.56
0.00
0.0000
0.0000269
0.000
W
+
weight
of
evidence,
­
W
+
P
weight
of
evidence
probability,
and
FR
frequency
ratio
Content courtesy of Springer Nature, terms of use apply. Rights reserved.
2339
Comparison of multi‑influence factor, weight of evidence and…
1 3
Fig. 13  Groundwater potential zones delineated using WofE Technique
Content courtesy of Springer Nature, terms of use apply. Rights reserved.
2340 N. L. Rane, G. K. Jayaraj
1 3
Funding No funding was received.
Declaration
Conflicts of interest None.
References
Achu, A. L., Thomas, J.,  Reghunath, R. (2020). Multi-criteria decision analysis for delineation of ground-
water potential zones in a tropical river basin using remote sensing, GIS and analytical hierarchy pro-
cess (AHP). Groundwater for Sustainable Development, 10, 100365.
Adimalla, N.,  Taloor, A. K. (2020). Hydrogeochemical investigation of groundwater quality in the hard
rock terrain of South India using Geographic Information System (GIS) and groundwater quality index
(GWQI) techniques. Groundwater for Sustainable Development, 10, 100288.
Akgun, A., Dag, S.,  Bulut, F. (2008). Landslide susceptibility mapping for a landslide-prone area
(Findikli, NE of Turkey) by likelihood-frequency ratio and weighted linear combination models. Envi-
ronmental Geology, 54(6), 1127–1143.
Fig. 14  Groundwater potential zones delineated using FR Technique
Content courtesy of Springer Nature, terms of use apply. Rights reserved.
2341
Comparison of multi‑influence factor, weight of evidence and…
1 3
Aksever, F., Davraz, A.,  Karaguzel, R. (2015). Groundwater balance estimation and sustainability in the
Sandıklı Basin (Afyonkarahisar/Turkey). Journal of Earth System Science, 124(4), 783–798.
Armaş, I. (2012). Weights of evidence method for landslide susceptibility mapping Prahova Subcarpathians,
Romania. Natural Hazards, 60(3), 937–950.
Arulbalaji, P., Padmalal, D.,  Sreelash, K. (2019). GIS and AHP techniques based delineation of ground-
water potential zones: a case study from southern Western Ghats. India. Scientific Reports, 9(1), 1–17.
Asoka, A., Gleeson, T., Wada, Y.,  Mishra, V. (2017). Relative contribution of monsoon precipitation and
pumping to changes in groundwater storage in India. Nature Geoscience, 10(2), 109–117.
Bear, J., Cheng, A. H. D., Sorek, S., Ouazar, D.,  Herrera, I. (1999). Seawater intrusion in coastal aquifers:
concepts, methods and practices (Vol. 14). Springer Science  Business Media.
CGWB (2014) Groundwater Information Nashik District Maharashtra. Central Ground Water Board, 1–17.
http://​cgwb.​gov.​in/​distr​ict_​profi​le/​mahar​ashtra/​nashik.​pdf. Accessed 4 September 2020
CGWB (2017) Dynamic groundwater resources of India. Central Ground Water Board, G. o. I. Ministry
of Jal Shakti. http://​cgwb.​gov.​in/​GW-​Asses​sment/​GWRA-​2017-​Natio​nal-​Compi​lation.​pdf. Accessed 7
September 2020.
Cao, C., Xu, P., Wang, Y., Chen, J., Zheng, L.,  Niu, C. (2016). Flash flood hazard susceptibility mapping
using frequency ratio and statistical index methods in coalmine subsidence areas. Sustainability, 8(9),
948.
Chowdhury, A., Jha, M. K., Chowdary, V. M.,  Mal, B. C. (2009). Integrated remote sensing and GIS-
based approach for assessing groundwater potential in West Medinipur district, West Bengal. India.
International Journal of Remote Sensing, 30(1), 231–250.
Corsini, A., Cervi, F.,  Ronchetti, F. (2009). Weight of evidence and artificial neural networks for potential
groundwater spring mapping: an application to the Mt. Modino area (Northern Apennines, Italy). Geo-
morphology, 111(1–2), 79–87.
Das, B., Pal, S. C., Malik, S.,  Chakrabortty, R. (2019). Modeling groundwater potential zones of Puruliya
district, West Bengal, India using remote sensing and GIS techniques. Geology, Ecology, and Land-
scapes, 3(3), 223–237.
Das, S.,  Pardeshi, S. D. (2018). Integration of different influencing factors in GIS to delineate ground-
water potential areas using IF and FR techniques: a study of Pravara basin, Maharashtra. India.
Applied Water Science, 8(7), 197.
Devi, P. S., Srinivasulu, S.,  Raju, K. K. (2001). Hydrogeomorphological and groundwater prospects
of the Pageru river basin by using remote sensing data. Environmental Geology, 40(9), 1088–1094.
Fashae, O. A., Tijani, M. N., Talabi, A. O.,  Adedeji, O. I. (2014). Delineation of groundwater poten-
tial zones in the crystalline basement terrain of SW-Nigeria: an integrated GIS and remote sensing
approach. Applied Water Science, 4(1), 19–38.
GSI. (2001). District Resources Map. Geological Survey of India Publications Calcutta.
Ganapuram, S., Kumar, G. V., Krishna, I. M., Kahya, E.,  Demirel, M. C. (2009). Mapping of ground-
water potential zones in the Musi basin using remote sensing data and GIS. Advances in Engineer-
ing Software, 40(7), 506–518.
Gayen, A.,  Saha, S. (2017). Application of weights-of-evidence (WoE) and evidential belief function
(EBF) models for the delineation of soil erosion vulnerable zones: a study on Pathro river basin,
Jharkhand. India. Modeling Earth Systems and Environment, 3(3), 1123–1139.
Ghasemi, A., Saghafian, B.,  Golian, S. (2017). System dynamics approach for simulating water
resources of an urban water system with emphasis on sustainability of groundwater. Environmental
Earth Sciences, 76(18), 637.
Ghorbani Nejad, S., Falah, F., Daneshfar, M., Haghizadeh, A.,  Rahmati, O. (2017). Delineation of
groundwater potential zones using remote sensing and GIS-based data-driven models. Geocarto
International, 32(2), 167–187.
Ghude, S. D., Jena, C., Chate, D. M., Beig, G., Pfister, G. G., Kumar, R.,  Ramanathan, V. (2014).
Reductions in India’s crop yield due to ozone. Geophysical Research Letters, 41(15), 5685–5691.
Gnanachandrasamy, G., Zhou, Y., Bagyaraj, M., Venkatramanan, S., Ramkumar, T.,  Wang, S. (2018).
Remote sensing and GIS based groundwater potential zone mapping in Ariyalur District, Tamil
Nadu. Journal of the Geological Society of India, 92(4), 484–490.
Gumma, M. K.,  Pavelic, P. (2013). Mapping of groundwater potential zones across Ghana using
remote sensing, geographic information systems, and spatial modeling. Environmental Monitoring
and Assessment, 185(4), 3561–3579.
Gupta, M.,  Srivastava, P. K. (2010). Integrating GIS and remote sensing for identification of ground-
water potential zones in the hilly terrain of Pavagarh, Gujarat. India. Water International, 35(2),
233–245.
Gurdak, J. J. (2017). Groundwater: Climate-induced pumping. Nature Geoscience, 10(2), 71–71.
Content courtesy of Springer Nature, terms of use apply. Rights reserved.
2342 N. L. Rane, G. K. Jayaraj
1 3
Hembram, T. K., Paul, G. C.,  Saha, S. (2019). Comparative analysis between morphometry and geo-
environmental factor based soil erosion risk assessment using weight of evidence model: A study
on jainti river basin. Eastern India. Environmental Processes, 6(4), 883–913.
Hong, H., Ilia, I., Tsangaratos, P., Chen, W.,  Xu, C. (2017). A hybrid fuzzy weight of evidence method
in landslide susceptibility analysis on the Wuyuan area, China. Geomorphology, 290, 1–16.
Hong, H., Tsangaratos, P., Ilia, I., Liu, J., Zhu, A. X.,  Chen, W. (2018). Application of fuzzy weight of
evidence and data mining techniques in construction of flood susceptibility map of Poyang County,
China. Science of the Total Environment, 625, 575–588.
Jenifer, M. A.,  Jha, M. K. (2017). Comparison of Analytic Hierarchy Process, Catastrophe and
Entropy techniques for evaluating groundwater prospect of hard-rock aquifer systems. Journal of
Hydrology, 548, 605–624.
Jha, M. K., Chowdhury, A., Chowdary, V. M.,  Peiffer, S. (2007). Groundwater management and
development by integrated remote sensing and geographic information systems: prospects and con-
straints. Water Resources Management, 21(2), 427–467.
Katpatal, Y. B., Pophare, A. M.,  Lamsoge, B. R. (2014). A groundwater flow model for overexploited
basaltic aquifer and Bazada formation in India. Environmental Earth Sciences, 72(11), 4413–4425.
Kaur, L., Rishi, M. S., Singh, G.,  Thakur, S. N. (2020). Groundwater potential assessment of an allu-
vial aquifer in Yamuna sub-basin (Panipat region) using remote sensing and GIS techniques in con-
junction with analytical hierarchy process (AHP) and catastrophe theory (CT). Ecological Indica-
tors, 110, 105850.
Kayastha, P., Dhital, M. R.,  De Smedt, F. (2012). Landslide susceptibility mapping using the weight
of evidence method in the Tinau watershed. Nepal. Natural Hazards, 63(2), 479–498.
Kim, J. C., Jung, H. S.,  Lee, S. (2019). Spatial mapping of the groundwater potential of the geum river
basin using ensemble models based on remote sensing images. Remote Sensing, 11(19), 2285.
Krishnamurthy, J., Venkatesa Kumar, N., Jayaraman, V.,  Manivel, M. (1996). An approach to demar-
cate ground water potential zones through remote sensing and a geographical information system.
International Journal of Remote Sensing, 17(10), 1867–1884.
Kumar, D. P. K., Gopinath, G.,  Seralathan, P. (2007). Application of remote sensing and GIS for the
demarcation of groundwater potential zones of a river basin in Kerala, southwest coast of India.
International Journal of Remote Sensing, 28(24), 5583–5601.
Lee, G. F.,  Jones-Lee, A. (2004). Appropriate use of chemical information in a best professional judg-
ment triad weight-of-evidence evaluation of sediment quality. Aquatic Ecosystem Health  Man-
agement, 7(3), 351–356.
Lee, S., Kim, Y. S.,  Oh, H. J. (2012). Application of a weights-of-evidence method and GIS to regional
groundwater productivity potential mapping. Journal of Environmental Management, 96(1), 91–105.
Lee, S.,  Pradhan, B. (2007). Landslide hazard mapping at Selangor, Malaysia using frequency ratio
and logistic regression models. Landslides, 4(1), 33–41.
Machiwal, D., Jha, M. K.,  Mal, B. C. (2011). Assessment of groundwater potential in a semi-arid
region of India using remote sensing, GIS and MCDM techniques. Water Resources Management,
25(5), 1359–1386.
Magesh, N. S., Chandrasekar, N.,  Soundranayagam, J. P. (2012). Delineation of groundwater potential
zones in Theni district, Tamil Nadu, using remote sensing. GIS and MIF Techniques. Geoscience
Frontiers, 3(2), 189–196.
Mahmoud, S. H. (2014). Delineation of potential sites for groundwater recharge using a GIS-based deci-
sion support system. Environmental Earth Sciences, 72(9), 3429–3442.
Mohammady, M., Pourghasemi, H. R.,  Amiri, M. (2019). Assessment of land subsidence susceptibil-
ity in Semnan plain (Iran): A comparison of support vector machine and weights of evidence data
mining algorithms. Natural Hazards, 99(2), 951–971.
Murthy, K. S. R. (2000). Ground water potential in a semi-arid region of Andhra Pradesh-a geographical
information system approach. International Journal of Remote Sensing, 21(9), 1867–1884.
Oh, H. J., Kim, Y. S., Choi, J. K., Park, E.,  Lee, S. (2011). GIS mapping of regional probabilistic
groundwater potential in the area of Pohang City. Korea. Journal of Hydrology, 399(3–4), 158–172.
Palmer, M. A., Reidy Liermann, C. A., Nilsson, C., Flörke, M., Alcamo, J., Lake, P. S.,  Bond, N.
(2008). Climate change and the world’s river basins: anticipating management options. Frontiers in
Ecology and the Environment, 6(2), 81–89.
Pande, C. B., Moharir, K. N., Singh, S. K.,  Varade, A. M. (2019). An integrated approach to delineate
the groundwater potential zones in Devdari watershed area of Akola district, Maharashtra, Central
India. Environment, Development and Sustainability, 1–21.
Content courtesy of Springer Nature, terms of use apply. Rights reserved.
2343
Comparison of multi‑influence factor, weight of evidence and…
1 3
Parisi, A., Monno, V.,  Fidelibus, M. D. (2018). Cascading vulnerability scenarios in the management
of groundwater depletion and salinization in semi-arid areas. International Journal of Disaster Risk
Reduction, 30, 292–305.
Pinto, D., Shrestha, S., Babel, M. S.,  Ninsawat, S. (2017). Delineation of groundwater potential zones
in the Comoro watershed, Timor Leste using GIS, remote sensing and analytic hierarchy process
(AHP) technique. Applied Water Science, 7(1), 503–519.
Raju, R. S., Raju, G. S.,  Rajasekhar, M. (2019). Identification of groundwater potential zones in Man-
davi River basin, Andhra Pradesh, India using remote sensing, GIS and MIF techniques. HydroRe-
search, 2, 1–11.
Rane, N.,  Jayaraj, G. K. (2021). Stratigraphic modeling and hydraulic characterization of a typical
basaltic aquifer system in the Kadva river basin, Nashik. India. Model. Earth Syst. Environ., 7,
293–306.
Razandi, Y., Pourghasemi, H. R., Neisani, N. S.,  Rahmati, O. (2015). Application of analytical hierar-
chy process, frequency ratio, and certainty factor models for groundwater potential mapping using
GIS. Earth Science Informatics, 8(4), 867–883.
Roy, A., Keesari, T., Sinha, U. K.,  Sabarathinam, C. (2019). Delineating groundwater prospect zones
in a region with extreme climatic conditions using GIS and remote sensing techniques: A case
study from central India. Journal of Earth System Science, 128(8), 1–19.
Sahoo, S., Jha, M. K., Kumar, N.,  Chowdary, V. M. (2015). Evaluation of GIS-based multicriteria
decision analysis and probabilistic modeling for exploring groundwater prospects. Environmental
Earth Sciences, 74(3), 2223–2246.
Sahoo, S., Munusamy, S. B., Dhar, A., Kar, A.,  Ram, P. (2017). Appraising the accuracy of multi-class
frequency ratio and weights of evidence method for delineation of regional groundwater potential
zones in canal command system. Water Resources Management, 31(14), 4399–4413.
Sanderson, H., Dyer, S. D., Price, B. B., Nielsen, A. M., van Compernolle, R., Selby, M., Stanton, K.,
Evans, A., Ciarlo, M.,  Sedlak, R. (2006). Occurrence and weight-of-evidence risk assessment
of alkyl sulfates, alkyl ethoxysulfates, and linear alkylbenzene sulfonates (LAS) in river water and
sediments. Science of the Total Environment, 368(2–3), 695–712.
Selvakumar, S., Chandrasekar, N., Kaliraj, S.,  Magesh, N. S. (2018). Salinization of shallow aquifer in
the Karamaniyar river basin, Southern India. Environment, Development and Sustainability, 20(3),
1255–1273.
Shah, T. (2009). Climate change and groundwater: India’s opportunities for mitigation and adaptation.
Environmental Research Letters, 4(3), 035005.
Shah, T. (2010). Taming the anarchy: Groundwater governance in South Asia. England: Routledge.
Shahid, S., Nath, S.,  Roy, J. (2000). Groundwater potential modelling in a soft rock area using a GIS.
International Journal of Remote Sensing, 21(9), 1919–1924.
Shahinuzzaman, M., Haque, M. N.,  Shahid, S. (2021). Delineation of groundwater potential zones
using a parsimonious concept based on catastrophe theory and analytical hierarchy process. Hydro-
geology Journal, 1–26.
Singh, A. (2014). Groundwater resources management through the applications of simulation modeling:
a review. Science of the Total Environment, 499, 414–423.
Singh, L. K., Jha, M. K.,  Chowdary, V. M. (2018). Assessing the accuracy of GIS-based Multi-Cri-
teria Decision Analysis approaches for mapping groundwater potential. Ecological Indicators, 91,
24–37.
Srinivasa Rao, Y.,  Jugran, D. K. (2003). Delineation of groundwater potential zones and zones of
groundwater quality suitable for domestic purposes using remote sensing and GIS. Hydrological
Sciences Journal, 48(5), 821–833.
Tahmassebipoor, N., Rahmati, O., Noormohamadi, F.,  Lee, S. (2016). Spatial analysis of groundwater
potential using weights-of-evidence and evidential belief function models and remote sensing. Ara-
bian Journal of Geosciences, 9(1), 79.
Tehrany, M. S., Pradhan, B.,  Jebur, M. N. (2014). Flood susceptibility mapping using a novel ensemble
weights-of-evidence and support vector machine models in GIS. Journal of Hydrology, 512, 332–343.
Thapa, R., Gupta, S., Gupta, A., Reddy, D. V.,  Kaur, H. (2018). Use of geospatial technology for delin-
eating groundwater potential zones with an emphasis on water-table analysis in Dwarka River basin,
Birbhum. India. Hydrogeology Journal, 26(3), 899–922.
Tolche, A. D. (2021). Groundwater potential mapping using geospatial techniques: a case study of Dhung-
eta-Ramis sub-basin, Ethiopia. Geology, Ecology, and Landscapes, 5(1), 65–80.
Tsanis, I. K.,  Apostolaki, M. G. (2009). Estimating groundwater withdrawal in poorly gauged agricultural
basins. Water Resources Management, 23(6), 1097–1123.
Content courtesy of Springer Nature, terms of use apply. Rights reserved.
2344 N. L. Rane, G. K. Jayaraj
1 3
Vasanthavigar, M., Srinivasamoorthy, K., Vijayaragavan, K., Ganthi, R. R., Chidambaram, S., Anandhan,
P., Manivannan, R.,  Vasudevan, S. (2010). Application of water quality index for groundwater qual-
ity assessment: Thirumanimuttar sub-basin, Tamilnadu. India. Environmental Monitoring and Assess-
ment, 171(1–4), 595–609.
Voudouris, K. S. (2006). Groundwater balance and safe yield of the coastal aquifer system in NEastern
Korinthia. Greece. Applied Geography, 26(3–4), 291–311.
Wada, Y., Van Beek, L. P., Van Kempen, C. M., Reckman, J. W., Vasak, S.,  Bierkens, M. F. (2010).
Global depletion of groundwater resources. Geophysical research letters. https://​doi.​org/​10.​1029/​
2010G​L0445​71
Wagh, V. M., Panaskar, D. B., Muley, A. A.,  Mukate, S. V. (2017). Groundwater suitability evaluation by
CCME WQI model for Kadava river basin, Nashik, Maharashtra. India. Modeling Earth Systems and
Environment, 3(2), 557–565.
Waikar, M. L.,  Nilawar, A. P. (2014). Identification of groundwater potential zone using remote sensing
and GIS technique. International Journal of Innovative Research in Science, Engineering and Technol-
ogy, 3(5), 12163–12174.
Xu, C., Xu, X., Dai, F., Xiao, J., Tan, X.,  Yuan, R. (2012). Landslide hazard mapping using GIS and
weight of evidence model in Qingshui river watershed of 2008 Wenchuan earthquake struck region.
Journal of Earth Science, 23(1), 97–120.
Yeh, H. F., Cheng, Y. S., Lin, H. I.,  Lee, C. H. (2016). Mapping groundwater recharge potential zone
using a GIS approach in Hualian River. Taiwan. Sustainable Environment Research, 26(1), 33–43.
Yeh, H. F., Lee, C. H., Hsu, K. C.,  Chang, P. H. (2009). GIS for the assessment of the groundwater
recharge potential zone. Environmental Geology, 58(1), 185–195.
Yesilnacar, M. I., Sahinkaya, E., Naz, M.,  Ozkaya, B. (2008). Neural network prediction of nitrate in
groundwater of Harran Plain. Turkey. Environmental Geology, 56(1), 19–25.
Zhu, Q.,  Abdelkareem, M. (2021). Mapping groundwater potential zones using a knowledge-driven
approach and GIS analysis. Water, 13(5), 579.
Publisher’s Note Springer Nature remains neutral with regard to jurisdictional claims in published maps and
institutional affiliations.
Content courtesy of Springer Nature, terms of use apply. Rights reserved.
1.
2.
3.
4.
5.
6.
Terms and Conditions
Springer Nature journal content, brought to you courtesy of Springer Nature Customer Service Center
GmbH (“Springer Nature”).
Springer Nature supports a reasonable amount of sharing of research papers by authors, subscribers
and authorised users (“Users”), for small-scale personal, non-commercial use provided that all
copyright, trade and service marks and other proprietary notices are maintained. By accessing,
sharing, receiving or otherwise using the Springer Nature journal content you agree to these terms of
use (“Terms”). For these purposes, Springer Nature considers academic use (by researchers and
students) to be non-commercial.
These Terms are supplementary and will apply in addition to any applicable website terms and
conditions, a relevant site licence or a personal subscription. These Terms will prevail over any
conflict or ambiguity with regards to the relevant terms, a site licence or a personal subscription (to
the extent of the conflict or ambiguity only). For Creative Commons-licensed articles, the terms of
the Creative Commons license used will apply.
We collect and use personal data to provide access to the Springer Nature journal content. We may
also use these personal data internally within ResearchGate and Springer Nature and as agreed share
it, in an anonymised way, for purposes of tracking, analysis and reporting. We will not otherwise
disclose your personal data outside the ResearchGate or the Springer Nature group of companies
unless we have your permission as detailed in the Privacy Policy.
While Users may use the Springer Nature journal content for small scale, personal non-commercial
use, it is important to note that Users may not:
use such content for the purpose of providing other users with access on a regular or large scale
basis or as a means to circumvent access control;
use such content where to do so would be considered a criminal or statutory offence in any
jurisdiction, or gives rise to civil liability, or is otherwise unlawful;
falsely or misleadingly imply or suggest endorsement, approval , sponsorship, or association
unless explicitly agreed to by Springer Nature in writing;
use bots or other automated methods to access the content or redirect messages
override any security feature or exclusionary protocol; or
share the content in order to create substitute for Springer Nature products or services or a
systematic database of Springer Nature journal content.
In line with the restriction against commercial use, Springer Nature does not permit the creation of a
product or service that creates revenue, royalties, rent or income from our content or its inclusion as
part of a paid for service or for other commercial gain. Springer Nature journal content cannot be
used for inter-library loans and librarians may not upload Springer Nature journal content on a large
scale into their, or any other, institutional repository.
These terms of use are reviewed regularly and may be amended at any time. Springer Nature is not
obligated to publish any information or content on this website and may remove it or features or
functionality at our sole discretion, at any time with or without notice. Springer Nature may revoke
this licence to you at any time and remove access to any copies of the Springer Nature journal content
which have been saved.
To the fullest extent permitted by law, Springer Nature makes no warranties, representations or
guarantees to Users, either express or implied with respect to the Springer nature journal content and
all parties disclaim and waive any implied warranties or warranties imposed by law, including
merchantability or fitness for any particular purpose.
Please note that these rights do not automatically extend to content, data or other material published
by Springer Nature that may be licensed from third parties.
If you would like to use or distribute our Springer Nature journal content to a wider audience or on a
regular basis or in any other manner not expressly permitted by these Terms, please contact Springer
Nature at
onlineservice@springernature.com

Mais conteúdo relacionado

Semelhante a Comparison of multi‑infuence factor, weight of evidence and frequency ratio techniques to evaluate groundwater potential zones of basaltic aquifer systems

Application of GIS and MODFLOW to Ground Water Hydrology- A Review
Application of GIS and MODFLOW to Ground Water Hydrology- A ReviewApplication of GIS and MODFLOW to Ground Water Hydrology- A Review
Application of GIS and MODFLOW to Ground Water Hydrology- A ReviewIJERA Editor
 
Flood Inundation Mapping(FIM) and Climate Change Impacts(CCI) using Simulatio...
Flood Inundation Mapping(FIM) and Climate Change Impacts(CCI) using Simulatio...Flood Inundation Mapping(FIM) and Climate Change Impacts(CCI) using Simulatio...
Flood Inundation Mapping(FIM) and Climate Change Impacts(CCI) using Simulatio...IRJET Journal
 
A Study of Disaster Management & Geotechnical Investigation of Landslides: A ...
A Study of Disaster Management & Geotechnical Investigation of Landslides: A ...A Study of Disaster Management & Geotechnical Investigation of Landslides: A ...
A Study of Disaster Management & Geotechnical Investigation of Landslides: A ...IRJET Journal
 
IRJET - Quantitative Morphometric Analysis of Adhala Basin, Ahmednagar Mahara...
IRJET - Quantitative Morphometric Analysis of Adhala Basin, Ahmednagar Mahara...IRJET - Quantitative Morphometric Analysis of Adhala Basin, Ahmednagar Mahara...
IRJET - Quantitative Morphometric Analysis of Adhala Basin, Ahmednagar Mahara...IRJET Journal
 
Land use Land Cover change mapping using Remote Sensing and GIS: A case study...
Land use Land Cover change mapping using Remote Sensing and GIS: A case study...Land use Land Cover change mapping using Remote Sensing and GIS: A case study...
Land use Land Cover change mapping using Remote Sensing and GIS: A case study...IRJET Journal
 
Landuse and Landcover analysis using Remote Sensing and GIS: A Case Study in ...
Landuse and Landcover analysis using Remote Sensing and GIS: A Case Study in ...Landuse and Landcover analysis using Remote Sensing and GIS: A Case Study in ...
Landuse and Landcover analysis using Remote Sensing and GIS: A Case Study in ...IRJET Journal
 
[International agrophysics] ground penetrating radar for underground sensing ...
[International agrophysics] ground penetrating radar for underground sensing ...[International agrophysics] ground penetrating radar for underground sensing ...
[International agrophysics] ground penetrating radar for underground sensing ...Minal Ghugal
 
Impact of Land-use and Land-cover Change Dynamics on Flooding: A Case Study o...
Impact of Land-use and Land-cover Change Dynamics on Flooding: A Case Study o...Impact of Land-use and Land-cover Change Dynamics on Flooding: A Case Study o...
Impact of Land-use and Land-cover Change Dynamics on Flooding: A Case Study o...IRJET Journal
 
Application of GIS and Remote Sensing in Flood Risk Management
Application of GIS and Remote Sensing in Flood Risk ManagementApplication of GIS and Remote Sensing in Flood Risk Management
Application of GIS and Remote Sensing in Flood Risk ManagementAmitSaha123
 
Physically Based Runoff and Sediment Modelling of Rawal Watershed
Physically Based Runoff and Sediment Modelling of Rawal WatershedPhysically Based Runoff and Sediment Modelling of Rawal Watershed
Physically Based Runoff and Sediment Modelling of Rawal WatershedIRJET Journal
 
IRJET- Mapping Change in Water Spread Area of Himayatsagar using Remote Sensi...
IRJET- Mapping Change in Water Spread Area of Himayatsagar using Remote Sensi...IRJET- Mapping Change in Water Spread Area of Himayatsagar using Remote Sensi...
IRJET- Mapping Change in Water Spread Area of Himayatsagar using Remote Sensi...IRJET Journal
 
IRJET- Flood Susceptibility Assessment through GIS-Based Multi-Criteria Appro...
IRJET- Flood Susceptibility Assessment through GIS-Based Multi-Criteria Appro...IRJET- Flood Susceptibility Assessment through GIS-Based Multi-Criteria Appro...
IRJET- Flood Susceptibility Assessment through GIS-Based Multi-Criteria Appro...IRJET Journal
 
76201930
7620193076201930
76201930IJRAT
 
Ahmed_2016_IOP_Conf._Ser.__Earth_Environ._Sci._37_012044.pdf
Ahmed_2016_IOP_Conf._Ser.__Earth_Environ._Sci._37_012044.pdfAhmed_2016_IOP_Conf._Ser.__Earth_Environ._Sci._37_012044.pdf
Ahmed_2016_IOP_Conf._Ser.__Earth_Environ._Sci._37_012044.pdfAbdirahmanJibril4
 
LAND USE /LAND COVER CLASSIFICATION AND CHANGE DETECTION USING GEOGRAPHICAL I...
LAND USE /LAND COVER CLASSIFICATION AND CHANGE DETECTION USING GEOGRAPHICAL I...LAND USE /LAND COVER CLASSIFICATION AND CHANGE DETECTION USING GEOGRAPHICAL I...
LAND USE /LAND COVER CLASSIFICATION AND CHANGE DETECTION USING GEOGRAPHICAL I...IAEME Publication
 
Remote Sensing and GIS-Based Monitoring of Land Use Change in Nagpur District...
Remote Sensing and GIS-Based Monitoring of Land Use Change in Nagpur District...Remote Sensing and GIS-Based Monitoring of Land Use Change in Nagpur District...
Remote Sensing and GIS-Based Monitoring of Land Use Change in Nagpur District...IRJET Journal
 
5. Flood-risk assessment in urban environment by
5. Flood-risk assessment in urban environment by5. Flood-risk assessment in urban environment by
5. Flood-risk assessment in urban environment byDr. Ravinder Jangra
 

Semelhante a Comparison of multi‑infuence factor, weight of evidence and frequency ratio techniques to evaluate groundwater potential zones of basaltic aquifer systems (20)

Application of GIS and MODFLOW to Ground Water Hydrology- A Review
Application of GIS and MODFLOW to Ground Water Hydrology- A ReviewApplication of GIS and MODFLOW to Ground Water Hydrology- A Review
Application of GIS and MODFLOW to Ground Water Hydrology- A Review
 
Flood Inundation Mapping(FIM) and Climate Change Impacts(CCI) using Simulatio...
Flood Inundation Mapping(FIM) and Climate Change Impacts(CCI) using Simulatio...Flood Inundation Mapping(FIM) and Climate Change Impacts(CCI) using Simulatio...
Flood Inundation Mapping(FIM) and Climate Change Impacts(CCI) using Simulatio...
 
A Study of Disaster Management & Geotechnical Investigation of Landslides: A ...
A Study of Disaster Management & Geotechnical Investigation of Landslides: A ...A Study of Disaster Management & Geotechnical Investigation of Landslides: A ...
A Study of Disaster Management & Geotechnical Investigation of Landslides: A ...
 
FINAL REPORT
FINAL REPORTFINAL REPORT
FINAL REPORT
 
IRJET - Quantitative Morphometric Analysis of Adhala Basin, Ahmednagar Mahara...
IRJET - Quantitative Morphometric Analysis of Adhala Basin, Ahmednagar Mahara...IRJET - Quantitative Morphometric Analysis of Adhala Basin, Ahmednagar Mahara...
IRJET - Quantitative Morphometric Analysis of Adhala Basin, Ahmednagar Mahara...
 
Land use Land Cover change mapping using Remote Sensing and GIS: A case study...
Land use Land Cover change mapping using Remote Sensing and GIS: A case study...Land use Land Cover change mapping using Remote Sensing and GIS: A case study...
Land use Land Cover change mapping using Remote Sensing and GIS: A case study...
 
Landuse and Landcover analysis using Remote Sensing and GIS: A Case Study in ...
Landuse and Landcover analysis using Remote Sensing and GIS: A Case Study in ...Landuse and Landcover analysis using Remote Sensing and GIS: A Case Study in ...
Landuse and Landcover analysis using Remote Sensing and GIS: A Case Study in ...
 
[International agrophysics] ground penetrating radar for underground sensing ...
[International agrophysics] ground penetrating radar for underground sensing ...[International agrophysics] ground penetrating radar for underground sensing ...
[International agrophysics] ground penetrating radar for underground sensing ...
 
Impact of Land-use and Land-cover Change Dynamics on Flooding: A Case Study o...
Impact of Land-use and Land-cover Change Dynamics on Flooding: A Case Study o...Impact of Land-use and Land-cover Change Dynamics on Flooding: A Case Study o...
Impact of Land-use and Land-cover Change Dynamics on Flooding: A Case Study o...
 
Application of GIS and Remote Sensing in Flood Risk Management
Application of GIS and Remote Sensing in Flood Risk ManagementApplication of GIS and Remote Sensing in Flood Risk Management
Application of GIS and Remote Sensing in Flood Risk Management
 
Physically Based Runoff and Sediment Modelling of Rawal Watershed
Physically Based Runoff and Sediment Modelling of Rawal WatershedPhysically Based Runoff and Sediment Modelling of Rawal Watershed
Physically Based Runoff and Sediment Modelling of Rawal Watershed
 
IRJET- Mapping Change in Water Spread Area of Himayatsagar using Remote Sensi...
IRJET- Mapping Change in Water Spread Area of Himayatsagar using Remote Sensi...IRJET- Mapping Change in Water Spread Area of Himayatsagar using Remote Sensi...
IRJET- Mapping Change in Water Spread Area of Himayatsagar using Remote Sensi...
 
IRJET- Flood Susceptibility Assessment through GIS-Based Multi-Criteria Appro...
IRJET- Flood Susceptibility Assessment through GIS-Based Multi-Criteria Appro...IRJET- Flood Susceptibility Assessment through GIS-Based Multi-Criteria Appro...
IRJET- Flood Susceptibility Assessment through GIS-Based Multi-Criteria Appro...
 
Ijciet 10 01_181
Ijciet 10 01_181Ijciet 10 01_181
Ijciet 10 01_181
 
76201930
7620193076201930
76201930
 
Ahmed_2016_IOP_Conf._Ser.__Earth_Environ._Sci._37_012044.pdf
Ahmed_2016_IOP_Conf._Ser.__Earth_Environ._Sci._37_012044.pdfAhmed_2016_IOP_Conf._Ser.__Earth_Environ._Sci._37_012044.pdf
Ahmed_2016_IOP_Conf._Ser.__Earth_Environ._Sci._37_012044.pdf
 
LAND USE /LAND COVER CLASSIFICATION AND CHANGE DETECTION USING GEOGRAPHICAL I...
LAND USE /LAND COVER CLASSIFICATION AND CHANGE DETECTION USING GEOGRAPHICAL I...LAND USE /LAND COVER CLASSIFICATION AND CHANGE DETECTION USING GEOGRAPHICAL I...
LAND USE /LAND COVER CLASSIFICATION AND CHANGE DETECTION USING GEOGRAPHICAL I...
 
Remote Sensing and GIS-Based Monitoring of Land Use Change in Nagpur District...
Remote Sensing and GIS-Based Monitoring of Land Use Change in Nagpur District...Remote Sensing and GIS-Based Monitoring of Land Use Change in Nagpur District...
Remote Sensing and GIS-Based Monitoring of Land Use Change in Nagpur District...
 
10. aneesha rahman and madha suresh
10. aneesha rahman and madha suresh10. aneesha rahman and madha suresh
10. aneesha rahman and madha suresh
 
5. Flood-risk assessment in urban environment by
5. Flood-risk assessment in urban environment by5. Flood-risk assessment in urban environment by
5. Flood-risk assessment in urban environment by
 

Mais de nitinrane33

Contribution and performance of ChatGPT and other Large Language Models (LLM...
Contribution and performance of ChatGPT and other Large Language  Models (LLM...Contribution and performance of ChatGPT and other Large Language  Models (LLM...
Contribution and performance of ChatGPT and other Large Language Models (LLM...nitinrane33
 
ChatGPT is not capable of serving as an author: ethical concerns and challe...
 ChatGPT is not capable of serving as an author: ethical concerns and  challe... ChatGPT is not capable of serving as an author: ethical concerns and  challe...
ChatGPT is not capable of serving as an author: ethical concerns and challe...nitinrane33
 
Enhancing customer loyalty through quality of service: Effective strategies t...
Enhancing customer loyalty through quality of service: Effective strategies t...Enhancing customer loyalty through quality of service: Effective strategies t...
Enhancing customer loyalty through quality of service: Effective strategies t...nitinrane33
 
Remote Sensing (RS), UAV/drones, and Machine Learning (ML) as powerful techni...
Remote Sensing (RS), UAV/drones, and Machine Learning (ML) as powerful techni...Remote Sensing (RS), UAV/drones, and Machine Learning (ML) as powerful techni...
Remote Sensing (RS), UAV/drones, and Machine Learning (ML) as powerful techni...nitinrane33
 
Fuzzy AHP and Fuzzy TOPSIS as an effective and powerful Multi-Criteria Decisi...
Fuzzy AHP and Fuzzy TOPSIS as an effective and powerful Multi-Criteria Decisi...Fuzzy AHP and Fuzzy TOPSIS as an effective and powerful Multi-Criteria Decisi...
Fuzzy AHP and Fuzzy TOPSIS as an effective and powerful Multi-Criteria Decisi...nitinrane33
 
Effectiveness and Capability of Remote Sensing (RS) and Geographic Informatio...
Effectiveness and Capability of Remote Sensing (RS) and Geographic Informatio...Effectiveness and Capability of Remote Sensing (RS) and Geographic Informatio...
Effectiveness and Capability of Remote Sensing (RS) and Geographic Informatio...nitinrane33
 
Multi-Criteria Decision-Making (MCDM) as a powerful tool for sustainable deve...
Multi-Criteria Decision-Making (MCDM) as a powerful tool for sustainable deve...Multi-Criteria Decision-Making (MCDM) as a powerful tool for sustainable deve...
Multi-Criteria Decision-Making (MCDM) as a powerful tool for sustainable deve...nitinrane33
 
Framework Towards Achieving Sustainable Strategies for Water Usage and Wastag...
Framework Towards Achieving Sustainable Strategies for Water Usage and Wastag...Framework Towards Achieving Sustainable Strategies for Water Usage and Wastag...
Framework Towards Achieving Sustainable Strategies for Water Usage and Wastag...nitinrane33
 
STUDY OF EFFECTS OF LABOUR PRODUCTIVITY ON CONSTRUCTION PROJECTS
STUDY OF EFFECTS OF LABOUR PRODUCTIVITY ON CONSTRUCTION  PROJECTSSTUDY OF EFFECTS OF LABOUR PRODUCTIVITY ON CONSTRUCTION  PROJECTS
STUDY OF EFFECTS OF LABOUR PRODUCTIVITY ON CONSTRUCTION PROJECTSnitinrane33
 
Application of Value Engineering in Construction Projects
Application of Value Engineering in Construction ProjectsApplication of Value Engineering in Construction Projects
Application of Value Engineering in Construction Projectsnitinrane33
 
Application of Value Engineering in Commercial Building Projects
Application of Value Engineering in  Commercial Building ProjectsApplication of Value Engineering in  Commercial Building Projects
Application of Value Engineering in Commercial Building Projectsnitinrane33
 
Evaluating the Selection Criteria of Formwork System (FS) for RCC Building Co...
Evaluating the Selection Criteria of Formwork System (FS) for RCC Building Co...Evaluating the Selection Criteria of Formwork System (FS) for RCC Building Co...
Evaluating the Selection Criteria of Formwork System (FS) for RCC Building Co...nitinrane33
 

Mais de nitinrane33 (12)

Contribution and performance of ChatGPT and other Large Language Models (LLM...
Contribution and performance of ChatGPT and other Large Language  Models (LLM...Contribution and performance of ChatGPT and other Large Language  Models (LLM...
Contribution and performance of ChatGPT and other Large Language Models (LLM...
 
ChatGPT is not capable of serving as an author: ethical concerns and challe...
 ChatGPT is not capable of serving as an author: ethical concerns and  challe... ChatGPT is not capable of serving as an author: ethical concerns and  challe...
ChatGPT is not capable of serving as an author: ethical concerns and challe...
 
Enhancing customer loyalty through quality of service: Effective strategies t...
Enhancing customer loyalty through quality of service: Effective strategies t...Enhancing customer loyalty through quality of service: Effective strategies t...
Enhancing customer loyalty through quality of service: Effective strategies t...
 
Remote Sensing (RS), UAV/drones, and Machine Learning (ML) as powerful techni...
Remote Sensing (RS), UAV/drones, and Machine Learning (ML) as powerful techni...Remote Sensing (RS), UAV/drones, and Machine Learning (ML) as powerful techni...
Remote Sensing (RS), UAV/drones, and Machine Learning (ML) as powerful techni...
 
Fuzzy AHP and Fuzzy TOPSIS as an effective and powerful Multi-Criteria Decisi...
Fuzzy AHP and Fuzzy TOPSIS as an effective and powerful Multi-Criteria Decisi...Fuzzy AHP and Fuzzy TOPSIS as an effective and powerful Multi-Criteria Decisi...
Fuzzy AHP and Fuzzy TOPSIS as an effective and powerful Multi-Criteria Decisi...
 
Effectiveness and Capability of Remote Sensing (RS) and Geographic Informatio...
Effectiveness and Capability of Remote Sensing (RS) and Geographic Informatio...Effectiveness and Capability of Remote Sensing (RS) and Geographic Informatio...
Effectiveness and Capability of Remote Sensing (RS) and Geographic Informatio...
 
Multi-Criteria Decision-Making (MCDM) as a powerful tool for sustainable deve...
Multi-Criteria Decision-Making (MCDM) as a powerful tool for sustainable deve...Multi-Criteria Decision-Making (MCDM) as a powerful tool for sustainable deve...
Multi-Criteria Decision-Making (MCDM) as a powerful tool for sustainable deve...
 
Framework Towards Achieving Sustainable Strategies for Water Usage and Wastag...
Framework Towards Achieving Sustainable Strategies for Water Usage and Wastag...Framework Towards Achieving Sustainable Strategies for Water Usage and Wastag...
Framework Towards Achieving Sustainable Strategies for Water Usage and Wastag...
 
STUDY OF EFFECTS OF LABOUR PRODUCTIVITY ON CONSTRUCTION PROJECTS
STUDY OF EFFECTS OF LABOUR PRODUCTIVITY ON CONSTRUCTION  PROJECTSSTUDY OF EFFECTS OF LABOUR PRODUCTIVITY ON CONSTRUCTION  PROJECTS
STUDY OF EFFECTS OF LABOUR PRODUCTIVITY ON CONSTRUCTION PROJECTS
 
Application of Value Engineering in Construction Projects
Application of Value Engineering in Construction ProjectsApplication of Value Engineering in Construction Projects
Application of Value Engineering in Construction Projects
 
Application of Value Engineering in Commercial Building Projects
Application of Value Engineering in  Commercial Building ProjectsApplication of Value Engineering in  Commercial Building Projects
Application of Value Engineering in Commercial Building Projects
 
Evaluating the Selection Criteria of Formwork System (FS) for RCC Building Co...
Evaluating the Selection Criteria of Formwork System (FS) for RCC Building Co...Evaluating the Selection Criteria of Formwork System (FS) for RCC Building Co...
Evaluating the Selection Criteria of Formwork System (FS) for RCC Building Co...
 

Último

High Profile Call Girls Nagpur Meera Call 7001035870 Meet With Nagpur Escorts
High Profile Call Girls Nagpur Meera Call 7001035870 Meet With Nagpur EscortsHigh Profile Call Girls Nagpur Meera Call 7001035870 Meet With Nagpur Escorts
High Profile Call Girls Nagpur Meera Call 7001035870 Meet With Nagpur EscortsCall Girls in Nagpur High Profile
 
Model Call Girl in Narela Delhi reach out to us at 🔝8264348440🔝
Model Call Girl in Narela Delhi reach out to us at 🔝8264348440🔝Model Call Girl in Narela Delhi reach out to us at 🔝8264348440🔝
Model Call Girl in Narela Delhi reach out to us at 🔝8264348440🔝soniya singh
 
High Profile Call Girls Nagpur Isha Call 7001035870 Meet With Nagpur Escorts
High Profile Call Girls Nagpur Isha Call 7001035870 Meet With Nagpur EscortsHigh Profile Call Girls Nagpur Isha Call 7001035870 Meet With Nagpur Escorts
High Profile Call Girls Nagpur Isha Call 7001035870 Meet With Nagpur Escortsranjana rawat
 
(TARA) Talegaon Dabhade Call Girls Just Call 7001035870 [ Cash on Delivery ] ...
(TARA) Talegaon Dabhade Call Girls Just Call 7001035870 [ Cash on Delivery ] ...(TARA) Talegaon Dabhade Call Girls Just Call 7001035870 [ Cash on Delivery ] ...
(TARA) Talegaon Dabhade Call Girls Just Call 7001035870 [ Cash on Delivery ] ...ranjana rawat
 
SPICE PARK APR2024 ( 6,793 SPICE Models )
SPICE PARK APR2024 ( 6,793 SPICE Models )SPICE PARK APR2024 ( 6,793 SPICE Models )
SPICE PARK APR2024 ( 6,793 SPICE Models )Tsuyoshi Horigome
 
The Most Attractive Pune Call Girls Budhwar Peth 8250192130 Will You Miss Thi...
The Most Attractive Pune Call Girls Budhwar Peth 8250192130 Will You Miss Thi...The Most Attractive Pune Call Girls Budhwar Peth 8250192130 Will You Miss Thi...
The Most Attractive Pune Call Girls Budhwar Peth 8250192130 Will You Miss Thi...ranjana rawat
 
Call Girls Service Nashik Vaishnavi 7001305949 Independent Escort Service Nashik
Call Girls Service Nashik Vaishnavi 7001305949 Independent Escort Service NashikCall Girls Service Nashik Vaishnavi 7001305949 Independent Escort Service Nashik
Call Girls Service Nashik Vaishnavi 7001305949 Independent Escort Service NashikCall Girls in Nagpur High Profile
 
(PRIYA) Rajgurunagar Call Girls Just Call 7001035870 [ Cash on Delivery ] Pun...
(PRIYA) Rajgurunagar Call Girls Just Call 7001035870 [ Cash on Delivery ] Pun...(PRIYA) Rajgurunagar Call Girls Just Call 7001035870 [ Cash on Delivery ] Pun...
(PRIYA) Rajgurunagar Call Girls Just Call 7001035870 [ Cash on Delivery ] Pun...ranjana rawat
 
APPLICATIONS-AC/DC DRIVES-OPERATING CHARACTERISTICS
APPLICATIONS-AC/DC DRIVES-OPERATING CHARACTERISTICSAPPLICATIONS-AC/DC DRIVES-OPERATING CHARACTERISTICS
APPLICATIONS-AC/DC DRIVES-OPERATING CHARACTERISTICSKurinjimalarL3
 
OSVC_Meta-Data based Simulation Automation to overcome Verification Challenge...
OSVC_Meta-Data based Simulation Automation to overcome Verification Challenge...OSVC_Meta-Data based Simulation Automation to overcome Verification Challenge...
OSVC_Meta-Data based Simulation Automation to overcome Verification Challenge...Soham Mondal
 
Coefficient of Thermal Expansion and their Importance.pptx
Coefficient of Thermal Expansion and their Importance.pptxCoefficient of Thermal Expansion and their Importance.pptx
Coefficient of Thermal Expansion and their Importance.pptxAsutosh Ranjan
 
Introduction to IEEE STANDARDS and its different types.pptx
Introduction to IEEE STANDARDS and its different types.pptxIntroduction to IEEE STANDARDS and its different types.pptx
Introduction to IEEE STANDARDS and its different types.pptxupamatechverse
 
Introduction to Multiple Access Protocol.pptx
Introduction to Multiple Access Protocol.pptxIntroduction to Multiple Access Protocol.pptx
Introduction to Multiple Access Protocol.pptxupamatechverse
 
(MEERA) Dapodi Call Girls Just Call 7001035870 [ Cash on Delivery ] Pune Escorts
(MEERA) Dapodi Call Girls Just Call 7001035870 [ Cash on Delivery ] Pune Escorts(MEERA) Dapodi Call Girls Just Call 7001035870 [ Cash on Delivery ] Pune Escorts
(MEERA) Dapodi Call Girls Just Call 7001035870 [ Cash on Delivery ] Pune Escortsranjana rawat
 
UNIT-III FMM. DIMENSIONAL ANALYSIS
UNIT-III FMM.        DIMENSIONAL ANALYSISUNIT-III FMM.        DIMENSIONAL ANALYSIS
UNIT-III FMM. DIMENSIONAL ANALYSISrknatarajan
 
Decoding Kotlin - Your guide to solving the mysterious in Kotlin.pptx
Decoding Kotlin - Your guide to solving the mysterious in Kotlin.pptxDecoding Kotlin - Your guide to solving the mysterious in Kotlin.pptx
Decoding Kotlin - Your guide to solving the mysterious in Kotlin.pptxJoão Esperancinha
 
(ANJALI) Dange Chowk Call Girls Just Call 7001035870 [ Cash on Delivery ] Pun...
(ANJALI) Dange Chowk Call Girls Just Call 7001035870 [ Cash on Delivery ] Pun...(ANJALI) Dange Chowk Call Girls Just Call 7001035870 [ Cash on Delivery ] Pun...
(ANJALI) Dange Chowk Call Girls Just Call 7001035870 [ Cash on Delivery ] Pun...ranjana rawat
 
Sheet Pile Wall Design and Construction: A Practical Guide for Civil Engineer...
Sheet Pile Wall Design and Construction: A Practical Guide for Civil Engineer...Sheet Pile Wall Design and Construction: A Practical Guide for Civil Engineer...
Sheet Pile Wall Design and Construction: A Practical Guide for Civil Engineer...Dr.Costas Sachpazis
 

Último (20)

High Profile Call Girls Nagpur Meera Call 7001035870 Meet With Nagpur Escorts
High Profile Call Girls Nagpur Meera Call 7001035870 Meet With Nagpur EscortsHigh Profile Call Girls Nagpur Meera Call 7001035870 Meet With Nagpur Escorts
High Profile Call Girls Nagpur Meera Call 7001035870 Meet With Nagpur Escorts
 
Model Call Girl in Narela Delhi reach out to us at 🔝8264348440🔝
Model Call Girl in Narela Delhi reach out to us at 🔝8264348440🔝Model Call Girl in Narela Delhi reach out to us at 🔝8264348440🔝
Model Call Girl in Narela Delhi reach out to us at 🔝8264348440🔝
 
High Profile Call Girls Nagpur Isha Call 7001035870 Meet With Nagpur Escorts
High Profile Call Girls Nagpur Isha Call 7001035870 Meet With Nagpur EscortsHigh Profile Call Girls Nagpur Isha Call 7001035870 Meet With Nagpur Escorts
High Profile Call Girls Nagpur Isha Call 7001035870 Meet With Nagpur Escorts
 
9953056974 Call Girls In South Ex, Escorts (Delhi) NCR.pdf
9953056974 Call Girls In South Ex, Escorts (Delhi) NCR.pdf9953056974 Call Girls In South Ex, Escorts (Delhi) NCR.pdf
9953056974 Call Girls In South Ex, Escorts (Delhi) NCR.pdf
 
(TARA) Talegaon Dabhade Call Girls Just Call 7001035870 [ Cash on Delivery ] ...
(TARA) Talegaon Dabhade Call Girls Just Call 7001035870 [ Cash on Delivery ] ...(TARA) Talegaon Dabhade Call Girls Just Call 7001035870 [ Cash on Delivery ] ...
(TARA) Talegaon Dabhade Call Girls Just Call 7001035870 [ Cash on Delivery ] ...
 
SPICE PARK APR2024 ( 6,793 SPICE Models )
SPICE PARK APR2024 ( 6,793 SPICE Models )SPICE PARK APR2024 ( 6,793 SPICE Models )
SPICE PARK APR2024 ( 6,793 SPICE Models )
 
The Most Attractive Pune Call Girls Budhwar Peth 8250192130 Will You Miss Thi...
The Most Attractive Pune Call Girls Budhwar Peth 8250192130 Will You Miss Thi...The Most Attractive Pune Call Girls Budhwar Peth 8250192130 Will You Miss Thi...
The Most Attractive Pune Call Girls Budhwar Peth 8250192130 Will You Miss Thi...
 
Call Girls Service Nashik Vaishnavi 7001305949 Independent Escort Service Nashik
Call Girls Service Nashik Vaishnavi 7001305949 Independent Escort Service NashikCall Girls Service Nashik Vaishnavi 7001305949 Independent Escort Service Nashik
Call Girls Service Nashik Vaishnavi 7001305949 Independent Escort Service Nashik
 
(PRIYA) Rajgurunagar Call Girls Just Call 7001035870 [ Cash on Delivery ] Pun...
(PRIYA) Rajgurunagar Call Girls Just Call 7001035870 [ Cash on Delivery ] Pun...(PRIYA) Rajgurunagar Call Girls Just Call 7001035870 [ Cash on Delivery ] Pun...
(PRIYA) Rajgurunagar Call Girls Just Call 7001035870 [ Cash on Delivery ] Pun...
 
APPLICATIONS-AC/DC DRIVES-OPERATING CHARACTERISTICS
APPLICATIONS-AC/DC DRIVES-OPERATING CHARACTERISTICSAPPLICATIONS-AC/DC DRIVES-OPERATING CHARACTERISTICS
APPLICATIONS-AC/DC DRIVES-OPERATING CHARACTERISTICS
 
OSVC_Meta-Data based Simulation Automation to overcome Verification Challenge...
OSVC_Meta-Data based Simulation Automation to overcome Verification Challenge...OSVC_Meta-Data based Simulation Automation to overcome Verification Challenge...
OSVC_Meta-Data based Simulation Automation to overcome Verification Challenge...
 
Coefficient of Thermal Expansion and their Importance.pptx
Coefficient of Thermal Expansion and their Importance.pptxCoefficient of Thermal Expansion and their Importance.pptx
Coefficient of Thermal Expansion and their Importance.pptx
 
Introduction to IEEE STANDARDS and its different types.pptx
Introduction to IEEE STANDARDS and its different types.pptxIntroduction to IEEE STANDARDS and its different types.pptx
Introduction to IEEE STANDARDS and its different types.pptx
 
Roadmap to Membership of RICS - Pathways and Routes
Roadmap to Membership of RICS - Pathways and RoutesRoadmap to Membership of RICS - Pathways and Routes
Roadmap to Membership of RICS - Pathways and Routes
 
Introduction to Multiple Access Protocol.pptx
Introduction to Multiple Access Protocol.pptxIntroduction to Multiple Access Protocol.pptx
Introduction to Multiple Access Protocol.pptx
 
(MEERA) Dapodi Call Girls Just Call 7001035870 [ Cash on Delivery ] Pune Escorts
(MEERA) Dapodi Call Girls Just Call 7001035870 [ Cash on Delivery ] Pune Escorts(MEERA) Dapodi Call Girls Just Call 7001035870 [ Cash on Delivery ] Pune Escorts
(MEERA) Dapodi Call Girls Just Call 7001035870 [ Cash on Delivery ] Pune Escorts
 
UNIT-III FMM. DIMENSIONAL ANALYSIS
UNIT-III FMM.        DIMENSIONAL ANALYSISUNIT-III FMM.        DIMENSIONAL ANALYSIS
UNIT-III FMM. DIMENSIONAL ANALYSIS
 
Decoding Kotlin - Your guide to solving the mysterious in Kotlin.pptx
Decoding Kotlin - Your guide to solving the mysterious in Kotlin.pptxDecoding Kotlin - Your guide to solving the mysterious in Kotlin.pptx
Decoding Kotlin - Your guide to solving the mysterious in Kotlin.pptx
 
(ANJALI) Dange Chowk Call Girls Just Call 7001035870 [ Cash on Delivery ] Pun...
(ANJALI) Dange Chowk Call Girls Just Call 7001035870 [ Cash on Delivery ] Pun...(ANJALI) Dange Chowk Call Girls Just Call 7001035870 [ Cash on Delivery ] Pun...
(ANJALI) Dange Chowk Call Girls Just Call 7001035870 [ Cash on Delivery ] Pun...
 
Sheet Pile Wall Design and Construction: A Practical Guide for Civil Engineer...
Sheet Pile Wall Design and Construction: A Practical Guide for Civil Engineer...Sheet Pile Wall Design and Construction: A Practical Guide for Civil Engineer...
Sheet Pile Wall Design and Construction: A Practical Guide for Civil Engineer...
 

Comparison of multi‑infuence factor, weight of evidence and frequency ratio techniques to evaluate groundwater potential zones of basaltic aquifer systems

  • 1. Vol.:(0123456789) Environment, Development and Sustainability (2022) 24:2315–2344 https://doi.org/10.1007/s10668-021-01535-5 1 3 Comparison of multi‑influence factor, weight of evidence and frequency ratio techniques to evaluate groundwater potential zones of basaltic aquifer systems Nitin L. Rane1 · Geetha K. Jayaraj2 Received: 11 September 2020 / Accepted: 19 May 2021 / Published online: 25 May 2021 © The Author(s), under exclusive licence to Springer Nature B.V. 2021 Abstract Groundwater is the largest available reservoir of freshwater. But the rapid increase in the population and urbanisation, has led to over exploitation of groundwater which imposed tremendous pressure on global groundwater resources. Because of the hidden and dynamic nature of groundwater, it requires appropriate quantification for the formulation of ground- water planning and management strategies. The present study evaluates the efficacy of geospatial technology based Multi Influence Factor (MIF), Weight of Evidence (WofE) and Frequency Ratio (FR) technique to evaluate groundwater potential using a case study of basaltic terrain. The thematic layers influencing the groundwater occurrence viz. rain- fall, slope, geomorphology, soil type, land use, drainage density, lineament density, and elevation were prepared using satellite images, hydrologic, hydrogeologic and relevant field data. Based on the conceptual frameworks of MIF, WofE and FR techniques these thematic layers and their features were assigned with appropriate weight and then inte- grated in the ArcGIS platform for the generation of aggregated raster layer which portray the groundwater potential zones. The results of validation showed that the groundwater potential delineated using MIF technique has a prediction accuracy of 81.94%, followed by WofE technique (76.19%) and FR techniques (71.43%). It is concluded that for evaluation of groundwater potential, the MIF technique is most reliable, followed by the WofE tech- nique. The evaluated groundwater potential zones are useful as a scientific guide to identify the suitable location of wells and recharge structure in a cost-efficient way and also for the development of structured and pragmatic groundwater management strategies. Keywords Groundwater potential zones · Multi influence factor · Weight of evidence · Frequency ratio · Geospatial techniques · Basaltic aquifer * Nitin L. Rane nitinrane33@gmail.com Geetha K. Jayaraj jayaraj.geetha@gmail.com 1 Department of Civil Engineering, Pillai HOC College of Engineering and Technology, New Mumbai, India 2 Shivajirao S Jondhle College of Engg & Technology, Asangaon, Thane, India Content courtesy of Springer Nature, terms of use apply. Rights reserved.
  • 2. 2316 N. L. Rane, G. K. Jayaraj 1 3 1 Introduction Groundwater is an essential freshwater source for agriculture, human survival, industrial development, and ecosystem conservation, so it must be managed prudently. The mis- management of this treasured resource leads to the negative effect on the sustainability of groundwater, causing decreases in groundwater level and triggering environmental prob- lems such as groundwater quality deterioration, land subsidence, and seawater intrusion for the present as well as for future generation (Aksever et al., 2015; Bear et al., 1999; Katpatal et al., 2014; Parisi et al., 2018; Vasanthavigar et al., 2010; Voudouris, 2006; Wada et al., 2010; Yesilnacar et al., 2008). Many river basins in the world have experienced severe groundwater stresses (Ghasemi et al., 2017; Palmer et al., 2008; Tsanis & Aposto- laki, 2009). Agriculture in India is demographically the large economic sector and ranks second in the world in terms of agriculture production (Ghude et al., 2014; Shah, 2010). Groundwater is the major freshwater resource of livelihood because more than 60% irriga- tion in agriculture relying on groundwater and therefore has an important role in the overall socioeconomic structure of India (Ghude et al., 2014; CGWB 2017). In recent years, due to increase in the demand of groundwater, causing considerable groundwater depletion in India (Selvakumar et al., 2018). The groundwater demand in future may increase due to insufficient storage capacity of surface water resources and unpredictable monsoon. Fur- thermore, climatic change and socioeconomic factors are likely to increase water issues (Asoka et al., 2017; Gurdak, 2017; Shah, 2009). These water conditions have severe impli- cations for the agricultural sustainability, economic development, energy and food security, ecosystem conservation and industrial development of the country. Therefore, it is required to use modern tools and techniques to develop a comprehensive database of the quality and quantity of groundwater, to retrieve the declined trend of groundwater level. Integrated use of Remote Sensing (RS) and Geographic Information System (GIS) technology is becoming a useful and powerful tool for identifying and delineation of groundwater potential (Arulbalaji et al., 2019; Mahmoud, 2014; Singh et al., 2018; Zhu & Abdelkareem, 2021). The application of RS in hydrogeologic monitoring and investiga- tion provides useful information in spatio-temporal scales, which is significant to evaluate, predict, and validate the groundwater models effectively (Kaur et al., 2020; Kim et al 2019; Singh et al., 2014;). The capabilities of satellite images to cover large spatial scales is cru- cial for mapping the hydrogeographic characteristics of the basin, such as geomorphology, drainage density, slope, land use, lineament, and elevation (Devi et al., 2001; Roy et al., 2019). Such characteristics are the main requirement for assessment and exploration of groundwater resources (Raju et al., 2019). On the other hand, GIS provides a distinct work- ing environment that can effectively process and store georeferenced data gathered from various sources, such as land surveys, maps, and satellite images etc. (Adimalla & Taloor, 2020; Yeh et al., 2009, 2016). Groundwater exploration using traditional methods, namely field-based surveys, stra- tigraphy analysis and test drilling are very expensive, time-consuming and laborious (Chowdhury et al., 2009; Das et al., 2019; Lee et al., 2012; Shahinuzzaman et al., 2021). Moreover, the groundwater resources planning and development need long term data- base that is generally not available in numerous regions, especially in developing coun- tries. The use of RS and GIS overcomes this restriction to some extent and becomes an efficient tool to monitor, assess and manage the groundwater resources (Achu et al., 2020; Fashae et al., 2014; Gnanachandrasamy et al., 2018; Jha et al., 2007; Machiwal et al., 2011; Mahmoud, 2014; Tolche, 2021; Waikar & Nilawar, 2014). The groundwater Content courtesy of Springer Nature, terms of use apply. Rights reserved.
  • 3. 2317 Comparison of multi‑influence factor, weight of evidence and… 1 3 occurrence is controlled by various factors such as drainage density, lineament density, slope, soil type, elevation, lithology, geomorphology, land use and interrelation among these factors (Jenifer & Jha, 2017; Magesh et al., 2012; Murthy, 2000; Razandi et al., 2015; Sahoo et al., 2017; Thapa et al., 2018). The application of RS and GIS to delin- eate the groundwater potential comprises the integration of hydrological as well as geological factors, which influence the groundwater occurrence (Gupta & Srivastava, 2010; Pande et al., 2019; Shahid et al., 2000). Several researchers across the world have used RS and GIS techniques with or without Multi Influence Factor (MIF) technique to delineate groundwater potential zones in various hydrogeological settings (e.g., Fashae et al., 2014; Ganapuram et al., 2009; Gupta & Srivastava, 2010; Gumma & Pavelic., 2013;Ghorbani Nejad et al., 2017; Kumar et al., 2007; Machiwal et al., 2011; Magesh et al., 2012; Pinto et al., 2017; Pande et al., 2019; Srinivasa and Jugran 2003;). In addition to conventional Geospatial technology-based MIF technique in the last few years, the Geospatial technology-based Weight of Evidence (WofE) and Fre- quency Ratio (FR) technique have been used for evaluating the groundwater potential. The WofE technique has been employed to water quality evaluation (Lee & Jones-Lee, 2004; Sanderson et al., 2006), assessment of landslide vulnerability (Hong et al., 2017; Kayastha et al., 2012; Mohammady et al., 2019; Xu et al., 2012), delineation of soil erosion susceptible zones (Gayen & Saha, 2017; Hembram et al., 2019) prediction of flood prone zones (Hong et al., 2018; Tehrany et al., 2014) and groundwater potential zones mapping (Corsini et al., 2009; Tahmassebipoor et al., 2016). Moreover, another Geospatial technology-based Frequency Ratio (FR) technique has attracted the research- er’s attention from different disciplines such as landslide hazard mapping (Akgun et al., 2008; Lee & Pradhan, 2007), prediction of flash flood hazard susceptibility (Cao et al., 2016). Also, it has been used to evaluate the groundwater potential (Das & Pardeshi, 2018; Razandi et al., 2015; Sahoo et al., 2015). The results show that both the WofE and FR techniques having the good ability to reliably delineate groundwater potential. The literature shows that most of the evaluations based on RS and GIS techniques to delineate the groundwater potential have assessed single MIF or WofE or FR technique. Thus, identification of appropriate technique is required to provide a higher prediction accuracy for evaluating the groundwater potential. The primary objective of the study is to comparatively evaluate the applicability of MIF, WofE and FR technique to iden- tify and delineate the groundwater potential zones in the study area. The findings and described framework in this study helpful to identify the efficacy and usefulness of MIF, WofE and FR technique which gives higher prediction precision to assess the ground- water potential. 1.1 Study Area The Kadva river, a tributary of Godavari River is bounded by latitude 20°1′6.27N to 20°26′44.78N and longitude 73°36′43.10E to 74°11′34.02E and encompasses an area of 1705.24 ­ km2 in Nashik district, India, as shown in Fig. 1. The average annual pre- cipitation in study area is about 700 mm, in which 80% predominates from the monsoon winds from the South-West. The climate in the study area is semi-arid with temperature ranging from 5 to 42 °C in winter and summer season (CGWB 2014). A major part of basin is covered by agriculture land. The area is primarily irrigated with rivers, canal water and groundwater (Wagh et al., 2017). Content courtesy of Springer Nature, terms of use apply. Rights reserved.
  • 4. 2318 N. L. Rane, G. K. Jayaraj 1 3 1.2 Hydrogeology Geologically the study area is covered by basaltic lava flows from Upper Cretaceous to Eocene age and contains aa and pahoehoe lava flows of basaltic structure (GSI, 2001). Weathered and fractured units underlain by massive basalt units serve as the main aquifer system in study area. The aquifer has lack of primary porosity but possesses secondary Fig. 1  Location of the study area with rain gauge station and elevation Content courtesy of Springer Nature, terms of use apply. Rights reserved.
  • 5. 2319 Comparison of multi‑influence factor, weight of evidence and… 1 3 porosity due to fractured and weathered basalt. The upper weathered and fractured units comprise the unconfined aquifers, and the occurrence of groundwater is in unconfined con- dition. The groundwater occurrence at a deep level is under the semi-confined to confined condition (CGWB 2014). The unconfined aquifer is mainly limited to fractured basalt, and moderately weathered basalt and the main groundwater source to the large diameter wells. The basaltic aquifer possesses high heterogeneity in nature and varies over the small dis- tance because of difference in structural features, texture and lithology. The semi-confined to confined aquifer is primarily composed of fractured jointed amygdular and vesicular basalt of considerable thickness and it has developed into semi-confined to confined con- dition. Groundwater exists in the pore spaces of interconnected vesicular units and in the jointed and fractured units of a massive basalt of individual flow (Rane Jayaraj, 2021). Groundwater levels in the study area vary from 0.85 to 13.36 m below ground level (bgl) in the weathered residuum which is tapping by the hand dug wells, whereas deep fractured basalt is tapping by the borewells. 1.3 Water issues From this current study, it is observed that 986.07 ­ km2 area falls under the agricultural land which is coming as 57.83% of the whole area taken up for the study and it is apparent that agricultural practices are supported by groundwater and surface water. In many cases, the supply of surface water is associated with precipitation leading to excessive availability of water in monsoon period and shortage in the subsequent dry period. Moreover, the ground- water level in the dry period ranges 2.40–13.36 m (bgl), and post-monsoon groundwater level ranges 0.85–10.36 m (bgl). The seasonal fluctuations in groundwater level indicate substantial aquifer recharge during the monsoon season. In dry season, canal network is unable to supply sufficient water for intensive crops; therefore, water scarcity issues are severe in dry season, because groundwater is only feasible water resource in such a sit- uation. This situation results in the increase in the number of wells that exacerbate the groundwater depletion in the study area. In addition, groundwater availability is limited in the study area due to the basaltic aquifer, that has low storage capacities. According to CGWB (2014), the groundwater development stage for two talukas located in the study area, namely Niphad and Chandwad, are classified as semi-critical areas in which the stage of groundwater development is 84% and 89%, respectively. This indicates the study area is using 84% and 89% of the groundwater resources in the Niphad and Chandwad talukas respectively. In addition, the demand for groundwater increased in recent years because of the change in population and expansion of agriculture in the study area (Wagh et al., 2017). These situations illustrate the need of sustainable groundwater management in the study area. 2 Material and methodology 2.1 Geospatial database preparation Groundwater potential is controlled by various surface parameters, such as geomorphol- ogy, anthropogenic activities, lineament, slope, soil type, land use, drainage density, eleva- tion, rainfall, etc. and subsurface properties such as infiltration capacity, geology, storage coefficient of aquifer, hydraulic conductivity of aquifer, etc. According to the availability Content courtesy of Springer Nature, terms of use apply. Rights reserved.
  • 6. 2320 N. L. Rane, G. K. Jayaraj 1 3 of field observed and geospatial data and also by consideration of effects of the factors, the factors which influence the groundwater potential were chosen to evaluate the groundwater potential through geospatial technology-based MIF, WofE and FR techniques. In the pre- sent study, eight hydrologic and hydrogeologic factors were selected to evaluate groundwa- ter potential, and for each factor, the thematic layer was prepared. The daily rainfall data of six rain gauge station were collected from Department of Water Resources, Maharashtra and used to prepare the map of rainfall. The annual precipitation data of 18 years were averaged and assigned to each rain gauge station for the preparation of rainfall map. The 30 m Shuttle Radar Topography Mission (SRTM) DEM data were used for the generation of slope, drainage density and elevation maps through the ArcGIS spatial analyst tool. The toposheets acquired from Survey of India were used to digitize the lakes and rivers in the study area as well as verified using Landsat-8 imagery. The soil type map was acquired from FAO global soil data map (http://​www.​fao.​org). The land use map was prepared in ERDAS Imagine 2015 software using supervised classification. In addition to above geo- spatial data, discharge data were collected from the 72 pumping wells. Figure 4 shows the location of the pumping wells in study area. 2.2 Delineation of groundwater potential zones In order to identify and delineate the groundwater potential zones, thematic layers of soil type, drainage density, rainfall, elevation, lineament, geomorphology, land use, and slope were used which influence the groundwater occurrence. In the present study, three tech- niques, namely Multi Influence Factor (MIF) technique, Weight of Evidence (WofE) and Frequency Ratio (FR) technique were used and comparatively evaluated to identify and delineate the groundwater potential zones with high prediction accuracy in the study area. The prediction accuracy is found out by using the number of wells agreed for the actual groundwater yield data divided by the total number of wells. These three techniques briefly described in the following sections. 2.2.1 MIF technique Evaluating the influence of factors separately on groundwater potential cannot portray the real scenarios. Thus, it is required to use the MIF technique where all input factors are integrated by taking into consideration of all possible interactions between each fac- tor. As each factor has a different degree of influence on groundwater occurrence, a weighted approach is used so that all factors will be incorporated interactively. Flowchart of groundwater potential delineation using MIF technique is depicted in Fig. 2. In order to estimate weights of different factors, the influence between all factors should be deter- mined, and that was carried out according to the schematic interrelation depicted in Fig. 3. The interrelation is carried out on the basis of prior understanding of the influence factors for groundwater occurrence from the past research and literature review (Das Pardeshi, 2018; Fashae et al., 2014; Ganapuram et al., 2009; Gumma Pavelic, 2013; Jenifer Jha, 2017; Krishnamurthy et al., 1996; Kumar et al., 2007; Mahmoud, 2014; Pande et al., 2019; Razandi et al., 2015; Sahoo et al., 2015; Thapa et al., 2018). The factors with a major influ- ence are assigned a weight of 1.0, while, a minor influence is assigned with a weight of 0.5 and the factor with no effect on groundwater occurrence is assigned a weight of zero. Then the total relative effect of each factor is calculated by adding values of both major and minor effect as shown in Table 1. Content courtesy of Springer Nature, terms of use apply. Rights reserved.
  • 7. 2321 Comparison of multi‑influence factor, weight of evidence and… 1 3 The weights for influencing factors are computed as: where Ej is major interrelation between two factors and Ei is minor interrelation between two factors. (1) � � Ej + Ei � ∑ � Ej + Ei � � X100 Fig. 2  Flowchart of groundwater potential delineation using MIF technique Fig. 3  Interrelation among the multiple influence factors of groundwater potential in the study area Content courtesy of Springer Nature, terms of use apply. Rights reserved.
  • 8. 2322 N. L. Rane, G. K. Jayaraj 1 3 The calculated relative weights are considered as the weights of corresponding fea- tures. After computation of weights, rating classification for each feature was performed by dividing the weight (Wi) by the number of features in each factor, as well as based on heuristic approach of information on the conditions influencing the groundwater potential. Table 1  Influence factors, their relative effect and corresponding weight Factor Major effect (Ej) Minor effect (Ei) Relative effect (Ej + Ei) Weight of influence factor (Wi) Land use 1+1 0.5+0.5 3 16 Rainfall 1 0.5+0.5 2 11 Elevation 1 0.5+0.5 2 11 Lineament density 1+1 0 2 11 Soil type 1 0.5 1.5 8 Geomorphology 1+1+1 0.5 3.5 19 Drainage Density 1+1 0.5 2.5 13 Slope 1 0.5+0.5 2 11 ∑ 18.5 ∑ 100 Fig. 4  Location map of training and validation wells in the study area Content courtesy of Springer Nature, terms of use apply. Rights reserved.
  • 9. 2323 Comparison of multi‑influence factor, weight of evidence and… 1 3 The influencing factors assigned with weights and ranks were aggregated through follow- ing formula. where,—LUland use, RF—average annual rainfall, EL—elevation, LI—lineament, SO —soil, G—geomorphology, DD—drainage density, SL—slope. In Eq. 2, w—layer weight computed using MIF technique and, r refer to feature rank respectively. 2.3 WofE technique The WofE is a quantitative data-driven technique concerning to Bayesian approach for integrating data and used for the prediction of occurrence of events (Armas, 2012). This technique calculates the weights for the presence or absence of groundwater influence fea- tures based on the well existence in study area. The negative weight and positives weight are the weights of evidence when a feature is absent and present, respectively. WofE tech- nique requires data on pumping well’s location, as well as the thematic layers that influence the groundwater potential. The location map of wells over the study area was prepared rep- resenting 72 pumping wells, of which 51 pumping wells were utilized as training wells and 21 as validation wells as shown in Fig. 4. The verification wells were dedicatedly utilized to verify results. The thematic layers which influence the groundwater occurrence were overlaid on the training wells map. Based on this overlap, weights and WofE values of probability were computed for each feature and employed for the demarcation of ground- water potential zones. The weights for each class of a layer were computed as: where A—number of wells in feature, B—number of wells in study area, C—number of pixels in feature, and D—number of pixels in study area. WofE probability ­ (W+ P) for each feature were computed as: where B—number of wells in study area, and D refers to number of pixels in study area. 2.3.1 FR technique FR technique is a representative statistical approach used as a spatial mapping technique for evaluating the association among observed and independent variables, together with multiple features mapping (Oh et al., 2011). FR technique is based on the observed rela- tionships, the correlation among each groundwater influencing factor and the location of wells. FR technique requires the wells’ location and the thematic layers that influence the groundwater occurrence. The location map of 72 pumping wells located in the study (2) Groundwater potential index = (LUW × LUr) + (RFW × RFr) +(ELW × ELr) + (LIW × LIr) +(SOW × SOr) + (GW × Gr) +(DDW × DDr) + (SLW × SLr) (3) W+ = 1n [ A∕B C − A∕D − B ] (4) W+ P = exp [∑ W+ 1n B D ] Content courtesy of Springer Nature, terms of use apply. Rights reserved.
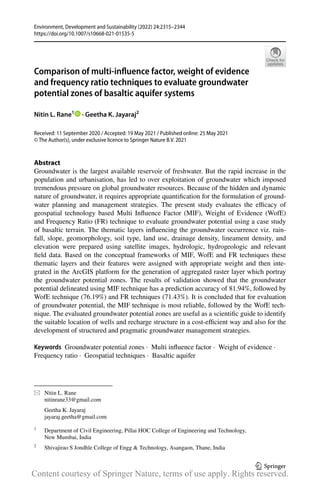
  • 10. 2324 N. L. Rane, G. K. Jayaraj 1 3 area was prepared in which 51 were utilized as training wells and 21 wells to verify results, as shown in Fig. 4. The thematic layers which influence groundwater occurrence were superimposed over the training wells map, and FR value in each feature was com- puted using the Eq. 5: where P—number of wells present in each feature of the influencing factor; Q—num- ber of total wells in study area; R—number of pixels present in each feature of the influ- encing factor and, S—number of total pixels in study area. (Fig. 5). After calculating FR, the groundwater potential map was created by summing up FR values of each influencing factor and their features using the Eq. 6. where FR—final weight for the FR technique and n refer to the number of total factors. (5) FR = P∕Q R∕S (6) Ground water potential index = n ∑ i=1 FR Fig. 5  Land use in the study area Content courtesy of Springer Nature, terms of use apply. Rights reserved.
  • 11. 2325 Comparison of multi‑influence factor, weight of evidence and… 1 3 3 Results and discussion 3.1 Characterization of spatial variation of the hydrologic and hydrogeologic conditions The characterization of thematic layers was performed by classifying their features into appro- priate groups that helpful for interpretation of their influence in the occurrence of groundwa- ter. The features of eight influencing factors are described below, and the area occupied by each feature is shown in Table 2. The study area experiences an average annual rainfall rang- ing from 600 to 786 mm. The study area was clustered into five zones based on average annual rainfall. Figure 6 revealed that the East-South portion of the basin receive lowest amount of rainfall and western part experiences the highest rainfall. It is apparent from the slope map that there is a steep slope (15.62°) present in the Northern mountains of the basin. As far as concerned the ground water occurrence, this portion is considered as having poor groundwa- ter potential because the water flows downward quickly and there is no time for infiltration. From Fig. 11 it is discernible that, the East-South portion of the basin has almost flat topog- raphy having 0–2.64% slope that indicates a favourable condition for groundwater potential. The remaining part has an undulating topography which contributes to a slope of 2.6415.62°. The thematic layer of drainage density in Fig. 10 indicates that about 66% of the area falls in the drainage density of 0–0.77 km/km2 and considered as moderate and good for groundwater potential. High drainage density results in the high runoff, indicating reduced infiltration and therefore poor groundwater occurrence. Lineament is associated with the secondary permeability in the basin. In order to determine the lineament concentration in the study area the lineament density analysis was performed. From Fig. 7 it is apparent that the lineament density varies from 0–0.09 km/km2 in the study area whereas the density varies from 0.09–1.40 km/km2 , found in patches in north-western portion. The higher lineament density is associated with the good groundwater occurrence. The land use in study area is agricultural land (57.83%), vegetation (4.81%), water bodies (3.70%), barren land (26.79%), and settlements (6.87%) (Fig. 5). Areas with a large num- ber of concrete constructions and built-up areas are poor for groundwater occurrence due to higher surface runoff, whereas agricultural land is good for groundwater occurrence because of the availability of loose soil on the land. The clayey soil dominating in the study area, is shown in Fig. 8 and is mostly seen on the land having gentle slope. Loam soil is present in the higher elevations and inter hill basins. The loam soil is considered good for the groundwater occurrence. The topographic elevation in the study area is shown in Fig. 1. The study area has elevation less than 615 m above mean sea level (AMSL) in the East-South parts, whereas the elevation more than 733 m AMSL in the Northern portion as shown in Fig. 1. The high-altitudes results in the poor groundwater potential since water flows towards the low altitude. The thematic layer of geomorphology is shown in Fig. 9. The study area predominantly occupied by plateau encompassing 90% of study area. The alluvium is observed along the middle course of river covering about 1.5% of the area and structural and denudational hills occupying about 8.5% of study area. (Figs. 10, 11). Content courtesy of Springer Nature, terms of use apply. Rights reserved.
  • 12. 2326 N. L. Rane, G. K. Jayaraj 1 3 Table 2  Statistics of factors with their classes and area Sr. No Thematic layer Feature of thematic layer Area ­(km2 ) Area (%) 1 Land use Agricultural land 986.07 57.83 Vegetation 82.00 4.81 Water bodies 63.15 3.70 Barren land 456.86 26.79 Settlements 117.10 6.87 2 Rainfall (mm) 600–637 103.45 6.07 637–674 205.36 12.04 674–712 546.90 32.07 712–749 428.50 25.13 749–786 420.98 24.69 3 Elevation (m) 529–615 467.68 27.43 615–674 511.11 29.97 674–733 583.63 34.23 733–886 125.26 7.35 886–1,384 16.91 0.99 4 Lineament density (km/km2 ) 0–0.09 1308.89 76.76 0.09–0.28 225.80 13.24 0.28–0.49 135.49 7.95 0.49–0.74 33.16 1.94 0.74–1.40 1.85 0.11 5 Soil Loam (Hydrologic soil group C) 144.80 8.49 Clay Loam (Hydrologic soil group D) 169.79 9.96 Clay Loam (Hydrologic soil group C) 449.09 26.34 Clay (Hydrologic soil group D: Clay 51% wt.) 930.21 54.55 Clay (Hydrologic soil group D: Clay 52% wt.) 12.30 0.72 6 Geomorphology Plateau 1544.63 90.58 Alluvium 20.73 1.22 Structural Hills 17.47 1.02 Denudational Hills 122.41 7.18 7 Drainage density(km/km2 ) 0–0.46 378.01 22.17 0.46–0.77 746.80 43.80 0.77–1.06 504.10 29.56 1.06–1.38 72.34 4.24 1.38–2.50 3.93 0.23 8 Slope 0–2.64o 1014.73 59.51 2.64–6.88o 566.68 33.23 6.88–15.62o 89.55 5.25 15.62–29.66o 24.16 1.42 29.66–67.54o 9.52 0.56 Content courtesy of Springer Nature, terms of use apply. Rights reserved.
  • 13. 2327 Comparison of multi‑influence factor, weight of evidence and… 1 3 4  Groundwater potential zone maps of the study area 4.1 MIF technique According to the interrelationship among factors influencing the groundwater potential, each thematic layer and their features were assigned with weights. The highest value of weight shows the highest possibility of factor or feature on groundwater occurrence, whereas the factor or feature having the lowest influence on groundwater occurrence is assigned a minimum weight. The derivation of weights for the individual thematic layer based on the interrelationship between factors is shown in Table 1. Table 3 shows the assigned weights of each thematic layer and corresponding normalized weights of the features. The relative weights of eight hydrologic and hydrogeologic influencing factors and their features were integrated, and groundwater potential was calculated in ArcGIS platform. On the basis of groundwater potential, the study area was clustered into four zones, namely ‘poor’, ‘moderate’, ‘good’, and ‘very good’ zones as shown in Fig. 12. The 9.27% of study area is falling under ‘poor’ groundwater potential because of steep slopes and dissected mountains present in these areas, while about 47.72% area is fall- ing under ‘moderate’ potential. The ‘good’ groundwater potential area is found about 30.17% of the study area. Further, about 12.84% of study area is falling under ‘very good’ groundwater potential. Fig. 6  Rainfall in study area Content courtesy of Springer Nature, terms of use apply. Rights reserved.
  • 14. 2328 N. L. Rane, G. K. Jayaraj 1 3 4.1.1 WofE technique Table 4 presents the number of pixels and wells in each feature of the influencing factor. The computation of WofE ­ (W+ ) and WofE probability ­ (W+ P) for each feature of thematic layer is computed using Eq. (3 and 4). The value obtained for ­ W+ and ­ W+ P for all the- matic layers is tabulated and presented in Table 5. Finally, eight hydrologic and hydrogeo- logic influencing factor were integrated in ArcGIS platform to delineate the groundwater potential. Based on the groundwater potential, the study area was clustered into four zones, namely ‘poor’, ‘moderate’, ‘good’, and ‘very good’ as shown in Fig. 13. According to the groundwater potential delineated using WofE technique, 8.12% and 48.39% of area falls under ‘poor’ and ‘moderate’ groundwater potential respectively. The 28.77% of study area falling under ‘good’ groundwater potential while about 14.72% area falling under ‘very good’ potential respectively. 4.1.2 FR technique Referring Table 4, the number of pixels and wells in each feature of the influencing factor are employed to compute FR value of each feature. The FR for each feature is computed using Eq. 5 and presented in Table 5. Finally, eight hydrologic and hydrogeologic factors Fig. 7  Lineament density in study area Content courtesy of Springer Nature, terms of use apply. Rights reserved.
  • 15. 2329 Comparison of multi‑influence factor, weight of evidence and… 1 3 which influence the groundwater occurrence were aggregated in ArcGIS platform to delin- eate groundwater potential. The identified groundwater potential further clustered into four zones (Fig. 14). The ‘poor’ and ‘moderate’ groundwater potential are covering 7.83%, and 49.05% respectively of study area. Nearly 29.08% and 14.04% of study area are coming under ‘good’ and ‘very good’ potential respectively. 4.2 Validation and efficacy of MIF, WofE and FR techniques The verification of MIF technique through the yield data of 72 pumping wells shows that 3 ‘very high discharge’ (6 lps) wells out of 4 wells falls under ‘very good’ groundwater potential and 32 ‘high discharge’ (4–6 lps) wells out of 34 wells falls under ‘good’ ground- water potential. Moreover, 24 out of 33 ‘medium discharge’ (2–4 lps) wells falling under ‘moderate’ potential and no well out of 1 ‘low discharge’ (2 lps) well falling under ‘poor’ potential. The number of wells that agreed with the actual yield are 59, and the number of pumping wells that disagreed with the actual yield are 13. Thus, the accuracy of prediction using MIF technique is 81.94%. The verification of WofE and FR technique was carried out through the yield data of 21 verification wells. The verification of WofE technique reveals that 1 out of 1 ‘very high discharge’ well falls under ‘very good’ potential zone and 7 out of 8 ‘high discharge’ wells under ‘good’ potential zone. While 8 out of 11 ‘medium discharge’ wells falling under Fig. 8  Soil type in the study area Content courtesy of Springer Nature, terms of use apply. Rights reserved.
  • 16. 2330 N. L. Rane, G. K. Jayaraj 1 3 ‘moderate’ potential, and no well out of 1 ‘low discharge’ well falls under ‘poor’ potential zone. The number of wells that agreed with actual yield are 16 and the number of wells that disagreed with actual yield are 5. Thus, the accuracy of prediction using WofE model is 76.19%. The verification of FR technique reveals that 1 out of 1 ‘very high discharge’ wells falls under ‘very good’ groundwater potential and 8 out of 8 ‘high discharge’ wells falls under ‘good’ potential. While, 6 out of 11 ‘medium discharge’ wells fall under ‘moderate’ poten- tial, and no well out of 1 ‘low discharge’ well fall under ‘poor’ potential. The number of wells that agreed with the actual yield are 15 and number of wells that disagreed with the actual yield are 6. Thus, the accuracy of prediction using FR model is 71.43%. The groundwater potential identified and delineated using MIF technique indicated that ‘poor’ groundwater potential covering 9.27% of the study area due to steep slopes and dis- sected mountains are present in these areas, ‘moderate’ potential 47.72%, ‘good’ poten- tial 30.17%, and ‘very good’ potential encompassing 12.84% of the study area. While the groundwater potential delineated using WofE technique revealed that 8.12% of area has ‘poor’ potential, 48.39% ‘moderate’ potential, 28.77% ‘good’ potential and 14.72% ‘very good’ potential. Moreover, the groundwater potential delineated using FR technique indi- cated that 7.83% of the area falling under ‘poor’ potential, 49.05% of the area falls in the ‘moderate’ zone, 29.08% of the area falling under ‘good’ potential and 14.04% ‘very good’ potential. The main difference in the geospatial prediction is identified in poor zone of the study area because there were no pumping wells in this zone. It is worth to note, that the absence and presence of pumping wells influence the prediction of groundwater potential in WofE technique, while the MIF technique only depends on the hydrologic and hydro- geologic factors. Thus, the reliability of MIF technique is higher than the WofE and FR Fig. 9  Geomorphology map of study area Content courtesy of Springer Nature, terms of use apply. Rights reserved.
  • 17. 2331 Comparison of multi‑influence factor, weight of evidence and… 1 3 technique. Among the WofE and FR technique, the WofE technique outperformed than FR technique. Therefore, it is recommended to use MIF technique to identify and delineate groundwater potential zones. The WofE technique can be used as an alternate technique in study area. Considering the requirement of pumping well data over the basin, the applica- tion of WofE technique is limited, particularly in the regions where the data is scarce. 5 Conclusions The primary objective of the present study was to evaluate the efficacy of geospatial tech- nology-based MIF, WofE and FR techniques to predict groundwater potential of the basal- tic aquifer system. The study considered the eight hydrological and hydrogeological factors which influence the occurrence of groundwater. According to framework of these three geospatial based techniques, thematic layers and their feature were assigned with suitable weights and then these thematic layers were integrated into the ArcGIS platform. The pre- dicted groundwater potential using the MIF technique showed ‘poor’ groundwater poten- tial encompassing about 9.27% of study area, ‘moderate’ potential zone 47.72%, ‘good’ potential zone 30.17%, and ‘very good’ potential zone covering 12.84% of study area. In comparison, predicted groundwater prospect using WofE method revealed that 8.12% of area falling under ‘poor’ groundwater potential, 48.39% ‘moderate’ potential zone, 28.77% Fig.10   Drainage density in study area Content courtesy of Springer Nature, terms of use apply. Rights reserved.
  • 18. 2332 N. L. Rane, G. K. Jayaraj 1 3 ‘good’ potential zone and 14.72% ‘very good’ potential zone. Moreover, the predicted groundwater potential using FR technique indicated that 7.83% of the area falling under ‘poor’ potential, 49.05% of area falling under ‘moderate’ potential, 29.08% of area fall- ing under ‘good’ potential and 14.04% ‘very good’ potential. The validation showed that the MIF technique has 81.94% prediction accuracy, followed by WofE technique (76.19%) and FR technique (71.43%). Therefore, the MIF technique surpasses the WofE and FR techniques. It is concluded that the MIF technique is a most effective technique to evaluate the groundwater potential zones on a large scale compared to WofE and FR techniques, although the WofE technique performance somewhat comparable to the MIF technique. Therefore, in order to obtain more reliable results, it is recommended to use MIF technique to identify and demarcate the groundwater potential zones. If the sufficient data is available to use WofE and FR technique, the use of WofE technique recommended over the FR tech- nique. The delineated groundwater potential zones are useful for understanding the hidden groundwater resource in study area and for identification of the suitable location of wells and recharge structure in a cost-efficient way. Furthermore, it can be used to the hydrolo- gists and planner to develop effective and pragmatic management strategies for addressing uncertainties and risks associated with groundwater management. The results together with the demonstrated framework can be reproduced in other basins for assessing the groundwa- ter potential zones, regardless of hydrogeological conditions. Fig. 11  Slope map of study area Content courtesy of Springer Nature, terms of use apply. Rights reserved.
  • 19. 2333 Comparison of multi‑influence factor, weight of evidence and… 1 3 Table 3  Assigned weights of the eight influencing factors with normalized weight of each feature Sr. No Thematic layer Weight Feature of thematic layer Ranking Normalized weight Total weight 1 Land use 16 Agricultural land 12 0.26 0.0326 Vegetation 8 0.17 0.0217 Water bodies 16 0.35 0.0435 Barren land 6 0.13 0.0163 Settlements 4 0.09 0.0109 2 Rainfall (mm) 11 600–637 3 0.09 0.0107 637–674 5 0.14 0.0179 674–712 7 0.20 0.0250 712–749 9 0.26 0.0321 749–786 11 0.31 0.0393 3 Elevation (m) 11 529–615 11 0.31 0.0393 615–674 9 0.26 0.0321 674- 733 7 0.20 0.0250 733–886 5 0.14 0.0179 886–1,384 3 0.09 0.0107 4 Lineament density (km/km 2 ) 11 0–0.09 3 0.09 0.0107 0.09–0.28 5 0.14 0.0179 0.28–0.49 7 0.20 0.0250 0.49–0.74 9 0.26 0.0321 0.74–1.40 11 0.31 0.0393 Content courtesy of Springer Nature, terms of use apply. Rights reserved.
  • 20. 2334 N. L. Rane, G. K. Jayaraj 1 3 Table 3  (continued) Sr. No Thematic layer Weight Feature of thematic layer Ranking Normalized weight Total weight 5 Soil type 8 Loam (Hydrologic soil group C) 8 0.31 0.0385 Clay Loam (Hydrologic soil group D) 5 0.19 0.0240 Clay Loam (Hydrologic soil group C) 6 0.23 0.0288 Clay (Hydrologic soil group D: Clay 51% wt.) 4 0.15 0.0192 Clay (Hydrologic soil group D: Clay 52% wt.) 3 0.12 0.0144 6 Geomorphology 19 Plateau 9 0.23 0.0281 Alluvium 19 0.48 0.0594 Structural Hills 5 0.13 0.0156 Denudational Hills 7 0.18 0.0219 7 Drainage Density (km/km 2 ) 13 0–0.46 5 0.11 0.0139 0.46–0.77 7 0.16 0.0194 0.77–1.06 9 0.20 0.0250 1.06–1.38 11 0.24 0.0306 1.38–2.50 13 0.29 0.0361 8 Slope 11 0–2.64 o 11 0.31 0.0393 2.64–6.88 o 9 0.26 0.0321 6.88–15.62 o 7 0.20 0.0250 15.62–29.66 o 5 0.14 0.0179 29.66–67.54 o 3 0.09 0.0107 Content courtesy of Springer Nature, terms of use apply. Rights reserved.
  • 21. 2335 Comparison of multi‑influence factor, weight of evidence and… 1 3 Fig.12   Groundwater potential zones delineated using MIF Technique Content courtesy of Springer Nature, terms of use apply. Rights reserved.
  • 22. 2336 N. L. Rane, G. K. Jayaraj 1 3 Table 4  Number of wells and pixels in each feature of the influencing factor Sr. No Thematic layer Feature of thematic layer Number of pixels in domain Number of wells 1 Land use Agriculture 1,095,636 42 Vegetation 91,111 0 Water bodies 70,166 0 Barren land 507,625 0 Settlements 130,107 9 2 Rainfall (mm) 600–637 114,942 7 637–674 228,174 7 674–712 607,670 13 712–749 476,107 11 749–786 467,751 13 3 Elevation (m) 529–615 519,649 23 615–674 567,897 9 674–733 648,479 16 733–886 139,173 3 886–1,384 18,792 0 4 Lineament density (km/km2 ) 0–0.09 1,454,325 35 0.09–0.28 250,884 8 0.28–0.49 150,544 5 0.49–0.74 36,839 3 0.74–1.40 2,053 0 5 Soil type Loam (Hydrologic soil group C) 160,884 3 Clay Loam (Hydrologic soil group D) 188,652 3 Clay Loam (Hydrologic soil group C) 498,986 14 Clay (Hydrologic soil group D: Clay 51% wt.) 1,033,565 30 Clay (Hydrologic soil group D: Clay 52% wt.) 13,662 1 6 Geomorphology Plateau 1,716,256 49 Alluvium 23,033 2 Structural Hills 19,411 0 Denudational Hills 136,011 0 7 Drainage Density (km/km2 ) 0–0.46 420,008 4 0.46–0.77 829,776 27 0.77–1.06 560,106 17 1.06–1.38 80,383 3 1.38–2.50 4,372 0 8 Slope 0–2.64o 1,127,483 33 2.64–6.88o 629,649 15 6.88–15.62o 99,499 3 15.62–29.66o 26,839 0 29.66o –67.54o 10,582 0 Content courtesy of Springer Nature, terms of use apply. Rights reserved.
  • 23. 2337 Comparison of multi‑influence factor, weight of evidence and… 1 3 Table 5  Spatial relationship among each influencing factor using WofE and FR technique Sr. No Thematic layer Feature of thematic layer Area % Well % W + W + P FR 1 Land use/land cover Agriculture 57.83 82.35 0.3536 0.0000383 1.424 Vegetation 4.81 0.00 0.0000 0.0000269 0.000 Water bodies 3.70 0.00 0.0000 0.0000269 0.000 Barren land 26.79 0.00 0.0000 0.0000269 0.000 Settlements 6.87 17.65 0.9439 0.0000692 2.570 2 Rainfall (mm) 600–637 6.07 13.73 0.8165 0.0000609 2.262 637–674 12.04 13.73 0.1308 0.0000307 1.140 674–712 32.07 25.49 − 0.2297 0.0000214 0.795 712–749 25.13 21.57 − 0.1528 0.0000231 0.858 749–786 24.69 25.49 0.0320 0.0000278 1.032 3 Elevation (m) 529–615 27.43 45.10 0.4974 0.0000443 1.644 615–674 29.97 17.65 − 0.5297 0.0000158 0.589 674–733 34.23 31.37 − 0.0870 0.0000247 0.917 733–886 7.35 5.88 − 0.2221 0.0000216 0.801 886–1384 0.99 0.00 0.0000 0.0000269 0.000 4 Lineament density (km/km 2 ) 0–0.09 76.76 68.63 − 0.1120 0.0000241 0.894 0.09–0.28 13.24 15.69 0.1695 0.0000319 1.185 0.28–0.49 7.95 9.80 0.2102 0.0000332 1.234 0.49–0.74 1.94 5.88 1.1071 0.0000814 3.025 0.74–1.40 0.11 0.00 0.0000 0.0000269 0.000 5 Soil type Loam (Hydrologic soil group C) 8.49 5.88 − 0.3671 0.0000186 0.693 Clay Loam (Hydrologic soil group D) 9.96 5.88 − 0.5263 0.0000159 0.591 Clay Loam (Hydrologic soil group C) 26.34 27.45 0.0415 0.0000281 1.042 Clay (Hydrologic soil group D: Clay 51% wt.) 54.55 58.82 0.0754 0.0000290 1.078 Clay (Hydrologic soil group D: Clay 52% wt.) 0.72 1.96 1.0004 0.0000732 2.719 Content courtesy of Springer Nature, terms of use apply. Rights reserved.
  • 24. 2338 N. L. Rane, G. K. Jayaraj 1 3 Table 5  (continued) Sr. No Thematic layer Feature of thematic layer Area % Well % W + W + P FR 6 Geomorphology Plateau 90.58 96.08 0.0589 0.0000286 1.061 Alluvium 1.22 3.92 1.1713 0.0000868 3.226 Structural Hills 1.02 0.00 0.0000 0.0000269 0.000 Denudational Hills 7.18 0.00 0.0000 0.0000269 0.000 7 Drainage Density (km/km 2 ) 0–0.46 22.17 7.84 − 1.0390 0.0000095 0.354 0.46–0.77 43.80 52.94 0.1897 0.0000325 1.209 0.77–1.06 29.56 33.33 0.1201 0.0000304 1.128 1.06–1.38 4.24 5.88 0.3268 0.0000373 1.386 1.38–2.50 0.23 0.00 0.0000 0.0000269 0.000 8 Slope 0–2.64 o 59.51 64.71 0.0838 0.0000293 1.087 2.64–6.88 o 33.23 29.41 − 0.1221 0.0000238 0.885 6.88–15.62 o 5.25 5.88 0.1135 0.0000302 1.120 15.62–29.66 o 1.42 0.00 0.0000 0.0000269 0.000 29.66–67.54 o 0.56 0.00 0.0000 0.0000269 0.000 W + weight of evidence, ­ W + P weight of evidence probability, and FR frequency ratio Content courtesy of Springer Nature, terms of use apply. Rights reserved.
  • 25. 2339 Comparison of multi‑influence factor, weight of evidence and… 1 3 Fig. 13  Groundwater potential zones delineated using WofE Technique Content courtesy of Springer Nature, terms of use apply. Rights reserved.
  • 26. 2340 N. L. Rane, G. K. Jayaraj 1 3 Funding No funding was received. Declaration Conflicts of interest None. References Achu, A. L., Thomas, J., Reghunath, R. (2020). Multi-criteria decision analysis for delineation of ground- water potential zones in a tropical river basin using remote sensing, GIS and analytical hierarchy pro- cess (AHP). Groundwater for Sustainable Development, 10, 100365. Adimalla, N., Taloor, A. K. (2020). Hydrogeochemical investigation of groundwater quality in the hard rock terrain of South India using Geographic Information System (GIS) and groundwater quality index (GWQI) techniques. Groundwater for Sustainable Development, 10, 100288. Akgun, A., Dag, S., Bulut, F. (2008). Landslide susceptibility mapping for a landslide-prone area (Findikli, NE of Turkey) by likelihood-frequency ratio and weighted linear combination models. Envi- ronmental Geology, 54(6), 1127–1143. Fig. 14  Groundwater potential zones delineated using FR Technique Content courtesy of Springer Nature, terms of use apply. Rights reserved.
  • 27. 2341 Comparison of multi‑influence factor, weight of evidence and… 1 3 Aksever, F., Davraz, A., Karaguzel, R. (2015). Groundwater balance estimation and sustainability in the Sandıklı Basin (Afyonkarahisar/Turkey). Journal of Earth System Science, 124(4), 783–798. Armaş, I. (2012). Weights of evidence method for landslide susceptibility mapping Prahova Subcarpathians, Romania. Natural Hazards, 60(3), 937–950. Arulbalaji, P., Padmalal, D., Sreelash, K. (2019). GIS and AHP techniques based delineation of ground- water potential zones: a case study from southern Western Ghats. India. Scientific Reports, 9(1), 1–17. Asoka, A., Gleeson, T., Wada, Y., Mishra, V. (2017). Relative contribution of monsoon precipitation and pumping to changes in groundwater storage in India. Nature Geoscience, 10(2), 109–117. Bear, J., Cheng, A. H. D., Sorek, S., Ouazar, D., Herrera, I. (1999). Seawater intrusion in coastal aquifers: concepts, methods and practices (Vol. 14). Springer Science Business Media. CGWB (2014) Groundwater Information Nashik District Maharashtra. Central Ground Water Board, 1–17. http://​cgwb.​gov.​in/​distr​ict_​profi​le/​mahar​ashtra/​nashik.​pdf. Accessed 4 September 2020 CGWB (2017) Dynamic groundwater resources of India. Central Ground Water Board, G. o. I. Ministry of Jal Shakti. http://​cgwb.​gov.​in/​GW-​Asses​sment/​GWRA-​2017-​Natio​nal-​Compi​lation.​pdf. Accessed 7 September 2020. Cao, C., Xu, P., Wang, Y., Chen, J., Zheng, L., Niu, C. (2016). Flash flood hazard susceptibility mapping using frequency ratio and statistical index methods in coalmine subsidence areas. Sustainability, 8(9), 948. Chowdhury, A., Jha, M. K., Chowdary, V. M., Mal, B. C. (2009). Integrated remote sensing and GIS- based approach for assessing groundwater potential in West Medinipur district, West Bengal. India. International Journal of Remote Sensing, 30(1), 231–250. Corsini, A., Cervi, F., Ronchetti, F. (2009). Weight of evidence and artificial neural networks for potential groundwater spring mapping: an application to the Mt. Modino area (Northern Apennines, Italy). Geo- morphology, 111(1–2), 79–87. Das, B., Pal, S. C., Malik, S., Chakrabortty, R. (2019). Modeling groundwater potential zones of Puruliya district, West Bengal, India using remote sensing and GIS techniques. Geology, Ecology, and Land- scapes, 3(3), 223–237. Das, S., Pardeshi, S. D. (2018). Integration of different influencing factors in GIS to delineate ground- water potential areas using IF and FR techniques: a study of Pravara basin, Maharashtra. India. Applied Water Science, 8(7), 197. Devi, P. S., Srinivasulu, S., Raju, K. K. (2001). Hydrogeomorphological and groundwater prospects of the Pageru river basin by using remote sensing data. Environmental Geology, 40(9), 1088–1094. Fashae, O. A., Tijani, M. N., Talabi, A. O., Adedeji, O. I. (2014). Delineation of groundwater poten- tial zones in the crystalline basement terrain of SW-Nigeria: an integrated GIS and remote sensing approach. Applied Water Science, 4(1), 19–38. GSI. (2001). District Resources Map. Geological Survey of India Publications Calcutta. Ganapuram, S., Kumar, G. V., Krishna, I. M., Kahya, E., Demirel, M. C. (2009). Mapping of ground- water potential zones in the Musi basin using remote sensing data and GIS. Advances in Engineer- ing Software, 40(7), 506–518. Gayen, A., Saha, S. (2017). Application of weights-of-evidence (WoE) and evidential belief function (EBF) models for the delineation of soil erosion vulnerable zones: a study on Pathro river basin, Jharkhand. India. Modeling Earth Systems and Environment, 3(3), 1123–1139. Ghasemi, A., Saghafian, B., Golian, S. (2017). System dynamics approach for simulating water resources of an urban water system with emphasis on sustainability of groundwater. Environmental Earth Sciences, 76(18), 637. Ghorbani Nejad, S., Falah, F., Daneshfar, M., Haghizadeh, A., Rahmati, O. (2017). Delineation of groundwater potential zones using remote sensing and GIS-based data-driven models. Geocarto International, 32(2), 167–187. Ghude, S. D., Jena, C., Chate, D. M., Beig, G., Pfister, G. G., Kumar, R., Ramanathan, V. (2014). Reductions in India’s crop yield due to ozone. Geophysical Research Letters, 41(15), 5685–5691. Gnanachandrasamy, G., Zhou, Y., Bagyaraj, M., Venkatramanan, S., Ramkumar, T., Wang, S. (2018). Remote sensing and GIS based groundwater potential zone mapping in Ariyalur District, Tamil Nadu. Journal of the Geological Society of India, 92(4), 484–490. Gumma, M. K., Pavelic, P. (2013). Mapping of groundwater potential zones across Ghana using remote sensing, geographic information systems, and spatial modeling. Environmental Monitoring and Assessment, 185(4), 3561–3579. Gupta, M., Srivastava, P. K. (2010). Integrating GIS and remote sensing for identification of ground- water potential zones in the hilly terrain of Pavagarh, Gujarat. India. Water International, 35(2), 233–245. Gurdak, J. J. (2017). Groundwater: Climate-induced pumping. Nature Geoscience, 10(2), 71–71. Content courtesy of Springer Nature, terms of use apply. Rights reserved.
  • 28. 2342 N. L. Rane, G. K. Jayaraj 1 3 Hembram, T. K., Paul, G. C., Saha, S. (2019). Comparative analysis between morphometry and geo- environmental factor based soil erosion risk assessment using weight of evidence model: A study on jainti river basin. Eastern India. Environmental Processes, 6(4), 883–913. Hong, H., Ilia, I., Tsangaratos, P., Chen, W., Xu, C. (2017). A hybrid fuzzy weight of evidence method in landslide susceptibility analysis on the Wuyuan area, China. Geomorphology, 290, 1–16. Hong, H., Tsangaratos, P., Ilia, I., Liu, J., Zhu, A. X., Chen, W. (2018). Application of fuzzy weight of evidence and data mining techniques in construction of flood susceptibility map of Poyang County, China. Science of the Total Environment, 625, 575–588. Jenifer, M. A., Jha, M. K. (2017). Comparison of Analytic Hierarchy Process, Catastrophe and Entropy techniques for evaluating groundwater prospect of hard-rock aquifer systems. Journal of Hydrology, 548, 605–624. Jha, M. K., Chowdhury, A., Chowdary, V. M., Peiffer, S. (2007). Groundwater management and development by integrated remote sensing and geographic information systems: prospects and con- straints. Water Resources Management, 21(2), 427–467. Katpatal, Y. B., Pophare, A. M., Lamsoge, B. R. (2014). A groundwater flow model for overexploited basaltic aquifer and Bazada formation in India. Environmental Earth Sciences, 72(11), 4413–4425. Kaur, L., Rishi, M. S., Singh, G., Thakur, S. N. (2020). Groundwater potential assessment of an allu- vial aquifer in Yamuna sub-basin (Panipat region) using remote sensing and GIS techniques in con- junction with analytical hierarchy process (AHP) and catastrophe theory (CT). Ecological Indica- tors, 110, 105850. Kayastha, P., Dhital, M. R., De Smedt, F. (2012). Landslide susceptibility mapping using the weight of evidence method in the Tinau watershed. Nepal. Natural Hazards, 63(2), 479–498. Kim, J. C., Jung, H. S., Lee, S. (2019). Spatial mapping of the groundwater potential of the geum river basin using ensemble models based on remote sensing images. Remote Sensing, 11(19), 2285. Krishnamurthy, J., Venkatesa Kumar, N., Jayaraman, V., Manivel, M. (1996). An approach to demar- cate ground water potential zones through remote sensing and a geographical information system. International Journal of Remote Sensing, 17(10), 1867–1884. Kumar, D. P. K., Gopinath, G., Seralathan, P. (2007). Application of remote sensing and GIS for the demarcation of groundwater potential zones of a river basin in Kerala, southwest coast of India. International Journal of Remote Sensing, 28(24), 5583–5601. Lee, G. F., Jones-Lee, A. (2004). Appropriate use of chemical information in a best professional judg- ment triad weight-of-evidence evaluation of sediment quality. Aquatic Ecosystem Health Man- agement, 7(3), 351–356. Lee, S., Kim, Y. S., Oh, H. J. (2012). Application of a weights-of-evidence method and GIS to regional groundwater productivity potential mapping. Journal of Environmental Management, 96(1), 91–105. Lee, S., Pradhan, B. (2007). Landslide hazard mapping at Selangor, Malaysia using frequency ratio and logistic regression models. Landslides, 4(1), 33–41. Machiwal, D., Jha, M. K., Mal, B. C. (2011). Assessment of groundwater potential in a semi-arid region of India using remote sensing, GIS and MCDM techniques. Water Resources Management, 25(5), 1359–1386. Magesh, N. S., Chandrasekar, N., Soundranayagam, J. P. (2012). Delineation of groundwater potential zones in Theni district, Tamil Nadu, using remote sensing. GIS and MIF Techniques. Geoscience Frontiers, 3(2), 189–196. Mahmoud, S. H. (2014). Delineation of potential sites for groundwater recharge using a GIS-based deci- sion support system. Environmental Earth Sciences, 72(9), 3429–3442. Mohammady, M., Pourghasemi, H. R., Amiri, M. (2019). Assessment of land subsidence susceptibil- ity in Semnan plain (Iran): A comparison of support vector machine and weights of evidence data mining algorithms. Natural Hazards, 99(2), 951–971. Murthy, K. S. R. (2000). Ground water potential in a semi-arid region of Andhra Pradesh-a geographical information system approach. International Journal of Remote Sensing, 21(9), 1867–1884. Oh, H. J., Kim, Y. S., Choi, J. K., Park, E., Lee, S. (2011). GIS mapping of regional probabilistic groundwater potential in the area of Pohang City. Korea. Journal of Hydrology, 399(3–4), 158–172. Palmer, M. A., Reidy Liermann, C. A., Nilsson, C., Flörke, M., Alcamo, J., Lake, P. S., Bond, N. (2008). Climate change and the world’s river basins: anticipating management options. Frontiers in Ecology and the Environment, 6(2), 81–89. Pande, C. B., Moharir, K. N., Singh, S. K., Varade, A. M. (2019). An integrated approach to delineate the groundwater potential zones in Devdari watershed area of Akola district, Maharashtra, Central India. Environment, Development and Sustainability, 1–21. Content courtesy of Springer Nature, terms of use apply. Rights reserved.
  • 29. 2343 Comparison of multi‑influence factor, weight of evidence and… 1 3 Parisi, A., Monno, V., Fidelibus, M. D. (2018). Cascading vulnerability scenarios in the management of groundwater depletion and salinization in semi-arid areas. International Journal of Disaster Risk Reduction, 30, 292–305. Pinto, D., Shrestha, S., Babel, M. S., Ninsawat, S. (2017). Delineation of groundwater potential zones in the Comoro watershed, Timor Leste using GIS, remote sensing and analytic hierarchy process (AHP) technique. Applied Water Science, 7(1), 503–519. Raju, R. S., Raju, G. S., Rajasekhar, M. (2019). Identification of groundwater potential zones in Man- davi River basin, Andhra Pradesh, India using remote sensing, GIS and MIF techniques. HydroRe- search, 2, 1–11. Rane, N., Jayaraj, G. K. (2021). Stratigraphic modeling and hydraulic characterization of a typical basaltic aquifer system in the Kadva river basin, Nashik. India. Model. Earth Syst. Environ., 7, 293–306. Razandi, Y., Pourghasemi, H. R., Neisani, N. S., Rahmati, O. (2015). Application of analytical hierar- chy process, frequency ratio, and certainty factor models for groundwater potential mapping using GIS. Earth Science Informatics, 8(4), 867–883. Roy, A., Keesari, T., Sinha, U. K., Sabarathinam, C. (2019). Delineating groundwater prospect zones in a region with extreme climatic conditions using GIS and remote sensing techniques: A case study from central India. Journal of Earth System Science, 128(8), 1–19. Sahoo, S., Jha, M. K., Kumar, N., Chowdary, V. M. (2015). Evaluation of GIS-based multicriteria decision analysis and probabilistic modeling for exploring groundwater prospects. Environmental Earth Sciences, 74(3), 2223–2246. Sahoo, S., Munusamy, S. B., Dhar, A., Kar, A., Ram, P. (2017). Appraising the accuracy of multi-class frequency ratio and weights of evidence method for delineation of regional groundwater potential zones in canal command system. Water Resources Management, 31(14), 4399–4413. Sanderson, H., Dyer, S. D., Price, B. B., Nielsen, A. M., van Compernolle, R., Selby, M., Stanton, K., Evans, A., Ciarlo, M., Sedlak, R. (2006). Occurrence and weight-of-evidence risk assessment of alkyl sulfates, alkyl ethoxysulfates, and linear alkylbenzene sulfonates (LAS) in river water and sediments. Science of the Total Environment, 368(2–3), 695–712. Selvakumar, S., Chandrasekar, N., Kaliraj, S., Magesh, N. S. (2018). Salinization of shallow aquifer in the Karamaniyar river basin, Southern India. Environment, Development and Sustainability, 20(3), 1255–1273. Shah, T. (2009). Climate change and groundwater: India’s opportunities for mitigation and adaptation. Environmental Research Letters, 4(3), 035005. Shah, T. (2010). Taming the anarchy: Groundwater governance in South Asia. England: Routledge. Shahid, S., Nath, S., Roy, J. (2000). Groundwater potential modelling in a soft rock area using a GIS. International Journal of Remote Sensing, 21(9), 1919–1924. Shahinuzzaman, M., Haque, M. N., Shahid, S. (2021). Delineation of groundwater potential zones using a parsimonious concept based on catastrophe theory and analytical hierarchy process. Hydro- geology Journal, 1–26. Singh, A. (2014). Groundwater resources management through the applications of simulation modeling: a review. Science of the Total Environment, 499, 414–423. Singh, L. K., Jha, M. K., Chowdary, V. M. (2018). Assessing the accuracy of GIS-based Multi-Cri- teria Decision Analysis approaches for mapping groundwater potential. Ecological Indicators, 91, 24–37. Srinivasa Rao, Y., Jugran, D. K. (2003). Delineation of groundwater potential zones and zones of groundwater quality suitable for domestic purposes using remote sensing and GIS. Hydrological Sciences Journal, 48(5), 821–833. Tahmassebipoor, N., Rahmati, O., Noormohamadi, F., Lee, S. (2016). Spatial analysis of groundwater potential using weights-of-evidence and evidential belief function models and remote sensing. Ara- bian Journal of Geosciences, 9(1), 79. Tehrany, M. S., Pradhan, B., Jebur, M. N. (2014). Flood susceptibility mapping using a novel ensemble weights-of-evidence and support vector machine models in GIS. Journal of Hydrology, 512, 332–343. Thapa, R., Gupta, S., Gupta, A., Reddy, D. V., Kaur, H. (2018). Use of geospatial technology for delin- eating groundwater potential zones with an emphasis on water-table analysis in Dwarka River basin, Birbhum. India. Hydrogeology Journal, 26(3), 899–922. Tolche, A. D. (2021). Groundwater potential mapping using geospatial techniques: a case study of Dhung- eta-Ramis sub-basin, Ethiopia. Geology, Ecology, and Landscapes, 5(1), 65–80. Tsanis, I. K., Apostolaki, M. G. (2009). Estimating groundwater withdrawal in poorly gauged agricultural basins. Water Resources Management, 23(6), 1097–1123. Content courtesy of Springer Nature, terms of use apply. Rights reserved.
  • 30. 2344 N. L. Rane, G. K. Jayaraj 1 3 Vasanthavigar, M., Srinivasamoorthy, K., Vijayaragavan, K., Ganthi, R. R., Chidambaram, S., Anandhan, P., Manivannan, R., Vasudevan, S. (2010). Application of water quality index for groundwater qual- ity assessment: Thirumanimuttar sub-basin, Tamilnadu. India. Environmental Monitoring and Assess- ment, 171(1–4), 595–609. Voudouris, K. S. (2006). Groundwater balance and safe yield of the coastal aquifer system in NEastern Korinthia. Greece. Applied Geography, 26(3–4), 291–311. Wada, Y., Van Beek, L. P., Van Kempen, C. M., Reckman, J. W., Vasak, S., Bierkens, M. F. (2010). Global depletion of groundwater resources. Geophysical research letters. https://​doi.​org/​10.​1029/​ 2010G​L0445​71 Wagh, V. M., Panaskar, D. B., Muley, A. A., Mukate, S. V. (2017). Groundwater suitability evaluation by CCME WQI model for Kadava river basin, Nashik, Maharashtra. India. Modeling Earth Systems and Environment, 3(2), 557–565. Waikar, M. L., Nilawar, A. P. (2014). Identification of groundwater potential zone using remote sensing and GIS technique. International Journal of Innovative Research in Science, Engineering and Technol- ogy, 3(5), 12163–12174. Xu, C., Xu, X., Dai, F., Xiao, J., Tan, X., Yuan, R. (2012). Landslide hazard mapping using GIS and weight of evidence model in Qingshui river watershed of 2008 Wenchuan earthquake struck region. Journal of Earth Science, 23(1), 97–120. Yeh, H. F., Cheng, Y. S., Lin, H. I., Lee, C. H. (2016). Mapping groundwater recharge potential zone using a GIS approach in Hualian River. Taiwan. Sustainable Environment Research, 26(1), 33–43. Yeh, H. F., Lee, C. H., Hsu, K. C., Chang, P. H. (2009). GIS for the assessment of the groundwater recharge potential zone. Environmental Geology, 58(1), 185–195. Yesilnacar, M. I., Sahinkaya, E., Naz, M., Ozkaya, B. (2008). Neural network prediction of nitrate in groundwater of Harran Plain. Turkey. Environmental Geology, 56(1), 19–25. Zhu, Q., Abdelkareem, M. (2021). Mapping groundwater potential zones using a knowledge-driven approach and GIS analysis. Water, 13(5), 579. Publisher’s Note Springer Nature remains neutral with regard to jurisdictional claims in published maps and institutional affiliations. Content courtesy of Springer Nature, terms of use apply. Rights reserved.
  • 31. 1. 2. 3. 4. 5. 6. Terms and Conditions Springer Nature journal content, brought to you courtesy of Springer Nature Customer Service Center GmbH (“Springer Nature”). Springer Nature supports a reasonable amount of sharing of research papers by authors, subscribers and authorised users (“Users”), for small-scale personal, non-commercial use provided that all copyright, trade and service marks and other proprietary notices are maintained. By accessing, sharing, receiving or otherwise using the Springer Nature journal content you agree to these terms of use (“Terms”). For these purposes, Springer Nature considers academic use (by researchers and students) to be non-commercial. These Terms are supplementary and will apply in addition to any applicable website terms and conditions, a relevant site licence or a personal subscription. These Terms will prevail over any conflict or ambiguity with regards to the relevant terms, a site licence or a personal subscription (to the extent of the conflict or ambiguity only). For Creative Commons-licensed articles, the terms of the Creative Commons license used will apply. We collect and use personal data to provide access to the Springer Nature journal content. We may also use these personal data internally within ResearchGate and Springer Nature and as agreed share it, in an anonymised way, for purposes of tracking, analysis and reporting. We will not otherwise disclose your personal data outside the ResearchGate or the Springer Nature group of companies unless we have your permission as detailed in the Privacy Policy. While Users may use the Springer Nature journal content for small scale, personal non-commercial use, it is important to note that Users may not: use such content for the purpose of providing other users with access on a regular or large scale basis or as a means to circumvent access control; use such content where to do so would be considered a criminal or statutory offence in any jurisdiction, or gives rise to civil liability, or is otherwise unlawful; falsely or misleadingly imply or suggest endorsement, approval , sponsorship, or association unless explicitly agreed to by Springer Nature in writing; use bots or other automated methods to access the content or redirect messages override any security feature or exclusionary protocol; or share the content in order to create substitute for Springer Nature products or services or a systematic database of Springer Nature journal content. In line with the restriction against commercial use, Springer Nature does not permit the creation of a product or service that creates revenue, royalties, rent or income from our content or its inclusion as part of a paid for service or for other commercial gain. Springer Nature journal content cannot be used for inter-library loans and librarians may not upload Springer Nature journal content on a large scale into their, or any other, institutional repository. These terms of use are reviewed regularly and may be amended at any time. Springer Nature is not obligated to publish any information or content on this website and may remove it or features or functionality at our sole discretion, at any time with or without notice. Springer Nature may revoke this licence to you at any time and remove access to any copies of the Springer Nature journal content which have been saved. To the fullest extent permitted by law, Springer Nature makes no warranties, representations or guarantees to Users, either express or implied with respect to the Springer nature journal content and all parties disclaim and waive any implied warranties or warranties imposed by law, including merchantability or fitness for any particular purpose. Please note that these rights do not automatically extend to content, data or other material published by Springer Nature that may be licensed from third parties. If you would like to use or distribute our Springer Nature journal content to a wider audience or on a regular basis or in any other manner not expressly permitted by these Terms, please contact Springer Nature at onlineservice@springernature.com