Seal of Good Local Governance (SGLG) 2024Final.pptx
Unit+7 1
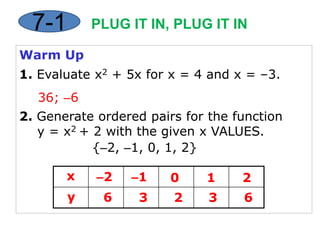
1. x –2 –1 0 1 2 y 6 3 2 3 6 7-1 PLUG IT IN, PLUG IT IN Warm Up 1. Evaluate x2 + 5x for x = 4 and x = –3. 36; –6 2. Generate ordered pairs for the function y = x2 + 2 with the given x VALUES. {–2, –1, 0, 1, 2}
2. QUADRATIC FUNCTIONSAND THEIR GRAPHS NC GOAL: 4.02 Graph, factor, and evaluate quadratic functions to solve problems. 7-1
11. BLOOMS Analysing Comparing Organising Deconstructing Attributing Outlining Finding Structuring Integrating 7-1 Can you break information into parts to explore understandings and relationships?
12. TLWBAT FIND THE VERTEX OF A QUADRATIC FUNCTION, AND IDENTIFY THE AXIS OF SYMMETRY AND SOLUTIONS. GRAPH A PARABOLA ON THE COORDINATE PLANE USING THE VERTEX, SOLUTIONS, AND OTHER ORDERED PAIRS. 7-1
13. WHAT IS A “PARABOLA”? THE GRAPH OF A QUADRATIC FUNCTION
14. 7-1 The graph of a quadratic function is a curve called a parabola. To graph a quadratic function, generate enough ordered pairs to see the shape of the parabola. Then connect the points with a smooth curve.
15. WHAT IS THE STANDARD FORM OF A QUADRATIC FUNCTION? ax2 + bx + c = 0 BUT a= 0
16. WHAT IS A “VERTEX”? THE VERTEX IS THE HIGHEST OR LOWEST POINT ON THE GRAPH. NOTE: A POINT IS AN (x,y) COORDINATE.
17. LETS TALK MAX AND MIN A PARABOLA HAS EITHER A MAXIMUM POINT OR A MINIMUM POINT, ALSO KNOWN AS THE VERTEX MAXIMUM POINT/HIGHEST POINT MINIMUM POINT/LOWEST POINT
18. WHAT CAN THE LEADING COEFFICIENT IN A QUADRATIC FUNCTION TELL ME? IF THE LEADING COEFFICIENT IS POSITIVE, THE GRAPH SMILES. IF THE LEADING COEFFICIENT IS NEGATIVE, THE GRAPH FROWNS. 2x2 + 3x – 4 MINIMUM POINT -2x2+ 3x – 4 MAXIMUM POINT
20. A. B. 7-1 Example 1: Identifying the Vertex and the Minimum or Maximum Identify the vertex of each parabola. Then give the minimum or maximum value of the function. The vertex is (–3, 2), and the minimum is 2. The vertex is (2, 5), and the maximum is 5.
21. a. b. 7-1 Check It Out! Example 2 Identify the vertex of each parabola. Then give the minimum or maximum value of the function. The vertex is (3, –1), and the minimum is –1. The vertex is (–2, 5) and the maximum is 5.
22. WHAT IS THE “AXIS OF SYMMETRY”? THE IMAGINARY LINE DOWN THE MIDDLE OF THE PARABOLA MAKING BOTH SIDES MIRROR IMAGES. AXIS OF SYMMETRY THE AXIS OF SYMMETRY IS ALWAYS THE x VALUE IN THE VERTEX.
23. WHAT EXACTLY ARE SOLUTIONS TO A QUADRATIC FUNCTION? THE SOLUTIONS ARE THE X VALUES WHERE THE PARABOLA CROSSES THE x AXIS. I AM A SOLUTION SO AM I
24.
25. Example: (2,3)x,y You move left and right to graph an x value and up and down to graph a y value. Lets try a few. ALWAYS BEGIN FROM THE ORIGIN
28. Push 2nd, trace, : notice #3 and 4? What does our graph have? Push 3 NOW IT GETS TRICKY
29. USE YOUR ARROWS TO MOVE TO THE LEFT OF THE VERTEX, STAY VERY CLOSE THOUGH, AND HIT ENTER. NOW MOVE TO THE RIGHT OF THE VERTEX, BUT STAY CLOSE, AND HIT ENTER 2 TIMES.
30.
31.
32. If you push 2nd graph you will have a gozillion points to choose from. Pick a few.
33.
34. 7-1 x y –2 –16 –1 –4 0 0 1 –4 2 –16 Example 4: Graphing Quadratic Functions by Using a Table of Values Use a table of values to graph the quadratic function. y = –4x2 Make a table of values. Choose values of x and use them to find values of y. Graph the points. Then connect the points with a smooth curve.