Facebook Predictive Lifetime Value
•
2 gostaram•1,226 visualizações

If you are managing performance marketing campaigns at scale, take a look this infographic to discover how savvy marketers are leveraging predictive lifetime value to maximize their return.
Recomendados

Recomendados
Mais conteúdo relacionado
Mais procurados
Mais procurados (20)
Semelhante a Facebook Predictive Lifetime Value
Semelhante a Facebook Predictive Lifetime Value (20)
Mais de Nanigans
Mais de Nanigans (20)
Último
Último (20)
Facebook Predictive Lifetime Value
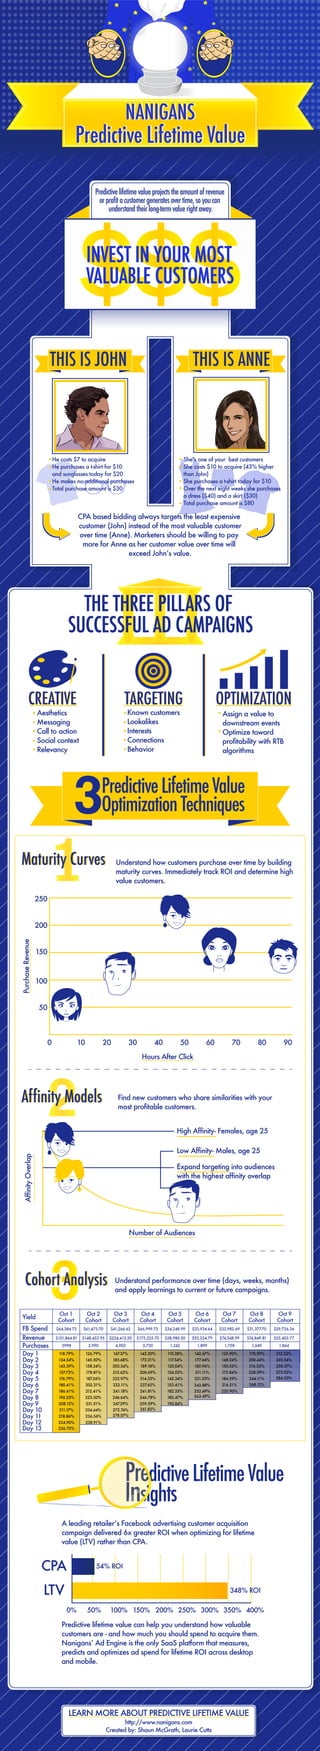
- 1. Maturity CurvesMaturity Curves Predictive Lifetime Value NANIGANS Predictive Lifetime Value NANIGANS INVEST IN YOUR MOST VALUABLE CUSTOMERS THE THREE PILLARS OF SUCCESSFUL AD CAMPAIGNS OPTIMIZATIONOPTIMIZATION Assign a value to downstream events Optimize toward profitability with RTB algorithms TARGETINGTARGETING Known customers Lookalikes Interests Connections Behavior CREATIVECREATIVE Aesthetics Messaging Call to action Social context Relevancy Affinity ModelsAffinity Models Find new customers who share similarities with your most profitable customers. Cohort AnalysisCohort Analysis Understand performance over time (days, weeks, months) and apply learnings to current or future campaigns. Understand how customers purchase over time by building maturity curves. Immediately track ROI and determine high value customers. She costs $10 to acquire (43% higher than John) She purchases a t-shirt today for $10 Over the next eight weeks she purchases a dress ($40) and a skirt ($30) Total purchase amount is $80 He costs $7 to acquire He purchases a t-shirt for $10 and sunglasses today for $20 He makes no additional purchases Total purchase amount is $30 3PredictiveLifetimeValue OptimizationTechniques3 THIS IS JOHNTHIS IS JOHN THIS IS MIKETHIS IS ANNE Hours After Click PurchaseRevenue 0 10 50 100 150 200 250 20 30 40 50 60 70 80 90 High Affinity- Females, age 25 Low Affinity- Males, age 25 Expand targeting into audiences with the highest affinity overlap CPA based bidding always targets the least expensive customer (John) instead of the most valuable customer over time (Anne). Marketers should be willing to pay more for Anne as her customer value over time will Number of Audiences http://www.nanigans.com Created by: Shaun McGrath, Laurie Cutts LEARN MORE ABOUT PREDICTIVE LIFETIME VALUE AffinityOverlap campaign delivered 6x greater ROI when optimizing for lifetime value (LTV) rather than CPA. Predictive lifetime value can help you understand how valuable customers are - and how much you should spend to acquire them. predicts and optimizes ad spend for lifetime ROI across desktop and mobile. PredictiveLifetimeValue Insights CPA LTV 0% 50% 100% 150% 200% 250% 300% 350% 400% 54% ROI 348% ROI Predictivelifetimevalueprojectstheamountofrevenue orprofitacustomergeneratesovertime,soyoucan understandtheirlong-termvaluerightaway. Day 1 Day 2 Day 3 Day 4 Day 5 Day 6 Day 7 Day 8 Day 9 Day 10 Day 11 Day 12 Day 13 Oct 1 Cohort Oct 2 Cohort Oct 3 Cohort Oct 4 Cohort Oct 5 Cohort Oct 6 Cohort Oct 7 Cohort Oct 8 Cohort Oct 9 Cohort Yield Purchases Revenue FB Spend $64,384.73 $151,864.81 3998 118.79% 134.54% 143.39% 157.72% 176.79% 180.41% 186.41% 196.25% 208.12% 211.17% 218.86% 224.90% 236.75% $61,473.70 $148,453.95 3,990 126.79% 145.50% 158.34% 178.81% 187.26% 202.31% 212.41% 223.50% 231.51% 234.64% 236.56% 238.91% $61,266.62 $224,413.50 4,903 167.37% 185.68% 203.54% 213.63% 222.97% 232.11% 241.18% 246.64% 267.29% 272.74% 278.07% $66,999.73 $175,225.70 3,730 143.30% 172.21% 189.18% 200.69% 214.33% 227.62% 241.81% 246.78% 259.59% 261.82% $34,248.99 $58,980.50 1,342 110.38% 117.54% 120.04% 134.53% 142.34% 153.41% 182.33% 185.47% 190.84% $33,934.64 $74,548.99 1,758 125.90% 148.24% 150.52% 175.84% 186.29% 220.90% $33,982.69 $92,254.79 1,899 142.67% 177.44% 185.96% 211.11% 221.33% 252.49% 263.49% 243.88% $31,377.70 $74,849.81 1,649 178.39% 200.44% 216.52% 268.12% 244.11% 228.59% $29,726.34 $55,403.77 1,864 212.22% 245.54% 258.37% 273.93% 284.30% 214.51%