SlideShare uma empresa Scribd logo
1 de 30
Baixar para ler offline
Key Assumption
        Currency
      1
        Convertion
        1$=                      Rp                             8,552
        1€=                      $                               1.48
        1€=                      Rp                            12,657
      2 Inflation Rate
                           6.70%
          Days, Month and
      3
          Year
          1 Month =              25 workdays
          1 Year =               300 days
      4   Price from supplier:
          Jatropha seed          free (from Indocement Plantation)
          Used Oil               Rp. 1400/ litre (from restauran chain)
          Spiritus               Rp. 9500/ litre
          each price assume increasing relative based on inflation
      5   All activity is assumed no account receivable and no
      6   Price for CER is assumed € 17 /tonCO2/year
1$=                                             Rp 8,552
1€=                                             $    1.48
1€=                                             Rp 12,657

Initial Fee per CDM Project                     €    75,000 =                $ 111,000 =
                                                      0             1           2             3
 Baseline Emission                                                  1,610        1,610        1,610
 Project Emission                                                       0            0            0
 Leakage                                                                0            0            0
 Emission Reduction                                                 1,610        1,610        1,610


Baseline emission
Household                                             2,146
CO2 dari penggunaan minyak tanah per keluarga          0.75 ton/CO2 per year
                                                                        =                        300
emission per year                                     1,610 ton CO2
Project Emission
Luas lahan Jathropa                                     170    ha           =              1,700,000
hasil per m2                                           0.19    liter/year
Total hasil plant oil                               321,970    liter/year
Penggunaan per kepala keluarga per tahun                150    liter/year
Jumlah kepala keluarga yang dapat disupplai           2,146    kepala keluarga
Emission per year                                       0.00

kebutuhan untuk :
                                                                                            321,970
                                                                                            321,970
                                                                                            321,970

Protos User                                           1,600          3,300         5,000      6,500
Fuel Suplly needs                                   240,000        495,000       750,000    975,000
Used Oil needs                                      300,000        350,000       428,030    653,030
Spiritus requirement/week/household                      0.7 litre
Spiritus needs                                       58,240        120,120       182,000    236,600
Rp    949,272,000
         4                5
            1,610        1,610   tonCO2 per year
                0            0   tonCO2 per year
                0            0   tonCO2 per year
            1,610        1,610   tonCO2 per year


lt/year


m2


              8,000
          1,200,000 liter/year
            878,030 liter/year

           291,200 litre/year
1$=
1€=
1€=

Initial Fee per CDM P


ERy


fNRB,y
NCVbiomass
EFprojected_fossil_fuel
ƞold
ƞnew
HGpy


 Protos User
By
By,saving
1$=                           Rp     8,552
1€=                           $       1.48
1€=                           Rp    12,657

Initial Fee per CDM Project   €     75,000 =              $     111,000 =              Rp   949,272,000

                                                                            Year
                                    0              1              2            3                 4

ERy                                           1,722.24         3,552.12     5,382.00             6,996.60


fNRB,y                                 1.00
NCVbiomass                             0.02   TJ/tonnes
EFprojected_fossil_fuel               71.50   tCO2/TJ
ƞold                                   0.35               25 lt plant oil      =                     0.23
ƞnew                                   0.55
HGpy                               8,999.99   TJ
                                                          1 kwh                =       3599,99


 Protos User                        =           1,600        1,700   1,700                        1,500
By                                  =          4416.00     4692.00 4692.00                      4140.00
By,saving                           =         1605.818 1706.181818 1706.182                 1505.454545
5

     8,611.20


tonnes woods


TJ              (2.5 Kwh)


       1,500 tonnes
     4140.00 tonnes
 1505.454545 tonnes
1$=                                            Rp 8,552
1€=                                            $    1.48
1€=                                            Rp 12,657

Initial Fee per CDM Project                    € 75,000


                                                    0
 Baseline Emission
 Project Emission
 Leakage
 Emission Reduction


used oil                                       100 lt
gassoline                                      1 lt
biodiesel                                      1 lt
used oil (100%)                                1 lt

Suplly needs
Used oil Capacity

 Leakage: jarak ke majalengka dari citeureup
(per hari)                                          120
 Total jarak tempuh per tahun                    36,000
                                               gassoline
Leakage from program                                   7
=               $ 111,000 =                          Rp   949,272,000

                                    Year
      1               2                3                    4              5
          690             805                984                1,502      2,019   tonCO2 per year
          150             175                214                  326        438   tonCO2 per year
            7              10                 15                   23         35   tonCO2 per year
          533             620                755                1,153      1,547   tonCO2 per year


      =                  80     biodiesel (liters)
      =                  2.3    kg CO2
      =              0.4991     kg CO2
      =                    0    kg CO2

    240,000         495,000             750,000              975,000    1,200,000 1,200,000 (Lt/year)
    300,000         350,000             428,030              653,030      878,030   878,030 (Lt/year)


km
km
1 km            =                            0.19 kg CO2
ton CO2
05-10-12
Biokraftstoffe                                1 $                    =                 Rp     8,552 Rp                   N o t es                                                                                                                                                                                                                           11:37 AM
Revenue Projections                               inflasi            =                        6.70%
Years 1 to 5                                                  1.00   =                 $       1.48
(Rp)                                                          1.00   =                       12,657   Rp
                                        Year 1              Year 2           Year 3         Year 4             Year 5
Protos
       Sales (unit)                      1,600            1,700                1,700          1,500              1,500
       Price per unit ($)                   20               21                   23             24                 26
       Price per unit (Rp)             171,040          182,500              194,727        207,774            221,695
             Total                 273,664,000      310,249,456          331,036,170    311,660,817        332,542,092
    % of Revenue                         8.33%            6.28%                5.08%          3.56%              2.95%
Fuel (Jatropha Oil)
       Sales (litres)                   321,970       321,970       321,970       321,970                   321,970
       Price per unit (Rp)                3,500         3,735         3,985         4,252                     4,537
             Total                1,126,893,939 1,202,395,833 1,282,956,354 1,368,914,430             1,460,631,697
    % of Revenue                         34.32%        24.33%        19.68%        15.64%                    12.97%
Used Oil
 Sales (litres)                         300,000       350,000       428,030       653,030                   878,030
       Price per unit (Rp)                3,500         3,735         3,985         4,252                     4,537
             Total                1,050,000,000 1,307,075,000 1,705,577,271 2,776,480,561             3,983,228,556
    % of Revenue                         31.98%        26.45%        26.17%        31.73%                    35.37%
Spiritus
 Sales (litres)                         58,240       120,120       182,000       236,600                    291,200
       Price per unit (Rp)              10,000        10,670        11,385        12,148                     12,962
             Total                 582,400,000 1,281,680,400 2,072,049,980 2,874,140,527              3,774,409,775
    % of Revenue                        17.74%        25.93%        31.79%        32.85%                     33.52%
CER from CDM Project
 Project AMS-II.G (tCO2/year)            1,722            3,552         5,382         6,997                   8,611
 Project AMS-I.G (tCO2/year)                              1,610         1,610         1,610                   1,610
 Project AMS-I.H (tCO2/year)                                620           755         1,153                   1,547
       Price per tCO2/year (€)              17               17            17            17                      17
       Price per tCO2/year (Rp)        145,384          145,384       145,384       145,384                 145,384
             Total                 250,386,140      840,613,702 1,126,333,210 1,418,861,447           1,710,830,318
    % of Revenue                         7.63%           17.01%        17.28%        16.22%                  15.19%

Net Revenue                       3,283,344,080 4,942,014,392 6,517,952,984 8,750,057,782 11,261,642,439


                                     Revenues by Months & Quarters                                                                  Sales by Months & Quarters
                                                                                                                                                     Year 1                                     Year 2                                     Year 3                                     Year 4                                     Year 5
Months                                  Year 1              Year 2           Year 3         Year 4             Year 5                Protos    Jatropha   Used oil   Spiritus   Protos    Jatropha   Used oil   Spiritus   Protos    Jatropha   Used oil   Spiritus   Protos    Jatropha   Used oil   Spiritus   Protos    Jatropha   Used oil   Spiritus
Month 1                             252,746,495     341,783,391        449,301,648       610,933,028    795,901,010                      133     26,831    25,000      4,853        142     26,831    29,167     10,010        142     26,831    35,669     15,167        125     26,831    54,419     19,717        125     26,831    73,169     24,267
Month 2                             252,746,495     341,783,391        449,301,648       610,933,028    795,901,010                      133     26,831    25,000      4,853        142     26,831    29,167     10,010        142     26,831    35,669     15,167        125     26,831    54,419     19,717        125     26,831    73,169     24,267
Month 3                             252,746,495     341,783,391        449,301,648       610,933,028    795,901,010                      133     26,831    25,000      4,853        142     26,831    29,167     10,010        142     26,831    35,669     15,167        125     26,831    54,419     19,717        125     26,831    73,169     24,267
     Total 1st Quarter              758,239,485   1,025,350,172      1,347,904,944     1,832,799,084  2,387,703,030                      400     80,492    75,000     14,560        425     80,492    87,500     30,030        425     80,492   107,008     45,500        375     80,492   163,258     59,150        375     80,492   219,508     72,800
Month 4                             252,746,495     341,783,391        449,301,648       610,933,028    795,901,010                      133     26,831    25,000      4,853        142     26,831    29,167     10,010        142     26,831    35,669     15,167        125     26,831    54,419     19,717        125     26,831    73,169     24,267
Month 5                             252,746,495     341,783,391        449,301,648       610,933,028    795,901,010                      133     26,831    25,000      4,853        142     26,831    29,167     10,010        142     26,831    35,669     15,167        125     26,831    54,419     19,717        125     26,831    73,169     24,267
Month 6                             252,746,495     341,783,391        449,301,648       610,933,028    795,901,010                      133     26,831    25,000      4,853        142     26,831    29,167     10,010        142     26,831    35,669     15,167        125     26,831    54,419     19,717        125     26,831    73,169     24,267
     Total 2nd Quarter              758,239,485   1,025,350,172      1,347,904,944     1,832,799,084  2,387,703,030                      400     80,492    75,000     14,560        425     80,492    87,500     30,030        425     80,492   107,008     45,500        375     80,492   163,258     59,150        375     80,492   219,508     72,800
Month 7                             252,746,495     341,783,391        449,301,648       610,933,028    795,901,010                      133     26,831    25,000      4,853        142     26,831    29,167     10,010        142     26,831    35,669     15,167        125     26,831    54,419     19,717        125     26,831    73,169     24,267
Month 8                             252,746,495     341,783,391        449,301,648       610,933,028    795,901,010                      133     26,831    25,000      4,853        142     26,831    29,167     10,010        142     26,831    35,669     15,167        125     26,831    54,419     19,717        125     26,831    73,169     24,267
Month 9                             252,746,495     341,783,391        449,301,648       610,933,028    795,901,010                      133     26,831    25,000      4,853        142     26,831    29,167     10,010        142     26,831    35,669     15,167        125     26,831    54,419     19,717        125     26,831    73,169     24,267
     Total 3rd Quarter              758,239,485   1,025,350,172      1,347,904,944     1,832,799,084  2,387,703,030                      400     80,492    75,000     14,560        425     80,492    87,500     30,030        425     80,492   107,008     45,500        375     80,492   163,258     59,150        375     80,492   219,508     72,800
Month 10                            252,746,495     341,783,391        449,301,648       610,933,028    795,901,010                      133     26,831    25,000      4,853        142     26,831    29,167     10,010        142     26,831    35,669     15,167        125     26,831    54,419     19,717        125     26,831    73,169     24,267
Month 11                            252,746,495     341,783,391        449,301,648       610,933,028    795,901,010                      133     26,831    25,000      4,853        142     26,831    29,167     10,010        142     26,831    35,669     15,167        125     26,831    54,419     19,717        125     26,831    73,169     24,267
Month 12                            503,132,635   1,182,397,093      1,575,634,858     2,029,794,475  2,506,731,329                      133     26,831    25,000      4,853        142     26,831    29,167     10,010        142     26,831    35,669     15,167        125     26,831    54,419     19,717        125     26,831    73,169     24,267
     Total 4th Quarter            1,008,625,625   1,865,963,875      2,474,238,154     3,251,660,531  4,098,533,349                      400     80,492    75,000     14,560        425     80,492    87,500     30,030        425     80,492   107,008     45,500        375     80,492   163,258     59,150        375     80,492   219,508     72,800
            Total for year        3,283,344,080   4,942,014,392      6,517,952,984     8,750,057,782 11,261,642,439                    1,600    321,970   300,000     58,240      1,700    321,970   350,000    120,120      1,700    321,970   428,030    182,000      1,500    321,970   653,030    236,600      1,500    321,970   878,030    291,200
                                              0               0                  0                 0              0                   Unit       Litres    Litres     Litres     Unit       Litres    Litres     Litres     Unit       Litres    Litres     Litres     Unit       Litres    Litres     Litres     Unit       Litres    Litres     Litres
Average Revenue
     by Month                      273,612,007   411,834,533   543,162,749   729,171,482                938,470,203
     by Quarter                    820,836,020 1,235,503,598 1,629,488,246 2,187,514,446              2,815,410,610
05-10-12
Biokraftstoffe                                                    1 $                      =                               8,552 Rp                    Notes   11:37 AM
Cost of Revenues                                                      inflasi              =                               6.70%
Years 1 to 5                                                                       1.00 =                      $            1.48
(Rp)                                                                               1.00 =                                12,657 Rp
                                                            Year 1              Year 2               Year 3              Year 4             Year 5

Revenue                                               3,283,344,080      4,942,014,392         6,517,952,984       8,750,057,782    11,261,642,439

Cost of Revenue

Protos                                                                                                                                                         42,760
   COGM per Unit ($)                                            50                  53                    57                  61                 65
   COGM per Unit (Rp)                                      427,600             456,249               486,818             519,435            554,237
   Discount for retail/cooperative ($)                           2                   2                     2                   2                  3
   Discount for retail/cooperative (Rp)                     17,104              18,250                19,473              20,777             22,169
   Subsidy for user per Unit ($)                                15                  16                    17                  18                 19
   Subsidy for user per Unit (Rp)                          128,280             136,875               146,045             155,830            166,271
   Transportation cost per unit                                200                 213                   228                   0                  0
      Total Direct Costs per Unit (Rp)                     573,184             611,587               652,564             696,042            742,677
      Unit Sales                                             1,600               1,700                 1,700               1,500              1,500
      Total Direct Costs                               917,094,400       1,039,698,458         1,109,358,254       1,044,063,738      1,114,016,008
   % of Revenue                                             27.93%              21.04%                17.02%              11.93%              9.89%
   Gross margin                                              -235%               -235%                 -235%               -235%              -235%

Jatropha Oil
   Price of Jatropha seed from partner                           0                    0                   0                   0                  0
   Processing & Transportation Cost per unit                 1,500                1,601               1,708               1,822              1,944
      Total Direct Costs per Unit                            1,500                1,601               1,708               1,822              1,944
      Unit Sales                                           321,970              321,970             321,970             321,970            321,970
      Total Direct Costs                               482,954,545          515,312,500         549,838,438         586,677,613        625,985,013
    % of Revenue                                            14.71%               10.43%               8.44%               6.70%              5.56%
    Gross margin                                            57.14%               57.14%              57.14%              57.14%             57.14%

Used Oil
  Price of Used Oil from source                               1400                 1494                1594                 1701               1815
  Transportation cost from source                               200                  213                 228                  243                259
  Distribution cost to buyer & consumen                         200                  213                 228                  243                259
  Filtering cost                                                 10                   11                  11                   12                 13
      Total Direct Costs per Unit                             1810                 1931                2061                 2199               2346
      Unit Sales                                           300,000              350,000             428,030              653,030            878,030
      Total Direct Costs                               543,000,000          675,944,500         882,027,103        1,435,837,090      2,059,898,196
   % of Revenue                                             16.54%               13.68%              13.53%               16.41%             18.29%
   Gross margin                                             48.29%               48.29%              48.29%               48.29%             48.29%

Spiritus
   Price from supplier                                       9,500              10,137                10,816              11,540             12,313
   Distribution cost                                           200                 213                   228                 243                259
       Total Direct Costs per Unit                           9,700              10,350                11,043              11,783             12,573
       Unit Sales                                           58,240             120,120               182,000             236,600            291,200
       Total Direct Costs                              564,928,000       1,243,229,988         2,009,888,481       2,787,916,311      3,661,177,482
    % of Revenue                                            17.21%              25.16%                30.84%              31.86%             32.51%
    Gross margin                                             3.00%               3.00%                 3.00%               3.00%              3.00%

CDM Project
  Auditor fee ($)                                                               20,000                20,000              20,000             20,000
  Auditor fee (Rp)                                                         171,040,000           171,040,000         171,040,000        171,040,000
     Total CDM Project Cost                                       0        171,040,000           171,040,000         171,040,000        171,040,000
  All other costs % of Revenue                 0.5%      16,416,720         24,710,072            32,589,765          43,750,289         56,308,212
  Total Cost of Revenues                              2,524,393,666      3,669,935,518         4,754,742,040       6,069,285,041      7,688,424,912
  % of Revenue                                                76.9%              74.3%                 72.9%               69.4%              68.3%


                                                      Cost of Revenues by Months & Quarters
                                                                      (Rp)
                                                           Year 1        Year 2       Year 3                             Year 4             Year 5
Month 1                                                 194,323,725        253,808,044           327,758,337         423,760,252        543,368,801
Month 2                                                 194,323,725        253,808,044           327,758,337         423,760,252        543,368,801
Month 3                                                 194,323,725        253,808,044           327,758,337         423,760,252        543,368,801
  Total 1st Quarter                                     582,971,174        761,424,131           983,275,012       1,271,280,755      1,630,106,404
Month 4                                                 194,323,725        253,808,044           327,758,337         423,760,252        543,368,801
Month 5                                                 194,323,725        253,808,044           327,758,337         423,760,252        543,368,801
Month 6                                                 194,323,725        253,808,044           327,758,337         423,760,252        543,368,801
  Total 2nd Quarter                                     582,971,174        761,424,131           983,275,012       1,271,280,755      1,630,106,404
Month 7                                                 194,323,725        253,808,044           327,758,337         423,760,252        543,368,801
Month 8                                                 194,323,725        253,808,044           327,758,337         423,760,252        543,368,801
Month 9                                                 194,323,725        253,808,044           327,758,337         423,760,252        543,368,801
  Total 3rd Quarter                                     582,971,174        761,424,131           983,275,012       1,271,280,755      1,630,106,404
Month 10                                                194,323,725        253,808,044           327,758,337         423,760,252        543,368,801
Month 11                                                194,323,725        253,808,044           327,758,337         423,760,252        543,368,801
Month 12                                                386,832,694        878,047,036         1,149,400,328       1,407,922,273      1,711,368,097
  Total 4th Quarter                                     775,480,144      1,385,663,123         1,804,917,003       2,255,442,776      2,798,105,700
     Total for year                                   2,524,393,666      3,669,935,518         4,754,742,040       6,069,285,041      7,688,424,912
05-10-12
Biokraftstoffe                                              1 $                    =                          8,552 Rp                 Notes                                                                                                                            11:37 AM
Operating Expenses                                              inflasi          =                            6.70%
Years 1 to 5                                                                1.00 =                   $         1.48
(Rp)                                                                        1.00 =                           12,657 Rp
                                                      Year 1              Year 2           Year 3            Year 4          Year 5

Net Revenues                                    3,283,344,080   4,942,014,392      6,517,952,984     8,750,057,782 11,261,642,439                              Activities            Year 1                 Year 2                    Year 3            Year 4      Year 5
                                                                                                                                                 Promotion Activities              58,293,360                    60,693,360           60,693,360      #########   #########
Sales & Marketing                                                                                                                                Marketing tools                    2,940,000                     2,940,000             2,940,000     2,940,000   2,940,000
    Drivers                                                                                                                                      Training for Trainers                900,000                       900,000               900,000       900,000     900,000
         Salaries and Benefits                   118,800,000      126,759,600          135,252,493       144,314,410     153,983,476             Total                             62,133,360                    64,533,360           64,533,360      #########   #########
         Commissions % of Revenue       5.00%    164,167,204      247,100,720          325,897,649       437,502,889     563,082,122
         Promotion Activities                     58,293,360       60,693,360           60,693,360        55,893,360      55,893,360
         Marketing Tools                           2,940,000        2,940,000            2,940,000         2,940,000       2,940,000
         Training for Trainer                        900,000          900,000              900,000           900,000         900,000
    Total Sales and Marketing                    345,100,564      438,393,680          525,683,502       641,550,659     776,798,958
        % of Revenue                                   10.5%             8.9%                 8.1%              7.3%            6.9%

General, Operational & Administration
   Drivers                                                                                                                                       Promotion Activity                                      YEAR 1
         Salaries and Benefits                   423,450,000      451,821,150          490,802,608       523,686,383     568,688,973                          Program                Period     Target buyers (per period)     Target buyers (year)    Jumlah
         Depreciation                             64,141,414        5,808,081            8,087,121        10,366,162      10,366,162             Bundling system                  Every month              84                         1008
         Rent Office                              60,000,000       64,020,000           68,309,340        72,886,066      77,769,432 #########   With Regular promotion                                                                               #########
         Utilities                                12,000,000       12,804,000           13,661,868        14,577,213      15,553,886             Cooking competition             Every 6 month             25                          50             2,000,000
   Total General,Op & Administration             559,591,414      534,453,231          580,860,937       621,515,823     672,378,453             Food bazaar in Independence day  Once a year              50                          50             4,300,000
       % of Revenue                                    17.0%            10.8%                 8.9%              7.1%            6.0%             Microfinance program            Every 4 month            132                         396             9,504,000
                                                                                                                                                 Membership                       Every month               3                          36               630,000
    All other expenses % of Revenue     0.50%     16,416,720       24,710,072         32,589,765        43,750,289        56,308,212             Member get Member                Every month               5                          60             1,539,360
Total Operating Expenses                         921,108,699      997,556,982      1,139,134,204     1,306,816,771     1,505,485,623                                   TOTAL NUMBER OF BUYERS YEAR 1                              1600 buyers         #########
        % of Revenue                                   28.1%               20.2%            17.5%             14.9%           13.4%                                                                        YEAR 2
                                                                                                                                                              Program                Period       Target buyers (per period)   Target buyers (year)    Jumlah
Allocation of Operating Expenses between:                                                                                                        Bundling system                  Every month                84                        1008           #########
Variable                                         781,127,284      911,084,902 1,045,235,875 1,205,147,331              1,397,956,143             With Regular promotion
          % of Total Operating Expense                85.16%           91.68%        92.07%        92.49%                     93.09%             Cooking competition             Every 6 month                25                        50            2,000,000
Fixed                                            136,141,414       82,632,081    90,058,329    97,829,441                103,689,480             Food bazaar in Independence day  Once a year                 50                        50            4,300,000
          % of Total Operating Expense                14.84%            8.32%         7.93%         7.51%                      6.91%             Microfinance program            Every 4 month               165                       496            #########
     Total                                       917,268,699      993,716,982 1,135,294,204 1,302,976,771              1,501,645,623             Membership                       Every month                  3                        36              630,000
                                                                                                                                                 Member get Member                Every month                  5                        60            1,539,360
                                                                                                                                                  TOTAL NUMBER OF BUYERS YEAR
                                                                                                                                                                                                                                  1700 buyers
                                                                                                                                                                  2                                                                                   #########
Sales & Marketing by Months & Quarters                                                                                            YEAR 3                                                 05-10-12
                                                                                                                                                                                                                             11:37 AM
                                                     (Rp)                                                               Program                Period        Target buyers (per period)   Target buyers (year)    Jumlah
                                          Year 1       Year 2      Year 3           Year 4        Year 5    Bundling system                  Every month                84                       1008            #########
Month 1                                26,565,281    30,318,746    36,236,908    44,793,360    54,899,192   With Regular promotion
Month 2                                26,565,281    30,318,746    36,236,908    44,793,360    54,899,192   Cooking competition             Every 6 month                25                        50            2,000,000
Month 3                                26,565,281    30,318,746    36,236,908    44,793,360    54,899,192   Food bazaar in Independence day  Once a year                 50                        50            4,300,000
    Total 1st Quarter                  79,695,843    90,956,238   108,710,725   134,380,080   164,697,577   Microfinance program            Every 4 month               165                       496            #########
Month 4                                26,565,281    30,318,746    36,236,908    44,793,360    54,899,192   Membership                       Every month                  3                        36              630,000
Month 5                                26,565,281    30,318,746    36,236,908    44,793,360    54,899,192   Member get Member                Every month                  5                        60            1,539,360
                                                                                                             TOTAL NUMBER OF BUYERS YEAR
                                                                                                                                                                                             1700 buyers
Month 6                                26,565,281    30,318,746    36,236,908    44,793,360    54,899,192                    3                                                                                   #########
    Total 2nd Quarter                  79,695,843    90,956,238   108,710,725   134,380,080   164,697,577                                                   YEAR 4
Month 7                                26,565,281    30,318,746    36,236,908    44,793,360    54,899,192                Program                Period       Target buyers (per period)   Target buyers (year)    Jumlah
Month 8                                26,565,281    30,318,746    36,236,908    44,793,360    54,899,192   Bundling system                  Every month                84                        1008           #########
Month 9                                26,565,281    30,318,746    36,236,908    44,793,360    54,899,192   With Regular promotion
    Total 3rd Quarter                  79,695,843    90,956,238   108,710,725   134,380,080   164,697,577   Cooking competition             Every 6 month               25                         50            2,000,000
Month 10                               26,565,281    30,318,746    36,236,908    44,793,360    54,899,192   Food bazaar in Independence day  Once a year                50                         50            4,300,000
Month 11                               26,565,281    30,318,746    36,236,908    44,793,360    54,899,192   Microfinance program            Every 4 month               98                        296            7,104,000
Month 12                               52,882,473   104,887,475   127,077,512   148,823,701   172,907,841   Membership                       Every month                 3                         36              630,000
    Total 4th Quarter                 106,013,035   165,524,967   199,551,329   238,410,421   282,706,226   Member get Member                Every month                 5                         60            1,539,360
                                                                                                             TOTAL NUMBER OF BUYERS YEAR
                                                                                                                                                                                             1500 buyers
         Total for year               345,100,564   438,393,680   525,683,502   641,550,659   776,798,958                    3                                                                                   #########
                                                                                                                                                            YEAR 5
                                                                                                                         Program                Period       Target buyers (per period)   Target buyers (year)    Jumlah
                          General,Operational and Administrative by Months & Quarters                       Bundling system                  Every month                84                        1008           #########
                                                     (Rp)                                                   With Regular promotion
                                          Year 1       Year 2       Year 3      Year 4            Year 5    Cooking competition             Every 6 month               25                         50            2,000,000
Month 1                                43,076,438    36,962,101    40,040,451    43,394,518    47,519,418   Food bazaar in Independence day  Once a year                50                         50            4,300,000
Month 2                                43,076,438    36,962,101    40,040,451    43,394,518    47,519,418   Microfinance program            Every 4 month               98                        296            7,104,000
Month 3                                43,076,438    36,962,101    40,040,451    43,394,518    47,519,418   Membership                       Every month                 3                         36              630,000
    Total 1st Quarter                 129,229,315   110,886,304   120,121,353   130,183,555   142,558,253   Member get Member                Every month                 5                         60            1,539,360
                                                                                                             TOTAL NUMBER OF BUYERS YEAR
                                                                                                                                                                                             1500 buyers
Month 4                                43,076,438    36,962,101    40,040,451    43,394,518    47,519,418                    3                                                                                   #########
Month 5                                43,076,438    36,962,101    40,040,451    43,394,518    47,519,418
Month 6                                43,076,438    36,962,101    40,040,451    43,394,518    47,519,418
    Total 2nd Quarter                 129,229,315   110,886,304   120,121,353   130,183,555   142,558,253
Month 7                                43,076,438    36,962,101    40,040,451    43,394,518    47,519,418
Month 8                                43,076,438    36,962,101    40,040,451    43,394,518    47,519,418
Month 9                                43,076,438    36,962,101    40,040,451    43,394,518    47,519,418
    Total 3rd Quarter                 129,229,315   110,886,304   120,121,353   130,183,555   142,558,253
Month 10                               43,076,438    36,962,101    40,040,451    43,394,518    47,519,418
Month 11                               43,076,438    36,962,101    40,040,451    43,394,518    47,519,418
Month 12                               85,750,593   127,870,115   140,415,978   144,176,120   149,664,859
    Total 4th Quarter                 171,903,470   201,794,318   220,496,879   230,965,157   244,703,695
         Total for year               559,591,414   534,453,231   580,860,937   621,515,823   672,378,453
05-10-12
Biokraftstoffe                            1 $                    =                           8,552 Rp                 Notes   11:37 AM
Personnel                                     inflasi            =                           6.70%
Years 1 to 5                                              1.00 =                   $          1.48
(Rp)                                                      1.00 =                           12,657 Rp
                                    Year 1              Year 2           Year 3            Year 4           Year 5

Net Revenues                   3,283,344,080 4,942,014,392 6,517,952,984 8,750,057,782 11,261,642,439

Sales & Marketing
  Marketing Manager              36,000,000      38,412,000           40,985,604        43,731,639       46,661,659
  Customer service                9,000,000       9,603,000           10,246,401        10,932,910       11,665,415
  Tech support                   18,000,000      19,206,000           20,492,802        21,865,820       23,330,830
  Sales Person                   45,000,000      48,015,000           51,232,005        54,664,549       58,327,074
    Total Salary                108,000,000     115,236,000          122,956,812       131,194,918      139,984,978
  Benefits
  Percent (%)                           10%             10%                  10%               10%              10%
    Total benefit costs          10,800,000      11,523,600           12,295,681        13,119,492       13,998,498
 Total S & M Compensation       118,800,000     126,759,600          135,252,493       144,314,410      153,983,476
   % of Revenue                        3.6%            2.6%                 2.1%              1.6%             1.4%


General & Administration
  Chief Executive Officer        48,000,000      51,216,000           54,647,472        58,308,853       62,215,546
  Chief Financial Officer        36,000,000      38,412,000           40,985,604        43,731,639       46,661,659
  HR Manager                     36,000,000      38,412,000           40,985,604        43,731,639       46,661,659
  HR Staff                       21,000,000      22,407,000           23,908,269        25,510,123       27,219,301
  Accounting                     42,000,000      44,814,000           47,816,538        51,020,246       54,438,603
  Clerks and admin personnel     42,000,000      44,814,000           47,816,538        51,020,246       54,438,603
     Total Salary               225,000,000     240,075,000          256,160,025       273,322,747      291,635,371
  Benefits
  Percent (%)                           10%             10%                  10%               10%              10%
     Total benefit costs         22,500,000      24,007,500           25,616,003        27,332,275       29,163,537
Total G & A Compensation        247,500,000     264,082,500          281,776,028       300,655,021      320,798,908
   % of Revenue                        7.5%            5.3%                 4.3%              3.4%             2.8%
Cost of Revenue                                                                                     05-10-12
  Operational                                                                                      11:37 AM
     Operations Manager       36,000,000    38,412,000    40,985,604    43,731,639    46,661,659
     Staff                    63,000,000    67,221,000    71,724,807    76,530,369    81,657,904
     Labor                    54,000,000    57,618,000    61,478,406    65,597,459    69,992,489
       Total Salary          153,000,000   163,251,000   174,188,817   185,859,468   198,312,052
     Benefits
     Percent (%)                     15%           15%           20%           20%           25%
       Total benefit costs    22,950,000    24,487,650    34,837,763    37,171,894    49,578,013
     Total Salary Costs      175,950,000   187,738,650   209,026,580   223,031,361   247,890,065
Total COR's Compensation     175,950,000   187,738,650   209,026,580   223,031,361   247,890,065
   % of Revenue                     5.4%          3.8%          3.2%          2.5%          2.2%

Total Salary & Wages         486,000,000   518,562,000   553,305,654   590,377,133   629,932,401
Total Benefits                56,250,000    60,018,750    72,749,447    77,623,660    92,740,048
Total Compensation           542,250,000   578,580,750   626,055,101   668,000,793   722,672,449
   % of Revenue                    16.5%         11.7%          9.6%          7.6%          6.4%
05-10-12
Biokraftstoffe                                  1 $                       =                                8,552 Rp                    Notes AM
                                                                                                                                        11:37
Taxes                                                inflasi              =                                6.70%
Years 1 to 5                                                      1.00 =                       $            1.48
(Rp)                                                              1.00 =                                 12,657 Rp
                                          Year 1               Year 2               Year 3               Year 4             Year 5

Net Revenues                        3,283,344,080       4,942,014,392         6,517,952,984        8,750,057,782    11,261,642,439

Income Tax (Rate Federal & State)            10%                  10%                  10%                  10%                10%

Net Earnings Before Taxes            (190,007,469)         263,175,051         616,092,524         1,369,737,893      2,067,731,904
  Cumulative                         (190,007,469)          73,167,581         689,260,105         2,058,997,998      4,126,729,902

Taxes                                           0          (26,317,505)         (61,609,252)        (136,973,789)      (206,773,190)
 Percent of Revenues                         0.0%                -0.5%                -0.9%                -1.6%              -1.8%
05-10-12
Biokraftstoffe                                              1 $                   =                              8,552 Rp                             11:37 AM
Property and Equipment                                         inflasi            =                              6.70%
Years 1 to 5                                                               1.00 =                     $            1.48
(Rp)                                                                       1.00 =                               12,657 Rp
                                                      Year 0             Year 1             Year 2              Year 3          Year 4           Year 5
                                                Purchased
Net Revenues                                     Assets           3,283,344,080       4,942,014,392       6,517,952,984   8,750,057,782   11,261,642,439

Capital Expenditures
  Prepaid Rent of Depo & Office                   60,000,000
  Oil Drum (100 litre capacity)                   25,915,404         15,498,737         16,666,667          22,790,404       22,790,404
  Oil Galon (5 litre capacity)                    10,000,000
  Peeling Machine                                 20,000,000
  Filtering Machine                                5,000,000
  Press Machine                                   20,000,000
  Other Equipment                                  1,000,000
      Total Capital Expenditures                 141,915,404         15,498,737         16,666,667          22,790,404       22,790,404                0
       % of Revenue                                                        0.5%               0.3%                0.3%             0.3%             0.0%

Depreciation on Rent of Depo & Office (allocated to Cost of Revenue)
 Depreciation Rate: Years                                  1               1                     1                   1               1                1
 Year 0                                                           60,000,000                     0                   0               0                0
 Year 1                                                                    0                     0                   0               0                0
 Year 2                                                                                          0                   0               0                0
 Year 3                                                                                                              0               0                0
 Year 4                                                                                                                              0                0
 Year 5                                                                                                                                               0
   Total Depreciation                                             60,000,000                     0                   0               0                0

Depreciation Oil Drum and Depo Equipment (allocated to Cost of Revenue)
 Depreciation Rate: Years                               10              10                      10                  10               10              10
 Year 0                                                          2,591,540               2,591,540           2,591,540        2,591,540       2,591,540
 Year 1                                                          1,549,874               1,549,874           1,549,874        1,549,874       1,549,874
 Year 2                                                                                  1,666,667           1,666,667        1,666,667       1,666,667
 Year 3                                                                                                      2,279,040        2,279,040       2,279,040
 Year 4                                                                                                                       2,279,040       2,279,040
 Year 5                                                                                                                                               0
   Total Depreciation                                            4,141,414               5,808,081           8,087,121       10,366,162      10,366,162


Depreciation Office Utilities (allocated to General & Administrative Expenses)
 Depreciation Rate: Years                                   1                 1                  1                   1               1                1
 Year 0                                                               1,000,000                  0                   0               0                0
 Year 1                                                                       0                  0                   0               0                0
 Year 2                                                                                          0                   0               0                0
 Year 3                                                                                                              0               0                0
 Year 4                                                                                                                              0                0
 Year 5                                                                                                                                               0
   Total Depreciation                                                 1,000,000                  0                   0               0                0


Total Depreciation                                                   65,141,414          5,808,081           8,087,121       10,366,162      10,366,162
      % of Revenue                                                         2.0%               0.1%                0.1%             0.1%            0.1%

Property & Equipment
 Gross Asset Value                               141,915,404       157,414,141         174,080,808         196,871,212      219,661,616     219,661,616
 Accumulated Depreciation                                           65,141,414          70,949,495          79,036,616       89,402,778      99,768,939
    Net Property and Equipment                   141,915,404        92,272,727         103,131,313         117,834,596      130,258,838     119,892,677
     % of Revenue                                                         2.8%                2.1%                1.8%             1.5%            1.1%


                                                               Capital Expenditures by Months & Quarters
                                                                                  (Rp)
                                                                       Year 1       Year 2       Year 3                         Year 4           Year 5
Month 1                                                              15,498,737
Month 2
Month 3
  Total 1st Quarter                                                  15,498,737                  0                   0               0                0
Month 4
Month 5
Month 6
  Total 2nd Quarter                                                          0                   0                   0               0                0
Month 7
Month 8
Month 9
  Total 3rd Quarter                                                          0                   0                   0               0                0
Month 10
Month 11
Month 12
  Total 4th Quarter                                                          0                   0                   0               0                0
Total for year   15,498,737   0   0   0   05-10-12
                                           0
                                          11:37 AM
05-10-12
Notes   11:37 AM
05-10-12
Biokraftstoffe                                             1 $                           =                                     8,552 Rp                          Notes   11:37 AM
Working Capital                                                 inflasi                  =                                     6.70%
Years 1 to 5                                                                   1.00 =                             $             1.48
(Rp)                                                                           1.00 =                                         12,657 Rp
                                                   Year 1                   Year 2                   Year 3                   Year 4               Year 5
Net Revenues                               3,283,344,080           4,942,014,392             6,517,952,984            8,750,057,782        11,261,642,439


Accounts Receivable
  % of Revenue
  Days Outstanding                                          0                        0                        0                        0                     0
  Accounts Receivable                                      0                        0                        0                        0                     0
  (Increase)/Decrease from Prev. Period                    0                        0                        0                        0                     0

Inventory
   % of Revenue
   Inventory Turns                                          0                        0                        0                        0                     0
   Inventory Days                                           0                        0                        0                        0                     0
   Inventory                                               0                        0                        0                        0                     0
   (Increase)/Decrease from Prev. Period                   0                        0                        0                        0                     0

Other Current Assets
  % of Revenue
  Days                                                     0                        0                        0                        0                     0
  Other CA Value                                           0                        0                        0                        0                     0
  (Increase)/Decrease from Prev. Period                    0                        0                        0                        0                     0

Accounts Payable & Accrued Expenses
  % of Revenue
  Days                                                     0                        0                        0                        0                     0
  AP & Accrued Value                                       0                        0                        0                        0                     0
  Increase/(Decrease) from Prev. Period                    0                        0                        0                        0                     0

Other Current Liabilites
  % of Revenue                                       0.0%                      0.0%                    0.0%                     0.0%                  0.0%
  Days                                                  0                         0                       0                        0                     0
  Other Current Liabilities                             0                         0                       0                        0                     0
  Increase/(Decrease) from Prev. Period                 0                         0                       0                        0                     0

Net Working Capital                                        0                        0                        0                        0                     0

Revenues by Months & Quarters
                                                                          (Rp)
                                                   Year 1                    Year 2                  Year 3                   Year 4               Year 5
Month 1                                       252,746,495              341,783,391              449,301,648              610,933,028           795,901,010
Month 2                                       252,746,495              341,783,391              449,301,648              610,933,028           795,901,010
Month 3                                       252,746,495              341,783,391              449,301,648              610,933,028           795,901,010
  Total 1st Quarter                           758,239,485            1,025,350,172            1,347,904,944            1,832,799,084         2,387,703,030
Month 4                                       252,746,495              341,783,391              449,301,648              610,933,028           795,901,010
Month 5                                       252,746,495              341,783,391              449,301,648              610,933,028           795,901,010
Month 6                                       252,746,495              341,783,391              449,301,648              610,933,028           795,901,010
  Total 2nd Quarter                           758,239,485            1,025,350,172            1,347,904,944            1,832,799,084         2,387,703,030
Month 7                                       252,746,495              341,783,391              449,301,648              610,933,028           795,901,010
Month 8                                       252,746,495              341,783,391              449,301,648              610,933,028           795,901,010
Month 9                                       252,746,495              341,783,391              449,301,648              610,933,028           795,901,010
  Total 3rd Quarter                           758,239,485            1,025,350,172            1,347,904,944            1,832,799,084         2,387,703,030
Month 10                                      252,746,495              341,783,391              449,301,648              610,933,028           795,901,010
Month 11                                      252,746,495              341,783,391              449,301,648              610,933,028           795,901,010
Month 12                                      503,132,635            1,182,397,093            1,575,634,858            2,029,794,475         2,506,731,329
  Total 4th Quarter                         1,008,625,625            1,865,963,875            2,474,238,154            3,251,660,531         4,098,533,349
     Total for year                         3,283,344,080            4,942,014,392            6,517,952,984            8,750,057,782        11,261,642,439


Accounts Receivable by Months & Quarters
                                                                          (Rp)
                                                   Year 1                    Year 2                  Year 3                   Year 4               Year 5
Month 1                                               -                         -                       -                        -                     -
Month 2                                               -                         -                       -                        -                     -
Month 3                                               -                         -                       -                        -                     -
Month 4                                               -                         -                       -                        -                     -
Month 5                                               -                         -                       -                        -                     -
Month 6                                               -                         -                       -                        -                     -
Month 7                                               -                         -                       -                        -                     -
Month 8                                               -                         -                       -                        -                     -
Month 9                                               -                         -                       -                        -                     -
Month 10                                              -                         -                       -                        -                     -
Month 11                                              -                         -                       -                        -                     -
Month 12                                              -                         -                       -                        -                     -


Inventory by Months & Quarters
                                                                          (Rp)
                                                   Year 1                    Year 2                  Year 3                   Year 4               Year 5
Month 1                                               -                         -                       -                        -                     -
Month 2                                               -                         -                       -                        -                     -
Month 3                                               -                         -                       -                        -                     -
Month 4                                        -           -        -        -        -     05-10-12
Month 5                                        -           -        -        -        -     11:37 AM
Month 6                                        -           -        -        -        -
Month 7                                        -           -        -        -        -
Month 8                                        -           -        -        -        -
Month 9                                        -           -        -        -        -
Month 10                                       -           -        -        -        -
Month 11                                       -           -        -        -        -
Month 12                                       -           -        -        -        -


Other Current Assets by Months & Quarters
                                                     (Rp)
                                            Year 1      Year 2   Year 3   Year 4   Year 5
Month 1                                        -           -        -        -        -
Month 2                                        -           -        -        -        -
Month 3                                        -           -        -        -        -
Month 4                                        -           -        -        -        -
Month 5                                        -           -        -        -        -
Month 6                                        -           -        -        -        -
Month 7                                        -           -        -        -        -
Month 8                                        -           -        -        -        -
Month 9                                        -           -        -        -        -
Month 10                                       -           -        -        -        -
Month 11                                       -           -        -        -        -
Month 12                                       -           -        -        -        -
Accounts Payble & Accrued Expenses by Months & Quarters                                          05-10-12
                                                                                                 11:37 AM
                                                      (Rp)
                                          Year 1         Year 2       Year 3   Year 4   Year 5
Month 1                                             -           -        -        -        -
Month 2                                             -           -        -        -        -
Month 3                                             -           -        -        -        -
Month 4                                             -           -        -        -        -
Month 5                                             -           -        -        -        -
Month 6                                             -           -        -        -        -
Month 7                                             -           -        -        -        -
Month 8                                             -           -        -        -        -
Month 9                                             -           -        -        -        -
Month 10                                            -           -        -        -        -
Month 11                                            -           -        -        -        -
Month 12                                            -           -        -        -        -


Other Current Liabilities by Months & Quarters
                                                          (Rp)
                                                 Year 1      Year 2   Year 3   Year 4   Year 5
Month 1                                             -           -        -        -        -
Month 2                                             -           -        -        -        -
Month 3                                             -           -        -        -        -
Month 4                                             -           -        -        -        -
Month 5                                             -           -        -        -        -
Month 6                                             -           -        -        -        -
Month 7                                             -           -        -        -        -
Month 8                                             -           -        -        -        -
Month 9                                             -           -        -        -        -
Month 10                                            -           -        -        -        -
Month 11                                            -           -        -        -        -
Month 12                                            -           -        -        -        -
05-10-12
Biokraftstoffe                                        1 $                    =                             8,552 Rp
                                                                                                                                          11:37 AM
Funding Projections                                       inflasi            =                             6.70%
Years 1 to 5                                                          1.00 =                     $          1.48
(Rp)                                                                  1.00 =                             12,657 Rp
Property & Equipment
  Gross Asset Value                         141,915,404      157,414,141         174,080,808         196,871,212      219,661,616     219,661,616
  Accumulated Depreciation                                    65,141,414          70,949,495          79,036,616       89,402,778      99,768,939
  Net Property and Equipment                141,915,404       92,272,727         103,131,313         117,834,596      130,258,838     119,892,677
   % of Revenue                                                   12.42%              11.59%               7.66%            6.93%           5.48%

                                                 Begin              Year 1            Year 2             Year 3           Year 4           Year 5
Beginning Cash                               50,000,000
Equity
  Common                                     50,000,000        50,000,000         50,000,000          50,000,000       50,000,000      50,000,000
    Increase / (Decrease) Previous Period                               0                  0                   0                0               0
  Total Equity                               50,000,000        50,000,000         50,000,000          50,000,000       50,000,000      50,000,000

Debt
 Short Term Debt                                             150,000,000
    Increase / (Decrease) Previous Period                    150,000,000         (150,000,000)                 0                0                0

 Long Term Debt
   Current Portion                                            39,368,714          39,368,714          39,368,714       39,368,714      39,368,714
   Long Term Portion                        141,915,404      119,576,538          94,557,009          66,535,136       35,150,638               0
     Total Long Term Debt                   141,915,404      119,576,538          94,557,009          66,535,136       35,150,638               0

    Increase / (Decrease) Previous Period
      Current Portion                                                   0                   0                  0                0                0
      Long Term Portion                                       (22,338,866)        (25,019,530)       (28,021,873)     (31,384,498)     (35,150,638)
         Total Long Term Debt               141,915,404       (22,338,866)        (25,019,530)       (28,021,873)     (31,384,498)     (35,150,638)

Total Equity & Debt                         191,915,404      319,576,538         144,557,009         116,535,136       85,150,638      50,000,000

Partnership Contribution
BSH (European Charity Program)                             1,898,544,000
Indocement (Heidelberg Cement Group)
Shell Foundation (Indonesia)                949,272,000
         Total Partnership Contribution     949,272,000    1,898,544,000                    0                  0                0                0

Interest
   Interest Rate
      Short Term Debt                                                 9.0%               9.0%               9.0%             9.0%             9.0%
      Long Term Debt                                                 12.0%              12.0%              12.0%            12.0%            12.0%

  Interest Expense
     Short Term Debt                                           13,500,000                  0                   0                0                0
     Long Term Debt                                            14,349,185         11,346,841           7,984,216        4,218,077                0
     Total Interest                                            27,849,185         11,346,841           7,984,216        4,218,077                0

  Interest Income
     Interest Rate                                                    4.0%               4.0%               4.0%             4.0%             4.0%
     Interest Income                                                     0                  0                  0                0                0

Retained Earnings
  Net Income                                                (190,007,469)        236,857,546         554,483,271    1,232,764,104    1,860,958,714
  Dividends
  Increase / (Decrease) Retained Earnings                   (190,007,469)         236,857,546        554,483,271    1,232,764,104    1,860,958,714
  Beginning Retained Earnings                                          0         (190,007,469)        46,850,076      601,333,347    1,834,097,451
  Ending Retained Earnings                                  (190,007,469)          46,850,076        601,333,347    1,834,097,451    3,695,056,165


  Cost of Debt                                  21.00%
  Cost of Equity                                 0.00%
  Cost of Capital                               21.00%
05-10-12
Biokraftstoffe                                 1$                        =                                8,552 Rp
                                                                                                                            11:37 AM
Income Statement                                    inflasi              =                                6.70%
Years 1 to 5                                        €            1.00 =                       $            1.48
(Rp)                                                €            1.00 =                                 12,657 Rp
                                         Year 1               Year 2               Year 3               Year 4            Year 5

NET REVENUES                       3,283,344,080        4,942,014,392        6,517,952,984        8,750,057,782    11,261,642,439

COST OF REVENUE                    2,524,393,666        3,669,935,518        4,754,742,040        6,069,285,041     7,688,424,912
    % of Revenues                          76.9%                74.3%                72.9%                69.4%             68.3%

GROSS PROFIT                        758,950,414         1,272,078,874        1,763,210,944        2,680,772,741     3,573,217,527
    % of Revenues                         23.1%                 25.7%                27.1%                30.6%             31.7%

OPERATING EXPENSES
 Sales & Marketing                  345,100,564          438,393,680           525,683,502          641,550,659       776,798,958
 General and Administration         559,591,414          534,453,231           580,860,937          621,515,823       672,378,453
 All other expenses                  16,416,720           24,710,072            32,589,765           43,750,289        56,308,212
   Total Operating Expenses         921,108,699          997,556,982         1,139,134,204        1,306,816,771     1,505,485,623
      % of Revenues                      28.05%               20.19%                17.48%               14.93%            13.37%

EARNINGS BEFORE INTEREST & TAXES    (162,158,285)        274,521,892          624,076,740         1,373,955,970     2,067,731,904
INTEREST INCOME / (EXPENSE)          (27,849,185)        (11,346,841)          (7,984,216)           (4,218,077)               (0)

NET EARNINGS BEFORE TAXES           (190,007,469)        263,175,051          616,092,524         1,369,737,893     2,067,731,904

TAXES                                          0          (26,317,505)         (61,609,252)        (136,973,789)     (206,773,190)

NET EARNINGS                        (190,007,469)        236,857,546          554,483,271         1,232,764,104     1,860,958,714
     % of Revenues                         -5.8%                4.8%                 8.5%                 14.1%             16.5%
05-10-12
Biokraftstoffe                                  1$                            =                           8,552
                                                                                                                  11:37 AM
Balance Sheet                                       inflasi                   =                           6.70%
Years 1 to 5                                        €                 1.00 =                    $          1.48
(Rp)                                                €                 1.00 =                            12,657
                                          Begin                    Year 1             Year 2            Year 3

ASSETS
 CURRENT ASSETS
  Cash                                 50,000,000              37,296,342          88,275,772       600,033,887
  Accounts Receivable                                                   0                   0                 0
  Inventories                                                           0                   0                 0
  Other Current Assets                                                  0                   0                 0
    Total Current Assets               50,000,000              37,296,342          88,275,772       600,033,887
 PROPERTY & EQUIPMENT                 141,915,404              92,272,727         103,131,313       117,834,596
  TOTAL ASSETS                        191,915,404             129,569,069         191,407,085       717,868,483


LIABILITIES & SHAREHOLDERS' EQUITY
  CURRENT LIABILITIES
   Short Term Debt                             0              150,000,000                  0                 0
   Accounts Payable & Accrued Expen                                     0                  0                 0
   Other Current Liab                                                   0                  0                 0
     Total Current Liabilities                 0              150,000,000                  0                 0

 LONG TERM DEBT                       141,915,404             119,576,538          94,557,009        66,535,136

 STOCKHOLDERS' EQUITY
  Capital                              50,000,000               50,000,000         50,000,000        50,000,000
  Retained Earnings                                           (190,007,469)        46,850,076       601,333,347
  Total Equity                         50,000,000             (140,007,469)        96,850,076       651,333,347
  TOTAL LIABILITIES & EQUITY          191,915,404              129,569,069        191,407,085       717,868,483


                                               0                        0                  0                 0
05-10-12
Rp
                                     11:37 AM


Rp
           Year 4          Year 5


     1,788,989,250   3,625,163,488
                 0               0
                 0               0
                 0               0
     1,788,989,250   3,625,163,488
       130,258,838     119,892,677
     1,919,248,089   3,745,056,165


                0               0
                0               0
                0               0
                0               0

       35,150,638               0


        50,000,000      50,000,000
     1,834,097,451   3,695,056,165
     1,884,097,451   3,745,056,165
     1,919,248,089   3,745,056,165


                0               0
05-10-12
Biokraftstoffe                                                      1$                       =                             8,552 Rp
                                                                                                                                          11:37 AM
Cash Flow Statememt                                                      inflasi             =                             6.70%
Years 1 to 5                                                             €           1.00 =                      $          1.48
(Rp)                                                                     €           1.00 =                              12,657 Rp
                                                              Begin                Year 1             Year 2             Year 3           Year 4
OPERATING ACTIVITIES
 Net Earnings                                                                (190,007,469)       236,857,546         554,483,271    1,232,764,104
 Depreciation                                                                  65,141,414          5,808,081           8,087,121       10,366,162
 Working Capital Changes
  (Increase)/Decrease Accounts Receivable                                               0                  0                   0                0
  (Increase)/Decrease Inventories                                                       0                  0                   0                0
  (Increase)/Decrease Other Current Assets                                              0                  0                   0                0
  Increase/(Decrease) Accts Pay & Accrd Expenses                                        0                  0                   0                0
  Increase/(Decrease) Other Current Liab                                                0                  0                   0                0
    Net Cash Provided/(Used) by Operating Activities                         (124,866,055)       242,665,626         562,570,392    1,243,130,265

INVESTING ACTIVITIES
  Property & Equipment                                  (141,915,404)         (15,498,737)        (16,666,667)       (22,790,404)     (22,790,404)
  Initial Fee for CDM Project
   Project AMS-II.G                                     (949,272,000)
   Project AMS-I.G                                                       (949,272,000)
   Project AMS-I.H                                                       (949,272,000)
       Net Cash Used in Investing Activities           (1,091,187,404) (1,914,042,737)            (16,666,667)       (22,790,404)     (22,790,404)

FINANCING ACTIVITIES
  Increase/(Decrease) Short Term Debt                                       150,000,000          (150,000,000)                 0                0
  Increase/(Decrease) Long Term Debt                     141,915,404        (22,338,866)          (25,019,530)       (28,021,873)     (31,384,498)
  Increase/(Decrease) Owner's Capital                     50,000,000                  0                     0                  0                0
  Increase/(Decrease) Partnership Contribution           949,272,000      1,898,544,000                     0                  0                0
  Dividends Declared                                                                  0                     0                  0                0
      Net Cash Provided / (Used) by Financing          1,141,187,404      2,026,205,134          (175,019,530)       (28,021,873)     (31,384,498)

INCREASE/(DECREASE) IN CASH                               50,000,000          (12,703,658)        50,979,430         511,758,115    1,188,955,363

CASH AT BEGINNING OF YEAR                                                     50,000,000          37,296,342          88,275,772      600,033,887
CASH AT END OF YEAR                                       50,000,000          37,296,342          88,275,772         600,033,887    1,788,989,250


                                                       (1,091,187,404)       37,296,342           88,275,772         600,033,887    1,788,989,250
NPV                                                                       1,298,237,347
IRR                                                                                 49%
MIRR                                                                                41%
05-10-12
                 11:37 AM


      Year 5

1,860,958,714
   10,366,162

            0
            0
            0
            0
            0
1,871,324,875


            0


            0


            0
  (35,150,638)
            0
            0
            0
  (35,150,638)

1,836,174,238

1,788,989,250
3,625,163,488


3,625,163,488
Team 16 business plan submission (financial appendix)

Mais conteúdo relacionado

Mais procurados

Green supply led_lights_for now and future
Green supply led_lights_for now and futureGreen supply led_lights_for now and future
Green supply led_lights_for now and futureGreenSupply
 
I 3 practical implementation of clean coal technologies j pacyna nilu
I   3 practical implementation of clean coal technologies j pacyna niluI   3 practical implementation of clean coal technologies j pacyna nilu
I 3 practical implementation of clean coal technologies j pacyna niluInnovation Norway
 
Oneida led t8 led tube
Oneida led t8 led tubeOneida led t8 led tube
Oneida led t8 led tube13moons
 
LED FLP VESSEL LAMP PDF
LED FLP VESSEL LAMP PDFLED FLP VESSEL LAMP PDF
LED FLP VESSEL LAMP PDFILS
 
Led soffit lighting remote phosphor technology
Led soffit lighting remote phosphor technologyLed soffit lighting remote phosphor technology
Led soffit lighting remote phosphor technologySteven Talbot
 
7x24 Exchange 2011 National Fall Conference
7x24 Exchange 2011 National Fall Conference7x24 Exchange 2011 National Fall Conference
7x24 Exchange 2011 National Fall ConferenceJames Grice
 
Product Knowledge Bienirit
Product Knowledge BieniritProduct Knowledge Bienirit
Product Knowledge BieniritDedi Mukhlas
 
Daylight romanoski 2010
Daylight romanoski 2010Daylight romanoski 2010
Daylight romanoski 2010Archicon
 
spectra energy Qtr107Margin
spectra energy Qtr107Marginspectra energy Qtr107Margin
spectra energy Qtr107Marginfinance49
 
Inudction lamp www.suole cn.com
Inudction lamp www.suole cn.comInudction lamp www.suole cn.com
Inudction lamp www.suole cn.comjijie86
 
ETA’s needs assessment on energy and waste solutions in Nairobi slums
ETA’s needs assessment on energy and waste solutions in Nairobi slumsETA’s needs assessment on energy and waste solutions in Nairobi slums
ETA’s needs assessment on energy and waste solutions in Nairobi slumsNaoto Shibui
 
Biofuels Solutions For Ag Machinery - Peter Pickel
Biofuels Solutions For Ag Machinery - Peter PickelBiofuels Solutions For Ag Machinery - Peter Pickel
Biofuels Solutions For Ag Machinery - Peter PickelBioMotion Tour
 
Ao mi shan marketing plan
Ao mi shan marketing planAo mi shan marketing plan
Ao mi shan marketing planEnchantonemst
 
Mo Ti Presentation
Mo Ti PresentationMo Ti Presentation
Mo Ti Presentationxingjun78
 
Shir technology april 2013
Shir technology april 2013Shir technology april 2013
Shir technology april 2013PilarCocera
 
Ao mi shan marketing plan
Ao mi shan marketing planAo mi shan marketing plan
Ao mi shan marketing planEnchantonemst
 

Mais procurados (19)

Green supply led_lights_for now and future
Green supply led_lights_for now and futureGreen supply led_lights_for now and future
Green supply led_lights_for now and future
 
I 3 practical implementation of clean coal technologies j pacyna nilu
I   3 practical implementation of clean coal technologies j pacyna niluI   3 practical implementation of clean coal technologies j pacyna nilu
I 3 practical implementation of clean coal technologies j pacyna nilu
 
Oneida led t8 led tube
Oneida led t8 led tubeOneida led t8 led tube
Oneida led t8 led tube
 
Session 27 ic2011 marinescu
Session 27 ic2011 marinescuSession 27 ic2011 marinescu
Session 27 ic2011 marinescu
 
Energy Efficiency at the Farm Level
Energy Efficiency at the Farm LevelEnergy Efficiency at the Farm Level
Energy Efficiency at the Farm Level
 
LED FLP VESSEL LAMP PDF
LED FLP VESSEL LAMP PDFLED FLP VESSEL LAMP PDF
LED FLP VESSEL LAMP PDF
 
Led soffit lighting remote phosphor technology
Led soffit lighting remote phosphor technologyLed soffit lighting remote phosphor technology
Led soffit lighting remote phosphor technology
 
7x24 Exchange 2011 National Fall Conference
7x24 Exchange 2011 National Fall Conference7x24 Exchange 2011 National Fall Conference
7x24 Exchange 2011 National Fall Conference
 
Product Knowledge Bienirit
Product Knowledge BieniritProduct Knowledge Bienirit
Product Knowledge Bienirit
 
Daylight romanoski 2010
Daylight romanoski 2010Daylight romanoski 2010
Daylight romanoski 2010
 
spectra energy Qtr107Margin
spectra energy Qtr107Marginspectra energy Qtr107Margin
spectra energy Qtr107Margin
 
Inudction lamp www.suole cn.com
Inudction lamp www.suole cn.comInudction lamp www.suole cn.com
Inudction lamp www.suole cn.com
 
ETA’s needs assessment on energy and waste solutions in Nairobi slums
ETA’s needs assessment on energy and waste solutions in Nairobi slumsETA’s needs assessment on energy and waste solutions in Nairobi slums
ETA’s needs assessment on energy and waste solutions in Nairobi slums
 
Led exchange program
Led exchange program Led exchange program
Led exchange program
 
Biofuels Solutions For Ag Machinery - Peter Pickel
Biofuels Solutions For Ag Machinery - Peter PickelBiofuels Solutions For Ag Machinery - Peter Pickel
Biofuels Solutions For Ag Machinery - Peter Pickel
 
Ao mi shan marketing plan
Ao mi shan marketing planAo mi shan marketing plan
Ao mi shan marketing plan
 
Mo Ti Presentation
Mo Ti PresentationMo Ti Presentation
Mo Ti Presentation
 
Shir technology april 2013
Shir technology april 2013Shir technology april 2013
Shir technology april 2013
 
Ao mi shan marketing plan
Ao mi shan marketing planAo mi shan marketing plan
Ao mi shan marketing plan
 

Destaque

Business model canvas ism
Business model canvas ismBusiness model canvas ism
Business model canvas ismIskandar Muda
 
Team 16 business plan submission
Team 16 business plan submissionTeam 16 business plan submission
Team 16 business plan submissionIskandar Muda
 
Presentation @germany
Presentation @germanyPresentation @germany
Presentation @germanyIskandar Muda
 
Blue bird group group 5
Blue bird group group 5Blue bird group group 5
Blue bird group group 5Iskandar Muda
 
Project management grand presentation
Project management grand presentationProject management grand presentation
Project management grand presentationIskandar Muda
 
Privatisasi bukan solusi dalam membenahi bumn di indonesia
Privatisasi bukan solusi dalam membenahi bumn di indonesiaPrivatisasi bukan solusi dalam membenahi bumn di indonesia
Privatisasi bukan solusi dalam membenahi bumn di indonesiaIskandar Muda
 
Pt. angkasa pura 1 the analyst final_280610
Pt. angkasa pura 1 the analyst final_280610Pt. angkasa pura 1 the analyst final_280610
Pt. angkasa pura 1 the analyst final_280610Iskandar Muda
 
Change management pt.pos indonesia
Change management pt.pos indonesiaChange management pt.pos indonesia
Change management pt.pos indonesiaIskandar Muda
 

Destaque (15)

Business model canvas ism
Business model canvas ismBusiness model canvas ism
Business model canvas ism
 
Team 16 business plan submission
Team 16 business plan submissionTeam 16 business plan submission
Team 16 business plan submission
 
Presentation @germany
Presentation @germanyPresentation @germany
Presentation @germany
 
Gcg pt pos
Gcg pt posGcg pt pos
Gcg pt pos
 
Blue bird group group 5
Blue bird group group 5Blue bird group group 5
Blue bird group group 5
 
Pt kai kelompok 5
Pt kai kelompok 5Pt kai kelompok 5
Pt kai kelompok 5
 
Callaway golf co.
Callaway golf co.Callaway golf co.
Callaway golf co.
 
Project management grand presentation
Project management grand presentationProject management grand presentation
Project management grand presentation
 
Grand paper cis
Grand paper cisGrand paper cis
Grand paper cis
 
Privatisasi bukan solusi dalam membenahi bumn di indonesia
Privatisasi bukan solusi dalam membenahi bumn di indonesiaPrivatisasi bukan solusi dalam membenahi bumn di indonesia
Privatisasi bukan solusi dalam membenahi bumn di indonesia
 
Nyonya meneer final
Nyonya meneer finalNyonya meneer final
Nyonya meneer final
 
Ymki the analyst
Ymki the analystYmki the analyst
Ymki the analyst
 
Pt. angkasa pura 1 the analyst final_280610
Pt. angkasa pura 1 the analyst final_280610Pt. angkasa pura 1 the analyst final_280610
Pt. angkasa pura 1 the analyst final_280610
 
Callaway golf co.
Callaway golf co.Callaway golf co.
Callaway golf co.
 
Change management pt.pos indonesia
Change management pt.pos indonesiaChange management pt.pos indonesia
Change management pt.pos indonesia
 

Semelhante a Team 16 business plan submission (financial appendix)

The power of solar residential_11.28
The power of solar residential_11.28The power of solar residential_11.28
The power of solar residential_11.28Antonio Ciampa LLC.
 
Horse Manure Composting Economics Example
Horse Manure Composting Economics ExampleHorse Manure Composting Economics Example
Horse Manure Composting Economics ExampleLPE Learning Center
 
Performing A Life Cycle Cost Analysis
Performing A Life Cycle Cost AnalysisPerforming A Life Cycle Cost Analysis
Performing A Life Cycle Cost Analysischrishvaceng
 
Pe Insights Presentation (Syd) Aug09
Pe   Insights Presentation (Syd)   Aug09Pe   Insights Presentation (Syd)   Aug09
Pe Insights Presentation (Syd) Aug09peben
 
Solar Pv Payback
Solar Pv PaybackSolar Pv Payback
Solar Pv PaybackJussi Han
 
Jpg Comptoir 1 Year One
Jpg Comptoir 1 Year OneJpg Comptoir 1 Year One
Jpg Comptoir 1 Year Oneguestf8a979
 
Exercises chapter 2 Energy, environment and climate second edition
Exercises chapter 2 Energy, environment and climate second editionExercises chapter 2 Energy, environment and climate second edition
Exercises chapter 2 Energy, environment and climate second editionAditya Wibawa
 
Sanctuary Belize BioMass Energy Proof of Concept
Sanctuary Belize BioMass Energy Proof of ConceptSanctuary Belize BioMass Energy Proof of Concept
Sanctuary Belize BioMass Energy Proof of Conceptecologicalfox
 
6 Keys systems with Cost Benefit
6 Keys systems  with Cost Benefit6 Keys systems  with Cost Benefit
6 Keys systems with Cost BenefitCarlRoberts
 
LED Lighting Presentation_102009
LED Lighting Presentation_102009LED Lighting Presentation_102009
LED Lighting Presentation_102009wpprenosil
 
Combustion of Poultry Litter: A Comparison of Using Litter for On-Farm Space ...
Combustion of Poultry Litter: A Comparison of Using Litter for On-Farm Space ...Combustion of Poultry Litter: A Comparison of Using Litter for On-Farm Space ...
Combustion of Poultry Litter: A Comparison of Using Litter for On-Farm Space ...LPE Learning Center
 
Latest eco render cost comparision 1
Latest eco render cost comparision 1Latest eco render cost comparision 1
Latest eco render cost comparision 1greenbuildproducts
 

Semelhante a Team 16 business plan submission (financial appendix) (20)

The power of solar residential_11.28
The power of solar residential_11.28The power of solar residential_11.28
The power of solar residential_11.28
 
Horse Manure Composting Economics Example
Horse Manure Composting Economics ExampleHorse Manure Composting Economics Example
Horse Manure Composting Economics Example
 
Lowering the Cost of Heating Your Home
Lowering the Cost of Heating Your HomeLowering the Cost of Heating Your Home
Lowering the Cost of Heating Your Home
 
Performing A Life Cycle Cost Analysis
Performing A Life Cycle Cost AnalysisPerforming A Life Cycle Cost Analysis
Performing A Life Cycle Cost Analysis
 
Why Go Green?
Why Go Green?Why Go Green?
Why Go Green?
 
Marketing Solar for Agricultural Users
Marketing Solar for Agricultural UsersMarketing Solar for Agricultural Users
Marketing Solar for Agricultural Users
 
Pe Insights Presentation (Syd) Aug09
Pe   Insights Presentation (Syd)   Aug09Pe   Insights Presentation (Syd)   Aug09
Pe Insights Presentation (Syd) Aug09
 
Bleaching of oil
Bleaching of oilBleaching of oil
Bleaching of oil
 
Bleaching of oil
Bleaching of oilBleaching of oil
Bleaching of oil
 
Solar Pv Payback
Solar Pv PaybackSolar Pv Payback
Solar Pv Payback
 
Case Study_Ramesh Flowers
Case Study_Ramesh FlowersCase Study_Ramesh Flowers
Case Study_Ramesh Flowers
 
Jpg Comptoir 1 Year One
Jpg Comptoir 1 Year OneJpg Comptoir 1 Year One
Jpg Comptoir 1 Year One
 
Mustard Hybrids
Mustard HybridsMustard Hybrids
Mustard Hybrids
 
Exercises chapter 2 Energy, environment and climate second edition
Exercises chapter 2 Energy, environment and climate second editionExercises chapter 2 Energy, environment and climate second edition
Exercises chapter 2 Energy, environment and climate second edition
 
Sanctuary Belize BioMass Energy Proof of Concept
Sanctuary Belize BioMass Energy Proof of ConceptSanctuary Belize BioMass Energy Proof of Concept
Sanctuary Belize BioMass Energy Proof of Concept
 
6 Keys systems with Cost Benefit
6 Keys systems  with Cost Benefit6 Keys systems  with Cost Benefit
6 Keys systems with Cost Benefit
 
LED Lighting Presentation_102009
LED Lighting Presentation_102009LED Lighting Presentation_102009
LED Lighting Presentation_102009
 
Rural Renewable Energy Alliance (RREAL)
Rural Renewable Energy Alliance (RREAL)Rural Renewable Energy Alliance (RREAL)
Rural Renewable Energy Alliance (RREAL)
 
Combustion of Poultry Litter: A Comparison of Using Litter for On-Farm Space ...
Combustion of Poultry Litter: A Comparison of Using Litter for On-Farm Space ...Combustion of Poultry Litter: A Comparison of Using Litter for On-Farm Space ...
Combustion of Poultry Litter: A Comparison of Using Litter for On-Farm Space ...
 
Latest eco render cost comparision 1
Latest eco render cost comparision 1Latest eco render cost comparision 1
Latest eco render cost comparision 1
 

Mais de Iskandar Muda

Brosur PPDB 2023 MTs_230131_163055.pdf
Brosur PPDB 2023 MTs_230131_163055.pdfBrosur PPDB 2023 MTs_230131_163055.pdf
Brosur PPDB 2023 MTs_230131_163055.pdfIskandar Muda
 
Tugas Beer Game - Wholesaler (Kelompok 1 Salemba 2022).pptx
Tugas Beer Game - Wholesaler (Kelompok 1 Salemba 2022).pptxTugas Beer Game - Wholesaler (Kelompok 1 Salemba 2022).pptx
Tugas Beer Game - Wholesaler (Kelompok 1 Salemba 2022).pptxIskandar Muda
 
Kelompok 15 - Manajemen Operasi Suzuki Inazuma.pptx
Kelompok 15 - Manajemen Operasi Suzuki Inazuma.pptxKelompok 15 - Manajemen Operasi Suzuki Inazuma.pptx
Kelompok 15 - Manajemen Operasi Suzuki Inazuma.pptxIskandar Muda
 
Kelompok 15 - Manajemen Operasi Suzuki Inazuma_rev Ismud.pptx
Kelompok 15 - Manajemen Operasi Suzuki Inazuma_rev Ismud.pptxKelompok 15 - Manajemen Operasi Suzuki Inazuma_rev Ismud.pptx
Kelompok 15 - Manajemen Operasi Suzuki Inazuma_rev Ismud.pptxIskandar Muda
 
KELOMPOK 1_A02_BEER GAME (1).pptx
KELOMPOK 1_A02_BEER GAME (1).pptxKELOMPOK 1_A02_BEER GAME (1).pptx
KELOMPOK 1_A02_BEER GAME (1).pptxIskandar Muda
 
Pojok pintar ppm 19 agustus 2020 rev
Pojok pintar ppm 19 agustus 2020 revPojok pintar ppm 19 agustus 2020 rev
Pojok pintar ppm 19 agustus 2020 revIskandar Muda
 
First Seven Tools of Quality Improvement_imu rev 4 april 2014
First Seven Tools of Quality Improvement_imu rev 4 april 2014First Seven Tools of Quality Improvement_imu rev 4 april 2014
First Seven Tools of Quality Improvement_imu rev 4 april 2014Iskandar Muda
 
Project management grand presentation
Project management grand presentationProject management grand presentation
Project management grand presentationIskandar Muda
 
Carrefour presentasi pkpt
Carrefour presentasi pkptCarrefour presentasi pkpt
Carrefour presentasi pkptIskandar Muda
 
Change management pt.kai
Change management pt.kaiChange management pt.kai
Change management pt.kaiIskandar Muda
 
Meneer kel 5 presentasistrategic
Meneer kel 5 presentasistrategicMeneer kel 5 presentasistrategic
Meneer kel 5 presentasistrategicIskandar Muda
 
Sistem informasi manajemen produksi
Sistem informasi manajemen produksiSistem informasi manajemen produksi
Sistem informasi manajemen produksiIskandar Muda
 
Privatisasi gcg dan kinerja bumn
Privatisasi gcg dan kinerja  bumnPrivatisasi gcg dan kinerja  bumn
Privatisasi gcg dan kinerja bumnIskandar Muda
 
Privatisasi bukan solusi dalam membenahi bumn di indonesia
Privatisasi bukan solusi dalam membenahi bumn di indonesiaPrivatisasi bukan solusi dalam membenahi bumn di indonesia
Privatisasi bukan solusi dalam membenahi bumn di indonesiaIskandar Muda
 

Mais de Iskandar Muda (20)

Brosur PPDB 2023 MTs_230131_163055.pdf
Brosur PPDB 2023 MTs_230131_163055.pdfBrosur PPDB 2023 MTs_230131_163055.pdf
Brosur PPDB 2023 MTs_230131_163055.pdf
 
Layout TP GMF.pptx
Layout TP GMF.pptxLayout TP GMF.pptx
Layout TP GMF.pptx
 
Tugas Beer Game - Wholesaler (Kelompok 1 Salemba 2022).pptx
Tugas Beer Game - Wholesaler (Kelompok 1 Salemba 2022).pptxTugas Beer Game - Wholesaler (Kelompok 1 Salemba 2022).pptx
Tugas Beer Game - Wholesaler (Kelompok 1 Salemba 2022).pptx
 
Kelompok 15 - Manajemen Operasi Suzuki Inazuma.pptx
Kelompok 15 - Manajemen Operasi Suzuki Inazuma.pptxKelompok 15 - Manajemen Operasi Suzuki Inazuma.pptx
Kelompok 15 - Manajemen Operasi Suzuki Inazuma.pptx
 
Kelompok 15 - Manajemen Operasi Suzuki Inazuma_rev Ismud.pptx
Kelompok 15 - Manajemen Operasi Suzuki Inazuma_rev Ismud.pptxKelompok 15 - Manajemen Operasi Suzuki Inazuma_rev Ismud.pptx
Kelompok 15 - Manajemen Operasi Suzuki Inazuma_rev Ismud.pptx
 
KELOMPOK 1_A02_BEER GAME (1).pptx
KELOMPOK 1_A02_BEER GAME (1).pptxKELOMPOK 1_A02_BEER GAME (1).pptx
KELOMPOK 1_A02_BEER GAME (1).pptx
 
Pojok pintar ppm 19 agustus 2020 rev
Pojok pintar ppm 19 agustus 2020 revPojok pintar ppm 19 agustus 2020 rev
Pojok pintar ppm 19 agustus 2020 rev
 
CV
CVCV
CV
 
Innovation Campaign
Innovation CampaignInnovation Campaign
Innovation Campaign
 
First 7 tools imu
First 7 tools imuFirst 7 tools imu
First 7 tools imu
 
First Seven Tools of Quality Improvement_imu rev 4 april 2014
First Seven Tools of Quality Improvement_imu rev 4 april 2014First Seven Tools of Quality Improvement_imu rev 4 april 2014
First Seven Tools of Quality Improvement_imu rev 4 april 2014
 
Angkasa pura i
Angkasa pura iAngkasa pura i
Angkasa pura i
 
Project management grand presentation
Project management grand presentationProject management grand presentation
Project management grand presentation
 
Carrefour presentasi pkpt
Carrefour presentasi pkptCarrefour presentasi pkpt
Carrefour presentasi pkpt
 
Change management pt.kai
Change management pt.kaiChange management pt.kai
Change management pt.kai
 
Meneer kel 5 presentasistrategic
Meneer kel 5 presentasistrategicMeneer kel 5 presentasistrategic
Meneer kel 5 presentasistrategic
 
Sistem informasi manajemen produksi
Sistem informasi manajemen produksiSistem informasi manajemen produksi
Sistem informasi manajemen produksi
 
Grand paper cis
Grand paper cisGrand paper cis
Grand paper cis
 
Privatisasi gcg dan kinerja bumn
Privatisasi gcg dan kinerja  bumnPrivatisasi gcg dan kinerja  bumn
Privatisasi gcg dan kinerja bumn
 
Privatisasi bukan solusi dalam membenahi bumn di indonesia
Privatisasi bukan solusi dalam membenahi bumn di indonesiaPrivatisasi bukan solusi dalam membenahi bumn di indonesia
Privatisasi bukan solusi dalam membenahi bumn di indonesia
 

Último

Catalogue ONG NUOC PPR DE NHAT .pdf
Catalogue ONG NUOC PPR DE NHAT      .pdfCatalogue ONG NUOC PPR DE NHAT      .pdf
Catalogue ONG NUOC PPR DE NHAT .pdfOrient Homes
 
GD Birla and his contribution in management
GD Birla and his contribution in managementGD Birla and his contribution in management
GD Birla and his contribution in managementchhavia330
 
Cash Payment 9602870969 Escort Service in Udaipur Call Girls
Cash Payment 9602870969 Escort Service in Udaipur Call GirlsCash Payment 9602870969 Escort Service in Udaipur Call Girls
Cash Payment 9602870969 Escort Service in Udaipur Call GirlsApsara Of India
 
VIP Call Girl Jamshedpur Aashi 8250192130 Independent Escort Service Jamshedpur
VIP Call Girl Jamshedpur Aashi 8250192130 Independent Escort Service JamshedpurVIP Call Girl Jamshedpur Aashi 8250192130 Independent Escort Service Jamshedpur
VIP Call Girl Jamshedpur Aashi 8250192130 Independent Escort Service JamshedpurSuhani Kapoor
 
Enhancing and Restoring Safety & Quality Cultures - Dave Litwiller - May 2024...
Enhancing and Restoring Safety & Quality Cultures - Dave Litwiller - May 2024...Enhancing and Restoring Safety & Quality Cultures - Dave Litwiller - May 2024...
Enhancing and Restoring Safety & Quality Cultures - Dave Litwiller - May 2024...Dave Litwiller
 
0183760ssssssssssssssssssssssssssss00101011 (27).pdf
0183760ssssssssssssssssssssssssssss00101011 (27).pdf0183760ssssssssssssssssssssssssssss00101011 (27).pdf
0183760ssssssssssssssssssssssssssss00101011 (27).pdfRenandantas16
 
Keppel Ltd. 1Q 2024 Business Update Presentation Slides
Keppel Ltd. 1Q 2024 Business Update  Presentation SlidesKeppel Ltd. 1Q 2024 Business Update  Presentation Slides
Keppel Ltd. 1Q 2024 Business Update Presentation SlidesKeppelCorporation
 
Catalogue ONG NƯỚC uPVC - HDPE DE NHAT.pdf
Catalogue ONG NƯỚC uPVC - HDPE DE NHAT.pdfCatalogue ONG NƯỚC uPVC - HDPE DE NHAT.pdf
Catalogue ONG NƯỚC uPVC - HDPE DE NHAT.pdfOrient Homes
 
Tech Startup Growth Hacking 101 - Basics on Growth Marketing
Tech Startup Growth Hacking 101  - Basics on Growth MarketingTech Startup Growth Hacking 101  - Basics on Growth Marketing
Tech Startup Growth Hacking 101 - Basics on Growth MarketingShawn Pang
 
Pharma Works Profile of Karan Communications
Pharma Works Profile of Karan CommunicationsPharma Works Profile of Karan Communications
Pharma Works Profile of Karan Communicationskarancommunications
 
Call Girls In Panjim North Goa 9971646499 Genuine Service
Call Girls In Panjim North Goa 9971646499 Genuine ServiceCall Girls In Panjim North Goa 9971646499 Genuine Service
Call Girls In Panjim North Goa 9971646499 Genuine Serviceritikaroy0888
 
Insurers' journeys to build a mastery in the IoT usage
Insurers' journeys to build a mastery in the IoT usageInsurers' journeys to build a mastery in the IoT usage
Insurers' journeys to build a mastery in the IoT usageMatteo Carbone
 
Call Girls In DLf Gurgaon ➥99902@11544 ( Best price)100% Genuine Escort In 24...
Call Girls In DLf Gurgaon ➥99902@11544 ( Best price)100% Genuine Escort In 24...Call Girls In DLf Gurgaon ➥99902@11544 ( Best price)100% Genuine Escort In 24...
Call Girls In DLf Gurgaon ➥99902@11544 ( Best price)100% Genuine Escort In 24...lizamodels9
 
Monthly Social Media Update April 2024 pptx.pptx
Monthly Social Media Update April 2024 pptx.pptxMonthly Social Media Update April 2024 pptx.pptx
Monthly Social Media Update April 2024 pptx.pptxAndy Lambert
 
A DAY IN THE LIFE OF A SALESMAN / WOMAN
A DAY IN THE LIFE OF A  SALESMAN / WOMANA DAY IN THE LIFE OF A  SALESMAN / WOMAN
A DAY IN THE LIFE OF A SALESMAN / WOMANIlamathiKannappan
 
Creating Low-Code Loan Applications using the Trisotech Mortgage Feature Set
Creating Low-Code Loan Applications using the Trisotech Mortgage Feature SetCreating Low-Code Loan Applications using the Trisotech Mortgage Feature Set
Creating Low-Code Loan Applications using the Trisotech Mortgage Feature SetDenis Gagné
 
MONA 98765-12871 CALL GIRLS IN LUDHIANA LUDHIANA CALL GIRL
MONA 98765-12871 CALL GIRLS IN LUDHIANA LUDHIANA CALL GIRLMONA 98765-12871 CALL GIRLS IN LUDHIANA LUDHIANA CALL GIRL
MONA 98765-12871 CALL GIRLS IN LUDHIANA LUDHIANA CALL GIRLSeo
 
Grateful 7 speech thanking everyone that has helped.pdf
Grateful 7 speech thanking everyone that has helped.pdfGrateful 7 speech thanking everyone that has helped.pdf
Grateful 7 speech thanking everyone that has helped.pdfPaul Menig
 
Vip Dewas Call Girls #9907093804 Contact Number Escorts Service Dewas
Vip Dewas Call Girls #9907093804 Contact Number Escorts Service DewasVip Dewas Call Girls #9907093804 Contact Number Escorts Service Dewas
Vip Dewas Call Girls #9907093804 Contact Number Escorts Service Dewasmakika9823
 

Último (20)

Catalogue ONG NUOC PPR DE NHAT .pdf
Catalogue ONG NUOC PPR DE NHAT      .pdfCatalogue ONG NUOC PPR DE NHAT      .pdf
Catalogue ONG NUOC PPR DE NHAT .pdf
 
GD Birla and his contribution in management
GD Birla and his contribution in managementGD Birla and his contribution in management
GD Birla and his contribution in management
 
Cash Payment 9602870969 Escort Service in Udaipur Call Girls
Cash Payment 9602870969 Escort Service in Udaipur Call GirlsCash Payment 9602870969 Escort Service in Udaipur Call Girls
Cash Payment 9602870969 Escort Service in Udaipur Call Girls
 
VIP Call Girl Jamshedpur Aashi 8250192130 Independent Escort Service Jamshedpur
VIP Call Girl Jamshedpur Aashi 8250192130 Independent Escort Service JamshedpurVIP Call Girl Jamshedpur Aashi 8250192130 Independent Escort Service Jamshedpur
VIP Call Girl Jamshedpur Aashi 8250192130 Independent Escort Service Jamshedpur
 
Enhancing and Restoring Safety & Quality Cultures - Dave Litwiller - May 2024...
Enhancing and Restoring Safety & Quality Cultures - Dave Litwiller - May 2024...Enhancing and Restoring Safety & Quality Cultures - Dave Litwiller - May 2024...
Enhancing and Restoring Safety & Quality Cultures - Dave Litwiller - May 2024...
 
0183760ssssssssssssssssssssssssssss00101011 (27).pdf
0183760ssssssssssssssssssssssssssss00101011 (27).pdf0183760ssssssssssssssssssssssssssss00101011 (27).pdf
0183760ssssssssssssssssssssssssssss00101011 (27).pdf
 
Keppel Ltd. 1Q 2024 Business Update Presentation Slides
Keppel Ltd. 1Q 2024 Business Update  Presentation SlidesKeppel Ltd. 1Q 2024 Business Update  Presentation Slides
Keppel Ltd. 1Q 2024 Business Update Presentation Slides
 
Catalogue ONG NƯỚC uPVC - HDPE DE NHAT.pdf
Catalogue ONG NƯỚC uPVC - HDPE DE NHAT.pdfCatalogue ONG NƯỚC uPVC - HDPE DE NHAT.pdf
Catalogue ONG NƯỚC uPVC - HDPE DE NHAT.pdf
 
Tech Startup Growth Hacking 101 - Basics on Growth Marketing
Tech Startup Growth Hacking 101  - Basics on Growth MarketingTech Startup Growth Hacking 101  - Basics on Growth Marketing
Tech Startup Growth Hacking 101 - Basics on Growth Marketing
 
Pharma Works Profile of Karan Communications
Pharma Works Profile of Karan CommunicationsPharma Works Profile of Karan Communications
Pharma Works Profile of Karan Communications
 
KestrelPro Flyer Japan IT Week 2024 (English)
KestrelPro Flyer Japan IT Week 2024 (English)KestrelPro Flyer Japan IT Week 2024 (English)
KestrelPro Flyer Japan IT Week 2024 (English)
 
Call Girls In Panjim North Goa 9971646499 Genuine Service
Call Girls In Panjim North Goa 9971646499 Genuine ServiceCall Girls In Panjim North Goa 9971646499 Genuine Service
Call Girls In Panjim North Goa 9971646499 Genuine Service
 
Insurers' journeys to build a mastery in the IoT usage
Insurers' journeys to build a mastery in the IoT usageInsurers' journeys to build a mastery in the IoT usage
Insurers' journeys to build a mastery in the IoT usage
 
Call Girls In DLf Gurgaon ➥99902@11544 ( Best price)100% Genuine Escort In 24...
Call Girls In DLf Gurgaon ➥99902@11544 ( Best price)100% Genuine Escort In 24...Call Girls In DLf Gurgaon ➥99902@11544 ( Best price)100% Genuine Escort In 24...
Call Girls In DLf Gurgaon ➥99902@11544 ( Best price)100% Genuine Escort In 24...
 
Monthly Social Media Update April 2024 pptx.pptx
Monthly Social Media Update April 2024 pptx.pptxMonthly Social Media Update April 2024 pptx.pptx
Monthly Social Media Update April 2024 pptx.pptx
 
A DAY IN THE LIFE OF A SALESMAN / WOMAN
A DAY IN THE LIFE OF A  SALESMAN / WOMANA DAY IN THE LIFE OF A  SALESMAN / WOMAN
A DAY IN THE LIFE OF A SALESMAN / WOMAN
 
Creating Low-Code Loan Applications using the Trisotech Mortgage Feature Set
Creating Low-Code Loan Applications using the Trisotech Mortgage Feature SetCreating Low-Code Loan Applications using the Trisotech Mortgage Feature Set
Creating Low-Code Loan Applications using the Trisotech Mortgage Feature Set
 
MONA 98765-12871 CALL GIRLS IN LUDHIANA LUDHIANA CALL GIRL
MONA 98765-12871 CALL GIRLS IN LUDHIANA LUDHIANA CALL GIRLMONA 98765-12871 CALL GIRLS IN LUDHIANA LUDHIANA CALL GIRL
MONA 98765-12871 CALL GIRLS IN LUDHIANA LUDHIANA CALL GIRL
 
Grateful 7 speech thanking everyone that has helped.pdf
Grateful 7 speech thanking everyone that has helped.pdfGrateful 7 speech thanking everyone that has helped.pdf
Grateful 7 speech thanking everyone that has helped.pdf
 
Vip Dewas Call Girls #9907093804 Contact Number Escorts Service Dewas
Vip Dewas Call Girls #9907093804 Contact Number Escorts Service DewasVip Dewas Call Girls #9907093804 Contact Number Escorts Service Dewas
Vip Dewas Call Girls #9907093804 Contact Number Escorts Service Dewas
 

Team 16 business plan submission (financial appendix)

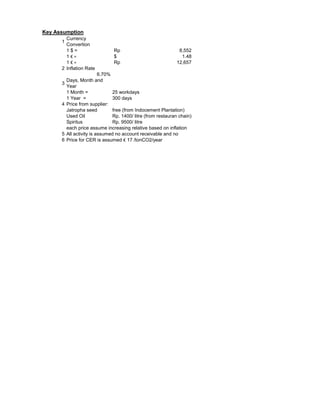
  • 1. Key Assumption Currency 1 Convertion 1$= Rp 8,552 1€= $ 1.48 1€= Rp 12,657 2 Inflation Rate 6.70% Days, Month and 3 Year 1 Month = 25 workdays 1 Year = 300 days 4 Price from supplier: Jatropha seed free (from Indocement Plantation) Used Oil Rp. 1400/ litre (from restauran chain) Spiritus Rp. 9500/ litre each price assume increasing relative based on inflation 5 All activity is assumed no account receivable and no 6 Price for CER is assumed € 17 /tonCO2/year
  • 2. 1$= Rp 8,552 1€= $ 1.48 1€= Rp 12,657 Initial Fee per CDM Project € 75,000 = $ 111,000 = 0 1 2 3 Baseline Emission 1,610 1,610 1,610 Project Emission 0 0 0 Leakage 0 0 0 Emission Reduction 1,610 1,610 1,610 Baseline emission Household 2,146 CO2 dari penggunaan minyak tanah per keluarga 0.75 ton/CO2 per year = 300 emission per year 1,610 ton CO2 Project Emission Luas lahan Jathropa 170 ha = 1,700,000 hasil per m2 0.19 liter/year Total hasil plant oil 321,970 liter/year Penggunaan per kepala keluarga per tahun 150 liter/year Jumlah kepala keluarga yang dapat disupplai 2,146 kepala keluarga Emission per year 0.00 kebutuhan untuk : 321,970 321,970 321,970 Protos User 1,600 3,300 5,000 6,500 Fuel Suplly needs 240,000 495,000 750,000 975,000 Used Oil needs 300,000 350,000 428,030 653,030 Spiritus requirement/week/household 0.7 litre Spiritus needs 58,240 120,120 182,000 236,600
  • 3. Rp 949,272,000 4 5 1,610 1,610 tonCO2 per year 0 0 tonCO2 per year 0 0 tonCO2 per year 1,610 1,610 tonCO2 per year lt/year m2 8,000 1,200,000 liter/year 878,030 liter/year 291,200 litre/year
  • 4. 1$= 1€= 1€= Initial Fee per CDM P ERy fNRB,y NCVbiomass EFprojected_fossil_fuel ƞold ƞnew HGpy Protos User By By,saving
  • 5. 1$= Rp 8,552 1€= $ 1.48 1€= Rp 12,657 Initial Fee per CDM Project € 75,000 = $ 111,000 = Rp 949,272,000 Year 0 1 2 3 4 ERy 1,722.24 3,552.12 5,382.00 6,996.60 fNRB,y 1.00 NCVbiomass 0.02 TJ/tonnes EFprojected_fossil_fuel 71.50 tCO2/TJ ƞold 0.35 25 lt plant oil = 0.23 ƞnew 0.55 HGpy 8,999.99 TJ 1 kwh = 3599,99 Protos User = 1,600 1,700 1,700 1,500 By = 4416.00 4692.00 4692.00 4140.00 By,saving = 1605.818 1706.181818 1706.182 1505.454545
  • 6. 5 8,611.20 tonnes woods TJ (2.5 Kwh) 1,500 tonnes 4140.00 tonnes 1505.454545 tonnes
  • 7. 1$= Rp 8,552 1€= $ 1.48 1€= Rp 12,657 Initial Fee per CDM Project € 75,000 0 Baseline Emission Project Emission Leakage Emission Reduction used oil 100 lt gassoline 1 lt biodiesel 1 lt used oil (100%) 1 lt Suplly needs Used oil Capacity Leakage: jarak ke majalengka dari citeureup (per hari) 120 Total jarak tempuh per tahun 36,000 gassoline Leakage from program 7
  • 8. = $ 111,000 = Rp 949,272,000 Year 1 2 3 4 5 690 805 984 1,502 2,019 tonCO2 per year 150 175 214 326 438 tonCO2 per year 7 10 15 23 35 tonCO2 per year 533 620 755 1,153 1,547 tonCO2 per year = 80 biodiesel (liters) = 2.3 kg CO2 = 0.4991 kg CO2 = 0 kg CO2 240,000 495,000 750,000 975,000 1,200,000 1,200,000 (Lt/year) 300,000 350,000 428,030 653,030 878,030 878,030 (Lt/year) km km 1 km = 0.19 kg CO2 ton CO2
  • 9. 05-10-12 Biokraftstoffe 1 $ = Rp 8,552 Rp N o t es 11:37 AM Revenue Projections inflasi = 6.70% Years 1 to 5 1.00 = $ 1.48 (Rp) 1.00 = 12,657 Rp Year 1 Year 2 Year 3 Year 4 Year 5 Protos Sales (unit) 1,600 1,700 1,700 1,500 1,500 Price per unit ($) 20 21 23 24 26 Price per unit (Rp) 171,040 182,500 194,727 207,774 221,695 Total 273,664,000 310,249,456 331,036,170 311,660,817 332,542,092 % of Revenue 8.33% 6.28% 5.08% 3.56% 2.95% Fuel (Jatropha Oil) Sales (litres) 321,970 321,970 321,970 321,970 321,970 Price per unit (Rp) 3,500 3,735 3,985 4,252 4,537 Total 1,126,893,939 1,202,395,833 1,282,956,354 1,368,914,430 1,460,631,697 % of Revenue 34.32% 24.33% 19.68% 15.64% 12.97% Used Oil Sales (litres) 300,000 350,000 428,030 653,030 878,030 Price per unit (Rp) 3,500 3,735 3,985 4,252 4,537 Total 1,050,000,000 1,307,075,000 1,705,577,271 2,776,480,561 3,983,228,556 % of Revenue 31.98% 26.45% 26.17% 31.73% 35.37% Spiritus Sales (litres) 58,240 120,120 182,000 236,600 291,200 Price per unit (Rp) 10,000 10,670 11,385 12,148 12,962 Total 582,400,000 1,281,680,400 2,072,049,980 2,874,140,527 3,774,409,775 % of Revenue 17.74% 25.93% 31.79% 32.85% 33.52% CER from CDM Project Project AMS-II.G (tCO2/year) 1,722 3,552 5,382 6,997 8,611 Project AMS-I.G (tCO2/year) 1,610 1,610 1,610 1,610 Project AMS-I.H (tCO2/year) 620 755 1,153 1,547 Price per tCO2/year (€) 17 17 17 17 17 Price per tCO2/year (Rp) 145,384 145,384 145,384 145,384 145,384 Total 250,386,140 840,613,702 1,126,333,210 1,418,861,447 1,710,830,318 % of Revenue 7.63% 17.01% 17.28% 16.22% 15.19% Net Revenue 3,283,344,080 4,942,014,392 6,517,952,984 8,750,057,782 11,261,642,439 Revenues by Months & Quarters Sales by Months & Quarters Year 1 Year 2 Year 3 Year 4 Year 5 Months Year 1 Year 2 Year 3 Year 4 Year 5 Protos Jatropha Used oil Spiritus Protos Jatropha Used oil Spiritus Protos Jatropha Used oil Spiritus Protos Jatropha Used oil Spiritus Protos Jatropha Used oil Spiritus Month 1 252,746,495 341,783,391 449,301,648 610,933,028 795,901,010 133 26,831 25,000 4,853 142 26,831 29,167 10,010 142 26,831 35,669 15,167 125 26,831 54,419 19,717 125 26,831 73,169 24,267 Month 2 252,746,495 341,783,391 449,301,648 610,933,028 795,901,010 133 26,831 25,000 4,853 142 26,831 29,167 10,010 142 26,831 35,669 15,167 125 26,831 54,419 19,717 125 26,831 73,169 24,267 Month 3 252,746,495 341,783,391 449,301,648 610,933,028 795,901,010 133 26,831 25,000 4,853 142 26,831 29,167 10,010 142 26,831 35,669 15,167 125 26,831 54,419 19,717 125 26,831 73,169 24,267 Total 1st Quarter 758,239,485 1,025,350,172 1,347,904,944 1,832,799,084 2,387,703,030 400 80,492 75,000 14,560 425 80,492 87,500 30,030 425 80,492 107,008 45,500 375 80,492 163,258 59,150 375 80,492 219,508 72,800 Month 4 252,746,495 341,783,391 449,301,648 610,933,028 795,901,010 133 26,831 25,000 4,853 142 26,831 29,167 10,010 142 26,831 35,669 15,167 125 26,831 54,419 19,717 125 26,831 73,169 24,267 Month 5 252,746,495 341,783,391 449,301,648 610,933,028 795,901,010 133 26,831 25,000 4,853 142 26,831 29,167 10,010 142 26,831 35,669 15,167 125 26,831 54,419 19,717 125 26,831 73,169 24,267 Month 6 252,746,495 341,783,391 449,301,648 610,933,028 795,901,010 133 26,831 25,000 4,853 142 26,831 29,167 10,010 142 26,831 35,669 15,167 125 26,831 54,419 19,717 125 26,831 73,169 24,267 Total 2nd Quarter 758,239,485 1,025,350,172 1,347,904,944 1,832,799,084 2,387,703,030 400 80,492 75,000 14,560 425 80,492 87,500 30,030 425 80,492 107,008 45,500 375 80,492 163,258 59,150 375 80,492 219,508 72,800 Month 7 252,746,495 341,783,391 449,301,648 610,933,028 795,901,010 133 26,831 25,000 4,853 142 26,831 29,167 10,010 142 26,831 35,669 15,167 125 26,831 54,419 19,717 125 26,831 73,169 24,267 Month 8 252,746,495 341,783,391 449,301,648 610,933,028 795,901,010 133 26,831 25,000 4,853 142 26,831 29,167 10,010 142 26,831 35,669 15,167 125 26,831 54,419 19,717 125 26,831 73,169 24,267 Month 9 252,746,495 341,783,391 449,301,648 610,933,028 795,901,010 133 26,831 25,000 4,853 142 26,831 29,167 10,010 142 26,831 35,669 15,167 125 26,831 54,419 19,717 125 26,831 73,169 24,267 Total 3rd Quarter 758,239,485 1,025,350,172 1,347,904,944 1,832,799,084 2,387,703,030 400 80,492 75,000 14,560 425 80,492 87,500 30,030 425 80,492 107,008 45,500 375 80,492 163,258 59,150 375 80,492 219,508 72,800 Month 10 252,746,495 341,783,391 449,301,648 610,933,028 795,901,010 133 26,831 25,000 4,853 142 26,831 29,167 10,010 142 26,831 35,669 15,167 125 26,831 54,419 19,717 125 26,831 73,169 24,267 Month 11 252,746,495 341,783,391 449,301,648 610,933,028 795,901,010 133 26,831 25,000 4,853 142 26,831 29,167 10,010 142 26,831 35,669 15,167 125 26,831 54,419 19,717 125 26,831 73,169 24,267 Month 12 503,132,635 1,182,397,093 1,575,634,858 2,029,794,475 2,506,731,329 133 26,831 25,000 4,853 142 26,831 29,167 10,010 142 26,831 35,669 15,167 125 26,831 54,419 19,717 125 26,831 73,169 24,267 Total 4th Quarter 1,008,625,625 1,865,963,875 2,474,238,154 3,251,660,531 4,098,533,349 400 80,492 75,000 14,560 425 80,492 87,500 30,030 425 80,492 107,008 45,500 375 80,492 163,258 59,150 375 80,492 219,508 72,800 Total for year 3,283,344,080 4,942,014,392 6,517,952,984 8,750,057,782 11,261,642,439 1,600 321,970 300,000 58,240 1,700 321,970 350,000 120,120 1,700 321,970 428,030 182,000 1,500 321,970 653,030 236,600 1,500 321,970 878,030 291,200 0 0 0 0 0 Unit Litres Litres Litres Unit Litres Litres Litres Unit Litres Litres Litres Unit Litres Litres Litres Unit Litres Litres Litres Average Revenue by Month 273,612,007 411,834,533 543,162,749 729,171,482 938,470,203 by Quarter 820,836,020 1,235,503,598 1,629,488,246 2,187,514,446 2,815,410,610
  • 10. 05-10-12 Biokraftstoffe 1 $ = 8,552 Rp Notes 11:37 AM Cost of Revenues inflasi = 6.70% Years 1 to 5 1.00 = $ 1.48 (Rp) 1.00 = 12,657 Rp Year 1 Year 2 Year 3 Year 4 Year 5 Revenue 3,283,344,080 4,942,014,392 6,517,952,984 8,750,057,782 11,261,642,439 Cost of Revenue Protos 42,760 COGM per Unit ($) 50 53 57 61 65 COGM per Unit (Rp) 427,600 456,249 486,818 519,435 554,237 Discount for retail/cooperative ($) 2 2 2 2 3 Discount for retail/cooperative (Rp) 17,104 18,250 19,473 20,777 22,169 Subsidy for user per Unit ($) 15 16 17 18 19 Subsidy for user per Unit (Rp) 128,280 136,875 146,045 155,830 166,271 Transportation cost per unit 200 213 228 0 0 Total Direct Costs per Unit (Rp) 573,184 611,587 652,564 696,042 742,677 Unit Sales 1,600 1,700 1,700 1,500 1,500 Total Direct Costs 917,094,400 1,039,698,458 1,109,358,254 1,044,063,738 1,114,016,008 % of Revenue 27.93% 21.04% 17.02% 11.93% 9.89% Gross margin -235% -235% -235% -235% -235% Jatropha Oil Price of Jatropha seed from partner 0 0 0 0 0 Processing & Transportation Cost per unit 1,500 1,601 1,708 1,822 1,944 Total Direct Costs per Unit 1,500 1,601 1,708 1,822 1,944 Unit Sales 321,970 321,970 321,970 321,970 321,970 Total Direct Costs 482,954,545 515,312,500 549,838,438 586,677,613 625,985,013 % of Revenue 14.71% 10.43% 8.44% 6.70% 5.56% Gross margin 57.14% 57.14% 57.14% 57.14% 57.14% Used Oil Price of Used Oil from source 1400 1494 1594 1701 1815 Transportation cost from source 200 213 228 243 259 Distribution cost to buyer & consumen 200 213 228 243 259 Filtering cost 10 11 11 12 13 Total Direct Costs per Unit 1810 1931 2061 2199 2346 Unit Sales 300,000 350,000 428,030 653,030 878,030 Total Direct Costs 543,000,000 675,944,500 882,027,103 1,435,837,090 2,059,898,196 % of Revenue 16.54% 13.68% 13.53% 16.41% 18.29% Gross margin 48.29% 48.29% 48.29% 48.29% 48.29% Spiritus Price from supplier 9,500 10,137 10,816 11,540 12,313 Distribution cost 200 213 228 243 259 Total Direct Costs per Unit 9,700 10,350 11,043 11,783 12,573 Unit Sales 58,240 120,120 182,000 236,600 291,200 Total Direct Costs 564,928,000 1,243,229,988 2,009,888,481 2,787,916,311 3,661,177,482 % of Revenue 17.21% 25.16% 30.84% 31.86% 32.51% Gross margin 3.00% 3.00% 3.00% 3.00% 3.00% CDM Project Auditor fee ($) 20,000 20,000 20,000 20,000 Auditor fee (Rp) 171,040,000 171,040,000 171,040,000 171,040,000 Total CDM Project Cost 0 171,040,000 171,040,000 171,040,000 171,040,000 All other costs % of Revenue 0.5% 16,416,720 24,710,072 32,589,765 43,750,289 56,308,212 Total Cost of Revenues 2,524,393,666 3,669,935,518 4,754,742,040 6,069,285,041 7,688,424,912 % of Revenue 76.9% 74.3% 72.9% 69.4% 68.3% Cost of Revenues by Months & Quarters (Rp) Year 1 Year 2 Year 3 Year 4 Year 5 Month 1 194,323,725 253,808,044 327,758,337 423,760,252 543,368,801 Month 2 194,323,725 253,808,044 327,758,337 423,760,252 543,368,801 Month 3 194,323,725 253,808,044 327,758,337 423,760,252 543,368,801 Total 1st Quarter 582,971,174 761,424,131 983,275,012 1,271,280,755 1,630,106,404 Month 4 194,323,725 253,808,044 327,758,337 423,760,252 543,368,801 Month 5 194,323,725 253,808,044 327,758,337 423,760,252 543,368,801 Month 6 194,323,725 253,808,044 327,758,337 423,760,252 543,368,801 Total 2nd Quarter 582,971,174 761,424,131 983,275,012 1,271,280,755 1,630,106,404 Month 7 194,323,725 253,808,044 327,758,337 423,760,252 543,368,801 Month 8 194,323,725 253,808,044 327,758,337 423,760,252 543,368,801 Month 9 194,323,725 253,808,044 327,758,337 423,760,252 543,368,801 Total 3rd Quarter 582,971,174 761,424,131 983,275,012 1,271,280,755 1,630,106,404 Month 10 194,323,725 253,808,044 327,758,337 423,760,252 543,368,801 Month 11 194,323,725 253,808,044 327,758,337 423,760,252 543,368,801 Month 12 386,832,694 878,047,036 1,149,400,328 1,407,922,273 1,711,368,097 Total 4th Quarter 775,480,144 1,385,663,123 1,804,917,003 2,255,442,776 2,798,105,700 Total for year 2,524,393,666 3,669,935,518 4,754,742,040 6,069,285,041 7,688,424,912
  • 11. 05-10-12 Biokraftstoffe 1 $ = 8,552 Rp Notes 11:37 AM Operating Expenses inflasi = 6.70% Years 1 to 5 1.00 = $ 1.48 (Rp) 1.00 = 12,657 Rp Year 1 Year 2 Year 3 Year 4 Year 5 Net Revenues 3,283,344,080 4,942,014,392 6,517,952,984 8,750,057,782 11,261,642,439 Activities Year 1 Year 2 Year 3 Year 4 Year 5 Promotion Activities 58,293,360 60,693,360 60,693,360 ######### ######### Sales & Marketing Marketing tools 2,940,000 2,940,000 2,940,000 2,940,000 2,940,000 Drivers Training for Trainers 900,000 900,000 900,000 900,000 900,000 Salaries and Benefits 118,800,000 126,759,600 135,252,493 144,314,410 153,983,476 Total 62,133,360 64,533,360 64,533,360 ######### ######### Commissions % of Revenue 5.00% 164,167,204 247,100,720 325,897,649 437,502,889 563,082,122 Promotion Activities 58,293,360 60,693,360 60,693,360 55,893,360 55,893,360 Marketing Tools 2,940,000 2,940,000 2,940,000 2,940,000 2,940,000 Training for Trainer 900,000 900,000 900,000 900,000 900,000 Total Sales and Marketing 345,100,564 438,393,680 525,683,502 641,550,659 776,798,958 % of Revenue 10.5% 8.9% 8.1% 7.3% 6.9% General, Operational & Administration Drivers Promotion Activity YEAR 1 Salaries and Benefits 423,450,000 451,821,150 490,802,608 523,686,383 568,688,973 Program Period Target buyers (per period) Target buyers (year) Jumlah Depreciation 64,141,414 5,808,081 8,087,121 10,366,162 10,366,162 Bundling system Every month 84 1008 Rent Office 60,000,000 64,020,000 68,309,340 72,886,066 77,769,432 ######### With Regular promotion ######### Utilities 12,000,000 12,804,000 13,661,868 14,577,213 15,553,886 Cooking competition Every 6 month 25 50 2,000,000 Total General,Op & Administration 559,591,414 534,453,231 580,860,937 621,515,823 672,378,453 Food bazaar in Independence day Once a year 50 50 4,300,000 % of Revenue 17.0% 10.8% 8.9% 7.1% 6.0% Microfinance program Every 4 month 132 396 9,504,000 Membership Every month 3 36 630,000 All other expenses % of Revenue 0.50% 16,416,720 24,710,072 32,589,765 43,750,289 56,308,212 Member get Member Every month 5 60 1,539,360 Total Operating Expenses 921,108,699 997,556,982 1,139,134,204 1,306,816,771 1,505,485,623 TOTAL NUMBER OF BUYERS YEAR 1 1600 buyers ######### % of Revenue 28.1% 20.2% 17.5% 14.9% 13.4% YEAR 2 Program Period Target buyers (per period) Target buyers (year) Jumlah Allocation of Operating Expenses between: Bundling system Every month 84 1008 ######### Variable 781,127,284 911,084,902 1,045,235,875 1,205,147,331 1,397,956,143 With Regular promotion % of Total Operating Expense 85.16% 91.68% 92.07% 92.49% 93.09% Cooking competition Every 6 month 25 50 2,000,000 Fixed 136,141,414 82,632,081 90,058,329 97,829,441 103,689,480 Food bazaar in Independence day Once a year 50 50 4,300,000 % of Total Operating Expense 14.84% 8.32% 7.93% 7.51% 6.91% Microfinance program Every 4 month 165 496 ######### Total 917,268,699 993,716,982 1,135,294,204 1,302,976,771 1,501,645,623 Membership Every month 3 36 630,000 Member get Member Every month 5 60 1,539,360 TOTAL NUMBER OF BUYERS YEAR 1700 buyers 2 #########
  • 12. Sales & Marketing by Months & Quarters YEAR 3 05-10-12 11:37 AM (Rp) Program Period Target buyers (per period) Target buyers (year) Jumlah Year 1 Year 2 Year 3 Year 4 Year 5 Bundling system Every month 84 1008 ######### Month 1 26,565,281 30,318,746 36,236,908 44,793,360 54,899,192 With Regular promotion Month 2 26,565,281 30,318,746 36,236,908 44,793,360 54,899,192 Cooking competition Every 6 month 25 50 2,000,000 Month 3 26,565,281 30,318,746 36,236,908 44,793,360 54,899,192 Food bazaar in Independence day Once a year 50 50 4,300,000 Total 1st Quarter 79,695,843 90,956,238 108,710,725 134,380,080 164,697,577 Microfinance program Every 4 month 165 496 ######### Month 4 26,565,281 30,318,746 36,236,908 44,793,360 54,899,192 Membership Every month 3 36 630,000 Month 5 26,565,281 30,318,746 36,236,908 44,793,360 54,899,192 Member get Member Every month 5 60 1,539,360 TOTAL NUMBER OF BUYERS YEAR 1700 buyers Month 6 26,565,281 30,318,746 36,236,908 44,793,360 54,899,192 3 ######### Total 2nd Quarter 79,695,843 90,956,238 108,710,725 134,380,080 164,697,577 YEAR 4 Month 7 26,565,281 30,318,746 36,236,908 44,793,360 54,899,192 Program Period Target buyers (per period) Target buyers (year) Jumlah Month 8 26,565,281 30,318,746 36,236,908 44,793,360 54,899,192 Bundling system Every month 84 1008 ######### Month 9 26,565,281 30,318,746 36,236,908 44,793,360 54,899,192 With Regular promotion Total 3rd Quarter 79,695,843 90,956,238 108,710,725 134,380,080 164,697,577 Cooking competition Every 6 month 25 50 2,000,000 Month 10 26,565,281 30,318,746 36,236,908 44,793,360 54,899,192 Food bazaar in Independence day Once a year 50 50 4,300,000 Month 11 26,565,281 30,318,746 36,236,908 44,793,360 54,899,192 Microfinance program Every 4 month 98 296 7,104,000 Month 12 52,882,473 104,887,475 127,077,512 148,823,701 172,907,841 Membership Every month 3 36 630,000 Total 4th Quarter 106,013,035 165,524,967 199,551,329 238,410,421 282,706,226 Member get Member Every month 5 60 1,539,360 TOTAL NUMBER OF BUYERS YEAR 1500 buyers Total for year 345,100,564 438,393,680 525,683,502 641,550,659 776,798,958 3 ######### YEAR 5 Program Period Target buyers (per period) Target buyers (year) Jumlah General,Operational and Administrative by Months & Quarters Bundling system Every month 84 1008 ######### (Rp) With Regular promotion Year 1 Year 2 Year 3 Year 4 Year 5 Cooking competition Every 6 month 25 50 2,000,000 Month 1 43,076,438 36,962,101 40,040,451 43,394,518 47,519,418 Food bazaar in Independence day Once a year 50 50 4,300,000 Month 2 43,076,438 36,962,101 40,040,451 43,394,518 47,519,418 Microfinance program Every 4 month 98 296 7,104,000 Month 3 43,076,438 36,962,101 40,040,451 43,394,518 47,519,418 Membership Every month 3 36 630,000 Total 1st Quarter 129,229,315 110,886,304 120,121,353 130,183,555 142,558,253 Member get Member Every month 5 60 1,539,360 TOTAL NUMBER OF BUYERS YEAR 1500 buyers Month 4 43,076,438 36,962,101 40,040,451 43,394,518 47,519,418 3 ######### Month 5 43,076,438 36,962,101 40,040,451 43,394,518 47,519,418 Month 6 43,076,438 36,962,101 40,040,451 43,394,518 47,519,418 Total 2nd Quarter 129,229,315 110,886,304 120,121,353 130,183,555 142,558,253 Month 7 43,076,438 36,962,101 40,040,451 43,394,518 47,519,418 Month 8 43,076,438 36,962,101 40,040,451 43,394,518 47,519,418 Month 9 43,076,438 36,962,101 40,040,451 43,394,518 47,519,418 Total 3rd Quarter 129,229,315 110,886,304 120,121,353 130,183,555 142,558,253 Month 10 43,076,438 36,962,101 40,040,451 43,394,518 47,519,418 Month 11 43,076,438 36,962,101 40,040,451 43,394,518 47,519,418 Month 12 85,750,593 127,870,115 140,415,978 144,176,120 149,664,859 Total 4th Quarter 171,903,470 201,794,318 220,496,879 230,965,157 244,703,695 Total for year 559,591,414 534,453,231 580,860,937 621,515,823 672,378,453
  • 13. 05-10-12 Biokraftstoffe 1 $ = 8,552 Rp Notes 11:37 AM Personnel inflasi = 6.70% Years 1 to 5 1.00 = $ 1.48 (Rp) 1.00 = 12,657 Rp Year 1 Year 2 Year 3 Year 4 Year 5 Net Revenues 3,283,344,080 4,942,014,392 6,517,952,984 8,750,057,782 11,261,642,439 Sales & Marketing Marketing Manager 36,000,000 38,412,000 40,985,604 43,731,639 46,661,659 Customer service 9,000,000 9,603,000 10,246,401 10,932,910 11,665,415 Tech support 18,000,000 19,206,000 20,492,802 21,865,820 23,330,830 Sales Person 45,000,000 48,015,000 51,232,005 54,664,549 58,327,074 Total Salary 108,000,000 115,236,000 122,956,812 131,194,918 139,984,978 Benefits Percent (%) 10% 10% 10% 10% 10% Total benefit costs 10,800,000 11,523,600 12,295,681 13,119,492 13,998,498 Total S & M Compensation 118,800,000 126,759,600 135,252,493 144,314,410 153,983,476 % of Revenue 3.6% 2.6% 2.1% 1.6% 1.4% General & Administration Chief Executive Officer 48,000,000 51,216,000 54,647,472 58,308,853 62,215,546 Chief Financial Officer 36,000,000 38,412,000 40,985,604 43,731,639 46,661,659 HR Manager 36,000,000 38,412,000 40,985,604 43,731,639 46,661,659 HR Staff 21,000,000 22,407,000 23,908,269 25,510,123 27,219,301 Accounting 42,000,000 44,814,000 47,816,538 51,020,246 54,438,603 Clerks and admin personnel 42,000,000 44,814,000 47,816,538 51,020,246 54,438,603 Total Salary 225,000,000 240,075,000 256,160,025 273,322,747 291,635,371 Benefits Percent (%) 10% 10% 10% 10% 10% Total benefit costs 22,500,000 24,007,500 25,616,003 27,332,275 29,163,537 Total G & A Compensation 247,500,000 264,082,500 281,776,028 300,655,021 320,798,908 % of Revenue 7.5% 5.3% 4.3% 3.4% 2.8%
  • 14. Cost of Revenue 05-10-12 Operational 11:37 AM Operations Manager 36,000,000 38,412,000 40,985,604 43,731,639 46,661,659 Staff 63,000,000 67,221,000 71,724,807 76,530,369 81,657,904 Labor 54,000,000 57,618,000 61,478,406 65,597,459 69,992,489 Total Salary 153,000,000 163,251,000 174,188,817 185,859,468 198,312,052 Benefits Percent (%) 15% 15% 20% 20% 25% Total benefit costs 22,950,000 24,487,650 34,837,763 37,171,894 49,578,013 Total Salary Costs 175,950,000 187,738,650 209,026,580 223,031,361 247,890,065 Total COR's Compensation 175,950,000 187,738,650 209,026,580 223,031,361 247,890,065 % of Revenue 5.4% 3.8% 3.2% 2.5% 2.2% Total Salary & Wages 486,000,000 518,562,000 553,305,654 590,377,133 629,932,401 Total Benefits 56,250,000 60,018,750 72,749,447 77,623,660 92,740,048 Total Compensation 542,250,000 578,580,750 626,055,101 668,000,793 722,672,449 % of Revenue 16.5% 11.7% 9.6% 7.6% 6.4%
  • 15. 05-10-12 Biokraftstoffe 1 $ = 8,552 Rp Notes AM 11:37 Taxes inflasi = 6.70% Years 1 to 5 1.00 = $ 1.48 (Rp) 1.00 = 12,657 Rp Year 1 Year 2 Year 3 Year 4 Year 5 Net Revenues 3,283,344,080 4,942,014,392 6,517,952,984 8,750,057,782 11,261,642,439 Income Tax (Rate Federal & State) 10% 10% 10% 10% 10% Net Earnings Before Taxes (190,007,469) 263,175,051 616,092,524 1,369,737,893 2,067,731,904 Cumulative (190,007,469) 73,167,581 689,260,105 2,058,997,998 4,126,729,902 Taxes 0 (26,317,505) (61,609,252) (136,973,789) (206,773,190) Percent of Revenues 0.0% -0.5% -0.9% -1.6% -1.8%
  • 16. 05-10-12 Biokraftstoffe 1 $ = 8,552 Rp 11:37 AM Property and Equipment inflasi = 6.70% Years 1 to 5 1.00 = $ 1.48 (Rp) 1.00 = 12,657 Rp Year 0 Year 1 Year 2 Year 3 Year 4 Year 5 Purchased Net Revenues Assets 3,283,344,080 4,942,014,392 6,517,952,984 8,750,057,782 11,261,642,439 Capital Expenditures Prepaid Rent of Depo & Office 60,000,000 Oil Drum (100 litre capacity) 25,915,404 15,498,737 16,666,667 22,790,404 22,790,404 Oil Galon (5 litre capacity) 10,000,000 Peeling Machine 20,000,000 Filtering Machine 5,000,000 Press Machine 20,000,000 Other Equipment 1,000,000 Total Capital Expenditures 141,915,404 15,498,737 16,666,667 22,790,404 22,790,404 0 % of Revenue 0.5% 0.3% 0.3% 0.3% 0.0% Depreciation on Rent of Depo & Office (allocated to Cost of Revenue) Depreciation Rate: Years 1 1 1 1 1 1 Year 0 60,000,000 0 0 0 0 Year 1 0 0 0 0 0 Year 2 0 0 0 0 Year 3 0 0 0 Year 4 0 0 Year 5 0 Total Depreciation 60,000,000 0 0 0 0 Depreciation Oil Drum and Depo Equipment (allocated to Cost of Revenue) Depreciation Rate: Years 10 10 10 10 10 10 Year 0 2,591,540 2,591,540 2,591,540 2,591,540 2,591,540 Year 1 1,549,874 1,549,874 1,549,874 1,549,874 1,549,874 Year 2 1,666,667 1,666,667 1,666,667 1,666,667 Year 3 2,279,040 2,279,040 2,279,040 Year 4 2,279,040 2,279,040 Year 5 0 Total Depreciation 4,141,414 5,808,081 8,087,121 10,366,162 10,366,162 Depreciation Office Utilities (allocated to General & Administrative Expenses) Depreciation Rate: Years 1 1 1 1 1 1 Year 0 1,000,000 0 0 0 0 Year 1 0 0 0 0 0 Year 2 0 0 0 0 Year 3 0 0 0 Year 4 0 0 Year 5 0 Total Depreciation 1,000,000 0 0 0 0 Total Depreciation 65,141,414 5,808,081 8,087,121 10,366,162 10,366,162 % of Revenue 2.0% 0.1% 0.1% 0.1% 0.1% Property & Equipment Gross Asset Value 141,915,404 157,414,141 174,080,808 196,871,212 219,661,616 219,661,616 Accumulated Depreciation 65,141,414 70,949,495 79,036,616 89,402,778 99,768,939 Net Property and Equipment 141,915,404 92,272,727 103,131,313 117,834,596 130,258,838 119,892,677 % of Revenue 2.8% 2.1% 1.8% 1.5% 1.1% Capital Expenditures by Months & Quarters (Rp) Year 1 Year 2 Year 3 Year 4 Year 5 Month 1 15,498,737 Month 2 Month 3 Total 1st Quarter 15,498,737 0 0 0 0 Month 4 Month 5 Month 6 Total 2nd Quarter 0 0 0 0 0 Month 7 Month 8 Month 9 Total 3rd Quarter 0 0 0 0 0 Month 10 Month 11 Month 12 Total 4th Quarter 0 0 0 0 0
  • 17. Total for year 15,498,737 0 0 0 05-10-12 0 11:37 AM
  • 18. 05-10-12 Notes 11:37 AM
  • 19. 05-10-12 Biokraftstoffe 1 $ = 8,552 Rp Notes 11:37 AM Working Capital inflasi = 6.70% Years 1 to 5 1.00 = $ 1.48 (Rp) 1.00 = 12,657 Rp Year 1 Year 2 Year 3 Year 4 Year 5 Net Revenues 3,283,344,080 4,942,014,392 6,517,952,984 8,750,057,782 11,261,642,439 Accounts Receivable % of Revenue Days Outstanding 0 0 0 0 0 Accounts Receivable 0 0 0 0 0 (Increase)/Decrease from Prev. Period 0 0 0 0 0 Inventory % of Revenue Inventory Turns 0 0 0 0 0 Inventory Days 0 0 0 0 0 Inventory 0 0 0 0 0 (Increase)/Decrease from Prev. Period 0 0 0 0 0 Other Current Assets % of Revenue Days 0 0 0 0 0 Other CA Value 0 0 0 0 0 (Increase)/Decrease from Prev. Period 0 0 0 0 0 Accounts Payable & Accrued Expenses % of Revenue Days 0 0 0 0 0 AP & Accrued Value 0 0 0 0 0 Increase/(Decrease) from Prev. Period 0 0 0 0 0 Other Current Liabilites % of Revenue 0.0% 0.0% 0.0% 0.0% 0.0% Days 0 0 0 0 0 Other Current Liabilities 0 0 0 0 0 Increase/(Decrease) from Prev. Period 0 0 0 0 0 Net Working Capital 0 0 0 0 0 Revenues by Months & Quarters (Rp) Year 1 Year 2 Year 3 Year 4 Year 5 Month 1 252,746,495 341,783,391 449,301,648 610,933,028 795,901,010 Month 2 252,746,495 341,783,391 449,301,648 610,933,028 795,901,010 Month 3 252,746,495 341,783,391 449,301,648 610,933,028 795,901,010 Total 1st Quarter 758,239,485 1,025,350,172 1,347,904,944 1,832,799,084 2,387,703,030 Month 4 252,746,495 341,783,391 449,301,648 610,933,028 795,901,010 Month 5 252,746,495 341,783,391 449,301,648 610,933,028 795,901,010 Month 6 252,746,495 341,783,391 449,301,648 610,933,028 795,901,010 Total 2nd Quarter 758,239,485 1,025,350,172 1,347,904,944 1,832,799,084 2,387,703,030 Month 7 252,746,495 341,783,391 449,301,648 610,933,028 795,901,010 Month 8 252,746,495 341,783,391 449,301,648 610,933,028 795,901,010 Month 9 252,746,495 341,783,391 449,301,648 610,933,028 795,901,010 Total 3rd Quarter 758,239,485 1,025,350,172 1,347,904,944 1,832,799,084 2,387,703,030 Month 10 252,746,495 341,783,391 449,301,648 610,933,028 795,901,010 Month 11 252,746,495 341,783,391 449,301,648 610,933,028 795,901,010 Month 12 503,132,635 1,182,397,093 1,575,634,858 2,029,794,475 2,506,731,329 Total 4th Quarter 1,008,625,625 1,865,963,875 2,474,238,154 3,251,660,531 4,098,533,349 Total for year 3,283,344,080 4,942,014,392 6,517,952,984 8,750,057,782 11,261,642,439 Accounts Receivable by Months & Quarters (Rp) Year 1 Year 2 Year 3 Year 4 Year 5 Month 1 - - - - - Month 2 - - - - - Month 3 - - - - - Month 4 - - - - - Month 5 - - - - - Month 6 - - - - - Month 7 - - - - - Month 8 - - - - - Month 9 - - - - - Month 10 - - - - - Month 11 - - - - - Month 12 - - - - - Inventory by Months & Quarters (Rp) Year 1 Year 2 Year 3 Year 4 Year 5 Month 1 - - - - - Month 2 - - - - - Month 3 - - - - -
  • 20. Month 4 - - - - - 05-10-12 Month 5 - - - - - 11:37 AM Month 6 - - - - - Month 7 - - - - - Month 8 - - - - - Month 9 - - - - - Month 10 - - - - - Month 11 - - - - - Month 12 - - - - - Other Current Assets by Months & Quarters (Rp) Year 1 Year 2 Year 3 Year 4 Year 5 Month 1 - - - - - Month 2 - - - - - Month 3 - - - - - Month 4 - - - - - Month 5 - - - - - Month 6 - - - - - Month 7 - - - - - Month 8 - - - - - Month 9 - - - - - Month 10 - - - - - Month 11 - - - - - Month 12 - - - - -
  • 21. Accounts Payble & Accrued Expenses by Months & Quarters 05-10-12 11:37 AM (Rp) Year 1 Year 2 Year 3 Year 4 Year 5 Month 1 - - - - - Month 2 - - - - - Month 3 - - - - - Month 4 - - - - - Month 5 - - - - - Month 6 - - - - - Month 7 - - - - - Month 8 - - - - - Month 9 - - - - - Month 10 - - - - - Month 11 - - - - - Month 12 - - - - - Other Current Liabilities by Months & Quarters (Rp) Year 1 Year 2 Year 3 Year 4 Year 5 Month 1 - - - - - Month 2 - - - - - Month 3 - - - - - Month 4 - - - - - Month 5 - - - - - Month 6 - - - - - Month 7 - - - - - Month 8 - - - - - Month 9 - - - - - Month 10 - - - - - Month 11 - - - - - Month 12 - - - - -
  • 22. 05-10-12 Biokraftstoffe 1 $ = 8,552 Rp 11:37 AM Funding Projections inflasi = 6.70% Years 1 to 5 1.00 = $ 1.48 (Rp) 1.00 = 12,657 Rp Property & Equipment Gross Asset Value 141,915,404 157,414,141 174,080,808 196,871,212 219,661,616 219,661,616 Accumulated Depreciation 65,141,414 70,949,495 79,036,616 89,402,778 99,768,939 Net Property and Equipment 141,915,404 92,272,727 103,131,313 117,834,596 130,258,838 119,892,677 % of Revenue 12.42% 11.59% 7.66% 6.93% 5.48% Begin Year 1 Year 2 Year 3 Year 4 Year 5 Beginning Cash 50,000,000 Equity Common 50,000,000 50,000,000 50,000,000 50,000,000 50,000,000 50,000,000 Increase / (Decrease) Previous Period 0 0 0 0 0 Total Equity 50,000,000 50,000,000 50,000,000 50,000,000 50,000,000 50,000,000 Debt Short Term Debt 150,000,000 Increase / (Decrease) Previous Period 150,000,000 (150,000,000) 0 0 0 Long Term Debt Current Portion 39,368,714 39,368,714 39,368,714 39,368,714 39,368,714 Long Term Portion 141,915,404 119,576,538 94,557,009 66,535,136 35,150,638 0 Total Long Term Debt 141,915,404 119,576,538 94,557,009 66,535,136 35,150,638 0 Increase / (Decrease) Previous Period Current Portion 0 0 0 0 0 Long Term Portion (22,338,866) (25,019,530) (28,021,873) (31,384,498) (35,150,638) Total Long Term Debt 141,915,404 (22,338,866) (25,019,530) (28,021,873) (31,384,498) (35,150,638) Total Equity & Debt 191,915,404 319,576,538 144,557,009 116,535,136 85,150,638 50,000,000 Partnership Contribution BSH (European Charity Program) 1,898,544,000 Indocement (Heidelberg Cement Group) Shell Foundation (Indonesia) 949,272,000 Total Partnership Contribution 949,272,000 1,898,544,000 0 0 0 0 Interest Interest Rate Short Term Debt 9.0% 9.0% 9.0% 9.0% 9.0% Long Term Debt 12.0% 12.0% 12.0% 12.0% 12.0% Interest Expense Short Term Debt 13,500,000 0 0 0 0 Long Term Debt 14,349,185 11,346,841 7,984,216 4,218,077 0 Total Interest 27,849,185 11,346,841 7,984,216 4,218,077 0 Interest Income Interest Rate 4.0% 4.0% 4.0% 4.0% 4.0% Interest Income 0 0 0 0 0 Retained Earnings Net Income (190,007,469) 236,857,546 554,483,271 1,232,764,104 1,860,958,714 Dividends Increase / (Decrease) Retained Earnings (190,007,469) 236,857,546 554,483,271 1,232,764,104 1,860,958,714 Beginning Retained Earnings 0 (190,007,469) 46,850,076 601,333,347 1,834,097,451 Ending Retained Earnings (190,007,469) 46,850,076 601,333,347 1,834,097,451 3,695,056,165 Cost of Debt 21.00% Cost of Equity 0.00% Cost of Capital 21.00%
  • 23. 05-10-12 Biokraftstoffe 1$ = 8,552 Rp 11:37 AM Income Statement inflasi = 6.70% Years 1 to 5 € 1.00 = $ 1.48 (Rp) € 1.00 = 12,657 Rp Year 1 Year 2 Year 3 Year 4 Year 5 NET REVENUES 3,283,344,080 4,942,014,392 6,517,952,984 8,750,057,782 11,261,642,439 COST OF REVENUE 2,524,393,666 3,669,935,518 4,754,742,040 6,069,285,041 7,688,424,912 % of Revenues 76.9% 74.3% 72.9% 69.4% 68.3% GROSS PROFIT 758,950,414 1,272,078,874 1,763,210,944 2,680,772,741 3,573,217,527 % of Revenues 23.1% 25.7% 27.1% 30.6% 31.7% OPERATING EXPENSES Sales & Marketing 345,100,564 438,393,680 525,683,502 641,550,659 776,798,958 General and Administration 559,591,414 534,453,231 580,860,937 621,515,823 672,378,453 All other expenses 16,416,720 24,710,072 32,589,765 43,750,289 56,308,212 Total Operating Expenses 921,108,699 997,556,982 1,139,134,204 1,306,816,771 1,505,485,623 % of Revenues 28.05% 20.19% 17.48% 14.93% 13.37% EARNINGS BEFORE INTEREST & TAXES (162,158,285) 274,521,892 624,076,740 1,373,955,970 2,067,731,904 INTEREST INCOME / (EXPENSE) (27,849,185) (11,346,841) (7,984,216) (4,218,077) (0) NET EARNINGS BEFORE TAXES (190,007,469) 263,175,051 616,092,524 1,369,737,893 2,067,731,904 TAXES 0 (26,317,505) (61,609,252) (136,973,789) (206,773,190) NET EARNINGS (190,007,469) 236,857,546 554,483,271 1,232,764,104 1,860,958,714 % of Revenues -5.8% 4.8% 8.5% 14.1% 16.5%
  • 24. 05-10-12 Biokraftstoffe 1$ = 8,552 11:37 AM Balance Sheet inflasi = 6.70% Years 1 to 5 € 1.00 = $ 1.48 (Rp) € 1.00 = 12,657 Begin Year 1 Year 2 Year 3 ASSETS CURRENT ASSETS Cash 50,000,000 37,296,342 88,275,772 600,033,887 Accounts Receivable 0 0 0 Inventories 0 0 0 Other Current Assets 0 0 0 Total Current Assets 50,000,000 37,296,342 88,275,772 600,033,887 PROPERTY & EQUIPMENT 141,915,404 92,272,727 103,131,313 117,834,596 TOTAL ASSETS 191,915,404 129,569,069 191,407,085 717,868,483 LIABILITIES & SHAREHOLDERS' EQUITY CURRENT LIABILITIES Short Term Debt 0 150,000,000 0 0 Accounts Payable & Accrued Expen 0 0 0 Other Current Liab 0 0 0 Total Current Liabilities 0 150,000,000 0 0 LONG TERM DEBT 141,915,404 119,576,538 94,557,009 66,535,136 STOCKHOLDERS' EQUITY Capital 50,000,000 50,000,000 50,000,000 50,000,000 Retained Earnings (190,007,469) 46,850,076 601,333,347 Total Equity 50,000,000 (140,007,469) 96,850,076 651,333,347 TOTAL LIABILITIES & EQUITY 191,915,404 129,569,069 191,407,085 717,868,483 0 0 0 0
  • 25. 05-10-12 Rp 11:37 AM Rp Year 4 Year 5 1,788,989,250 3,625,163,488 0 0 0 0 0 0 1,788,989,250 3,625,163,488 130,258,838 119,892,677 1,919,248,089 3,745,056,165 0 0 0 0 0 0 0 0 35,150,638 0 50,000,000 50,000,000 1,834,097,451 3,695,056,165 1,884,097,451 3,745,056,165 1,919,248,089 3,745,056,165 0 0
  • 26. 05-10-12 Biokraftstoffe 1$ = 8,552 Rp 11:37 AM Cash Flow Statememt inflasi = 6.70% Years 1 to 5 € 1.00 = $ 1.48 (Rp) € 1.00 = 12,657 Rp Begin Year 1 Year 2 Year 3 Year 4 OPERATING ACTIVITIES Net Earnings (190,007,469) 236,857,546 554,483,271 1,232,764,104 Depreciation 65,141,414 5,808,081 8,087,121 10,366,162 Working Capital Changes (Increase)/Decrease Accounts Receivable 0 0 0 0 (Increase)/Decrease Inventories 0 0 0 0 (Increase)/Decrease Other Current Assets 0 0 0 0 Increase/(Decrease) Accts Pay & Accrd Expenses 0 0 0 0 Increase/(Decrease) Other Current Liab 0 0 0 0 Net Cash Provided/(Used) by Operating Activities (124,866,055) 242,665,626 562,570,392 1,243,130,265 INVESTING ACTIVITIES Property & Equipment (141,915,404) (15,498,737) (16,666,667) (22,790,404) (22,790,404) Initial Fee for CDM Project Project AMS-II.G (949,272,000) Project AMS-I.G (949,272,000) Project AMS-I.H (949,272,000) Net Cash Used in Investing Activities (1,091,187,404) (1,914,042,737) (16,666,667) (22,790,404) (22,790,404) FINANCING ACTIVITIES Increase/(Decrease) Short Term Debt 150,000,000 (150,000,000) 0 0 Increase/(Decrease) Long Term Debt 141,915,404 (22,338,866) (25,019,530) (28,021,873) (31,384,498) Increase/(Decrease) Owner's Capital 50,000,000 0 0 0 0 Increase/(Decrease) Partnership Contribution 949,272,000 1,898,544,000 0 0 0 Dividends Declared 0 0 0 0 Net Cash Provided / (Used) by Financing 1,141,187,404 2,026,205,134 (175,019,530) (28,021,873) (31,384,498) INCREASE/(DECREASE) IN CASH 50,000,000 (12,703,658) 50,979,430 511,758,115 1,188,955,363 CASH AT BEGINNING OF YEAR 50,000,000 37,296,342 88,275,772 600,033,887 CASH AT END OF YEAR 50,000,000 37,296,342 88,275,772 600,033,887 1,788,989,250 (1,091,187,404) 37,296,342 88,275,772 600,033,887 1,788,989,250 NPV 1,298,237,347 IRR 49% MIRR 41%
  • 27. 05-10-12 11:37 AM Year 5 1,860,958,714 10,366,162 0 0 0 0 0 1,871,324,875 0 0 0 (35,150,638) 0 0 0 (35,150,638) 1,836,174,238 1,788,989,250 3,625,163,488 3,625,163,488