
Recomendados
Mais conteúdo relacionado
Mais procurados
Mais procurados (20)
Destaque
Semelhante a Chapter 9
Semelhante a Chapter 9 (20)
Último
Último (20)
Chapter 9
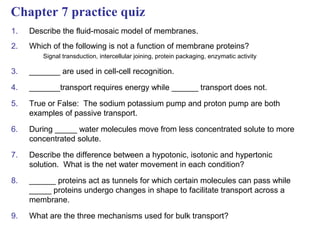
- 1. Chapter 7 practice quiz 1. Describe the fluid-mosaic model of membranes. 2. Which of the following is not a function of membrane proteins? Signal transduction, intercellular joining, protein packaging, enzymatic activity 3. _______ are used in cell-cell recognition. 4. _______transport requires energy while ______ transport does not. 5. True or False: The sodium potassium pump and proton pump are both examples of passive transport. 6. During _____ water molecules move from less concentrated solute to more concentrated solute. 7. Describe the difference between a hypotonic, isotonic and hypertonic solution. What is the net water movement in each condition? 8. ______ proteins act as tunnels for which certain molecules can pass while _____ proteins undergo changes in shape to facilitate transport across a membrane. 9. What are the three mechanisms used for bulk transport?
- 2. Chapter 9 Cellular Respiration: Harvesting Chemical Energy PowerPoint® Lecture Presentations for Biology Eighth Edition Neil Campbell and Jane Reece Lectures by Chris Romero, updated by Erin Barley with contributions from Joan Sharp Copyright © 2008 Pearson Education, Inc., publishing as Pearson Benjamin Cummings
- 3. Fig. 9-2 Light energy ECOSYSTEM Photosynthesis in chloroplasts CO2 + H2O Organic +O molecules 2 Cellular respiration in mitochondria ATP ATP powers most cellular work Heat energy
- 4. Catabolic Pathways and Production of ATP • The breakdown of organic molecules is exergonic • Fermentation is a partial degradation of sugars that occurs without O2 • Anaerobic respiration harvests chemical energy without using O2 • Aerobic respiration (aka cellular respiration) consumes organic molecules and O2 and yields ATP – Organic compounds + O2 CO2 + H20 + Energy – C6H12O6 + 6 O2 → 6 CO2 + 6 H2O + Energy (ATP + heat) Copyright © 2008 Pearson Education, Inc., publishing as Pearson Benjamin Cummings
- 5. Redox Reactions: Oxidation and Reduction • Chemical reactions that transfer electrons between reactants are called oxidation-reduction reactions, or redox reactions • In oxidation, a substance loses electrons, or is oxidized • In reduction, a substance gains electrons, or is reduced (the amount of positive charge is reduced) • Redox reactions will always be between a fuel and oxygen – This reaction is exergonic because it moves electrons towards the more electronegative atom (oxygen) – This released energy is ultimately used to synthesize ATP
- 6. Redox Rxn: Electron transfer from X to Y becomes oxidized becomes reduced Electron Electron donor = acceptor = reducing oxidizing agent agent Xe- reduces Y by adding an electron to it. Y oxidizes Xe- by removing an electron from it. Fig. 9-UN2
- 7. Redox Rxn: cellular respiration becomes oxidized becomes reduced Fuel is oxidized and the oxygen is reduced. Oxidation of glucose transfers electrons to a lower energy state, releasing energy which can be used to regenerate ATP Organic molecules with lots of H are good fuels because for each electron (from H) donated to oxygen, energy is released Fig. 9-UN3
- 8. Stepwise Energy Harvest via NAD+ and the Electron Transport Chain • In cellular respiration, glucose and other organic molecules are broken down in a series of steps • Electrons from organic compounds are usually first transferred to NAD+ (nicotinamide adenine dinucleotide), a coenzyme • As an electron acceptor or carrier, NAD+ functions as an oxidizing agent during cellular respiration • Each NADH (the reduced form of NAD+) represents stored energy that is tapped to synthesize ATP • NAD+ is reduced to NADH Copyright © 2008 Pearson Education, Inc., publishing as Pearson Benjamin Cummings
- 9. During cellular respiration… • NADH passes the electrons to the electron transport chain (exergonic process) • The electron transport chain passes electrons in a series of steps instead of one explosive reaction – O2 pulls electrons down the chain in an energy-yielding tumble • Electrons removed from glucose are shuttled by NADH to the higher-energy end of the chain • O2 captures these electrons at the lower-energy end with H protons to form water • The energy yielded is used to regenerate ATP Copyright © 2008 Pearson Education, Inc., publishing as Pearson Benjamin Cummings
- 10. During cellular respiration • During cellular respiration, most electrons travel the following “downhill” route: Glucose NADH ETC oxygen • Energy is released as the electron reaches oxygen • Cellular respiration is exergonic
- 11. Fig. 9-5 (a) Uncontrolled reaction (b) Cellular respiration H2 + 1/2 O2 2H + 1 /2 O2 (from food via NADH) Controlled release of 2 H+ + 2 e– energy for synthesis of ATP Elec ATP Free energy, G Free energy, G tron ain Explosive ATP release of ch tran heat and light ATP energy spor 2 e– t 1 /2 O2 2H + H2O H2O Moving electrons closer to an electronegative element releases energy
- 12. The Stages of Cellular Respiration: A Preview • Cellular respiration has three stages: – Glycolysis (breaks down glucose into two molecules of pyruvate) – The citric acid cycle (completes the breakdown of glucose) – Oxidative phosphorylation (accounts for most of the ATP synthesis) Copyright © 2008 Pearson Education, Inc., publishing as Pearson Benjamin Cummings
- 13. Fig. 9-6-1 Electrons carried via NADH Glycolysis Glucose Pyruvate Cytosol ATP Substrate-level phosphorylation
- 14. Fig. 9-6-2 Electrons Electrons carried carried via NADH and via NADH FADH2 Citric Glycolysis acid Glucose Pyruvate cycle Mitochondrion Cytosol ATP ATP Substrate-level Substrate-level phosphorylation phosphorylation
- 15. Fig. 9-6-3 Electrons Electrons carried carried via NADH and via NADH FADH2 Citric Oxidative Glycolysis acid phosphorylation: electron transport Glucose Pyruvate cycle and chemiosmosis Mitochondrion Cytosol ATP ATP ATP Substrate-level Substrate-level Oxidative phosphorylation phosphorylation phosphorylation
- 16. Production of ATP during cellular respiration • Oxidative phosphorylation generates most of the ATP because it is powered by redox reactions – accounts for almost 90% of the ATP generated by cellular respiration • A smaller amount of ATP is formed in glycolysis and the citric acid cycle by substrate-level phosphorylation Enzyme Enzyme ADP P + ATP Substrate Product Phosphate is taken from a substrate to convert ADP to ATP
- 17. Glycolysis harvests chemical energy by oxidizing glucose to pyruvate • Glycolysis (“splitting of sugar”) breaks down glucose into two molecules of pyruvate • Glycolysis occurs in the cytoplasm and has two major phases: – Energy investment phase (cell spends ATP) – Energy payoff phase (cell produces energy) Copyright © 2008 Pearson Education, Inc., publishing as Pearson Benjamin Cummings
- 18. Fig. 9-8 Energy investment phase Glucose 2 ADP + 2 P 2 ATP used Energy payoff phase Via substrate-level 4 ADP + 4 P 4 ATP formed phosphorylation 2 NAD+ + 4 e– + 4 H+ NAD+ is reduced to 2 NADH + 2 H+ NADH by electrons released from the oxidation of glucose 2 Pyruvate + 2 H2O Net Glucose 2 Pyruvate + 2 H2O No CO2 is released 4 ATP formed – 2 ATP used 2 ATP during glycolysis 2 NAD+ + 4 e– + 4 H+ 2 NADH + 2 H+
- 19. Glycolysis practice quiz 1. What are the three stages of cellular respiration? 2. Why is cellular respiration an exergonic process? 3. reducing An electron donor is called the _____________ agent while the electron 4. oxidizing acceptor is the ____________ agent. 5. True or False: CO2 is a biproduct of glycolysis. 6. Chart the path an electron takes during cellular respiration. 7. What is the benefit of the electron transport chain in cellular respiration. 8. Describe two ways in which ATP is produced during cellular respiration. 9. What is the net energy output as a result of glycolysis?
- 20. The citric acid cycle completes the energy-yielding oxidation of organic molecules • In the presence of O2, pyruvate enters the mitochondrion where the oxidation of glucose is completed • Before the citric acid cycle can begin, pyruvate must be converted to acetyl CoA, which links the cycle to glycolysis 1. Removal of CO2 from pyruvate 2. NAD+ is reduced to NADH 3. Coenzyme A (CoA) is attached by an unstable bond • Acetyl CoA can now be fed into CAC Copyright © 2008 Pearson Education, Inc., publishing as Pearson Benjamin Cummings
- 21. Fig. 9-10 Conversion of pyruvate to acetyl CoA CYTOSOL MITOCHONDRION NAD+ NADH + H+ 2 1 3 Acetyl CoA Pyruvate CO2 Coenzyme A Unstable bond in acetyl CoA makes entering the CAC an exergonic process
- 22. During the Citric Acid Cycle… • Pyruvate is broken down into three molecules of CO2 (includes the CO2 produced during the conversion to Acetyl CoA) • The cycle oxidizes organic fuel derived from pyruvate, generating – 1 ATP (via substrate-level phosphorylation) – 3 NADH (contains most of the chemical energy) – 1 FADH2 (flavin adenine dinucleotide acts as a electron shuttle) • NADH and FADH2 can then shuttle their high energy electrons to the ETC
- 23. Fig. 9-11 Pyruvate CO2 NAD+ CoA NADH + H+ Per 1 pyruvate: Acetyl CoA CoA •3 CO2 •3 NADH CoA •1 ATP •1 FADH Per 2 pyruvates or 1 glucose: Citric acid •6 CO2 cycle 2 CO2 •6 NADH •2 ATP FADH2 3 NAD+ •2 FADH FAD 3 NADH + 3 H+ ADP + P i ATP
- 24. During oxidative phosphorylation, chemiosmosis couples electron transport to ATP synthesis • Following glycolysis and the citric acid cycle, NADH and FADH2 account for most of the energy extracted from food • These two electron carriers donate electrons to the electron transport chain, which powers ATP synthesis via oxidative phosphorylation • Most of the chain’s components are proteins, which exist in multiprotein complexes • The carriers alternate reduced and oxidized states as they accept and donate electrons • Electrons drop in free energy as they go down the chain and are finally passed to O2, forming H2O Copyright © 2008 Pearson Education, Inc., publishing as Pearson Benjamin Cummings
- 25. The ETC NADH Electron carriers alternate 50 2 e– between reduced and NAD+ FADH2 oxidized states as they 2 e– FAD accept and donate Multiprotein electrons. Ι Electronegativity 40 FMN FAD complexes Fe•S Fe•S Ι Free energy (G) relative to O2 (kcal/mol) Each component of the Ι Q chain becomes reduced ΙΙ Cyt b Ι when it accepts electrons Fe•S from its uphill neighbor, 30 Cyt c1 which is less IV Cyt c electronegative. Cyt a Cyt a3 The carrier then returns to 20 its oxidized form as it passes electrons downhill to its more electronegative neighbor. 2 e– 10 (from NADH The ETC eases the fall of or FADH2) electrons from food to oxygen, breaking a large free-energy drop into 0 2 H+ + 1/2 O2 smaller steps that release energy in manageable amounts. H2O Fig. 9-13
- 26. Chemiosmosis: The Energy-Coupling Mechanism • Electron transfer in the ETC causes proteins to pump H + from the mitochondrial matrix to the intermembrane space • H+ then moves back across the membrane, passing through channels in ATP synthase • ATP synthase uses the exergonic flow of H+ to drive phosphorylation of ADP • This is an example of chemiosmosis, the use of energy in a H+ gradient to drive cellular work • The energy stored in a H+ gradient across a membrane couples the redox reactions of the electron transport chain to ATP synthesis Copyright © 2008 Pearson Education, Inc., publishing as Pearson Benjamin Cummings
- 27. Chemiosmosis couples the ETC to ATP synthesis H+ H + H+ H+ Protein Cyt c complex of electron carriers ΙV Q Ι ΙΙ Ι ATP synthase ΙΙ 2 H+ + 1/2O2 H2O FADH2 FAD NADH NAD+ ADP + P i ATP (carrying electrons from food) H+ 1 Electron transport chain Electron transport and pumping of protons (H+), which create an H+ gradient 2 Chemiosmosis ATP synthesis powered by the flow of H+ across the membrane back across the membrane Oxidative phosphorylation Fig. 9-16
- 28. An Accounting of ATP Production by Cellular Respiration • During cellular respiration, most energy flows in this sequence: glucose → NADH → ETC→ chemiosmosis → ATP • One NADH can produce about 3 ATP • About 40% of the energy in a glucose molecule is transferred to ATP during cellular respiration, making about 38 ATP Copyright © 2008 Pearson Education, Inc., publishing as Pearson Benjamin Cummings
- 29. ATP yield/molecule of glucose at each stage of cellular respiration CYTOSOL Electron shuttles MITOCHONDRION span membrane 2 NADH or 2 FADH2 2 NADH 2 NADH 6 NADH 2 FADH2 Glycolysis Oxidative 2 2 Citric phosphorylation: Glucose Pyruvate Acetyl acid electron transport CoA cycle and chemiosmosis + 2 ATP + 2 ATP + about 32 or 34 ATP Maximum About per glucose: 36 or 38 ATP Fig. 9-17
- 30. Fermentation and anaerobic respiration enable cells to produce ATP without the use of oxygen • Most cellular respiration requires O2 to produce ATP • Glycolysis can produce ATP with or without O2 (in aerobic or anaerobic conditions) • In the absence of O2, glycolysis couples with fermentation or anaerobic respiration to produce ATP • Anaerobic respiration uses an electron transport chain with an electron acceptor other than O2, for example sulfate • Fermentation uses phosphorylation instead of an electron transport chain to generate ATP Copyright © 2008 Pearson Education, Inc., publishing as Pearson Benjamin Cummings
- 31. Types of Fermentation • Two common types are alcohol fermentation and lactic acid fermentation • In alcohol fermentation, pyruvate is converted to ethanol in two steps, with the first releasing CO2 – used in brewing, winemaking, and baking • In lactic acid fermentation, pyruvate is reduced to NADH, forming lactate as an end product, with no release of CO 2 – used to make cheese and yogurt – Human muscle cells use lactic acid fermentation to generate ATP when O2 is scarce
- 32. Fig. 9-18 2 ADP + 2 Pi 2 ATP Glucose Glycolysis Alcohol fermentation 2 Pyruvate produces 2 NAD+ 2 NADH 2 CO2 ethanol + 2 H+ 2 Ethanol 2 Acetaldehyde 2 ADP + 2 Pi 2 ATP Glucose Glycolysis Lactic acid fermentation 2 NAD+ 2 NADH produces + 2 H+ lactate 2 Pyruvate 2 Lactate
- 33. Fig. 9-19 Glucose Glycolysis CYTOSOL Pyruvate No O2 present: O2 present: Fermentation Aerobic cellular respiration MITOCHONDRION Ethanol Acetyl CoA or lactate Citric acid cycle
- 34. Fermentation and Aerobic Respiration Compared • Both processes use glycolysis to oxidize glucose and other organic fuels to pyruvate • The processes have different final electron acceptors: an organic molecule (such as pyruvate or acetaldehyde) in fermentation and O2 in cellular respiration • Cellular respiration produces 38 ATP per glucose molecule; fermentation produces 2 ATP per glucose molecule Copyright © 2008 Pearson Education, Inc., publishing as Pearson Benjamin Cummings
Notas do Editor
- Figure 9.2 Energy flow and chemical recycling in ecosystems
- Figure 9.5 An introduction to electron transport chains
- Figure 9.6 An overview of cellular respiration
- Figure 9.6 An overview of cellular respiration
- Figure 9.6 An overview of cellular respiration
- Figure 9.8 The energy input and output of glycolysis
- Figure 9.10 Conversion of pyruvate to acetyl CoA, the junction between glycolysis and the citric acid cycle
- Figure 9.11 An overview of the citric acid cycle
- For the Cell Biology Video ATP Synthase 3D Structure — Side View, go to Animation and Video Files. For the Cell Biology Video ATP Synthase 3D Structure — Top View, go to Animation and Video Files.
- Figure 9.13 Free-energy change during electron transport
- Figure 9.16 Chemiosmosis couples the electron transport chain to ATP synthesis
- Figure 9.17 ATP yield per molecule of glucose at each stage of cellular respiration
- Figure 9.18 Fermentation
- Figure 9.19 Pyruvate as a key juncture in catabolism