
Recomendados
Recomendados
Mais conteúdo relacionado
Destaque
Semelhante a Russia's Destination Image in Online Marketing
Semelhante a Russia's Destination Image in Online Marketing (7)
Mais de A Morrison
Mais de A Morrison (20)
Último
Último (20)
Russia's Destination Image in Online Marketing
- 1. ARTICLE IN PRESS Tourism Management 27 (2006) 943–956 www.elsevier.com/locate/tourman The destination image of Russia: From the online induced perspective Svetlana Stepchenkovaa, Alastair M. Morrisonb,Ã a Department of Hospitality and Tourism Management, Purdue University, 154 Stone Hall, 700 W. State Street, West Lafayette, IN 47907-2059, USA b Department of Hospitality and Tourism Management, College of Consumer and Family Sciences, Purdue University, 111A Stone Hall, 700 W. State Street West, Lafayette, IN 47907-2059 USA Received 1 May 2005; accepted 3 October 2005 Abstract With the Internet becoming a prominent means of destination marketing and promotion, this study compared US and Russian website materials related to travel to Russia to determine whether the two sides differed in: (1) most frequently mentioned places within the country; and (2) descriptions of Russia as a travel destination. These different perspectives can contribute to a better understanding of the induced component of Russia’s destination image in the online environment and their analysis resulted in important marketing implications. The research approach for this study was to view every website as a case in the selected sample of the whole population of US and Russian websites. Two software programs, CATPAC II and WORDER, were applied to analyze the content of website materials and solve the technical issues of destination counting. This study clearly suggests that US tour operators are narrowly positioning Russia as mainly being a historic and cultural destination, with a relatively tight geographic emphasis on the western portion of the country. Technically and content-wise, the Russian websites require the greatest improvements. They tend to be loaded with information and not particularly well targeted to specific countries of visitor origin or market segments by travel interests. r 2005 Published by Elsevier Ltd. Keywords: CATPAC; Content analysis; Destination image; Induced image; Russia; WORDER 1. Introduction Goskomstat), a total of 22.51 million people visited Russia in 2003, or 8.15 million people without counting the 1.1. Russian inbound tourism and the US component arrivals from the CIS countries (Rosstat, 2004). The US is one of the most important countries for inbound tourism Starting in the early 1990s and to date, Russia has to Russia: in 2003, 281,000 US residents visited Russia, the undergone changes in its political, economic, and social fifth largest share of visitors (not including arrivals from spheres that have had a huge impact on inbound tourism. the former Soviet republics) (Russia’s Federal State While in the former Soviet Union international travelers Statistics Service (Rosstat), 2004). Given the size of the had limited tourist options to choose from, today US market and the fact that American pleasure travelers numerous tourist companies offer exciting and diverse are the world’s leading travel spenders (World Tourism Russian tourism products. The openness of Russia as a Organization (WTO), 2004), this segment is very attractive travel destination and rising quality of its tourism offer has for the Russian tourism industry from an economic been reflected in the growing numbers of tourist arrivals for standpoint. the last 10 years. WTO estimates Russian tourism potential However, the positioning of the country for the US as 47 million international travelers by 2020 (World consumer segment is problematic without a thorough Tourism Organization (WTO), 2003). According to Rus- understanding of how Russia as a vacation destination is sia’s Federal State Statistics Service (Rosstat, former perceived by potential US pleasure travelers (Ahmed, 1991; Hunt, 1975). The lack of information is evident: the ÃCorresponding author. Tel.: +1 765 494 7905; fax: +1 765 496 1168. destination image literature reviewed by Pike (2002) for the E-mail addresses: svetlana@purdue.edu (S. Stepchenkova), period of 1973–2000, found only one out of 142 articles alastair@purdue.edu (A.M. Morrison). that dealt with Russia’s image. Moreover, that study by 0261-5177/$ - see front matter r 2005 Published by Elsevier Ltd. doi:10.1016/j.tourman.2005.10.021
- 2. ARTICLE IN PRESS 944 S. Stepchenkova, A.M. Morrison / Tourism Management 27 (2006) 943–956 Pizam, Jafari, and Milman (1991) reflected the old, Baud-Bovy, 1977) and, as such, encompass stereotypes ‘‘Soviet’’ image of the country. While a comprehensive about a destination (Jenkins, 1999). According to Echtner study of Russia’s destination image remains to be done, and Ritchie (1993), ‘‘holistic and unique images are this research attempted to gain initial insights into what particularly important in determining how a particular image of Russia is transmitted by American and Russian destination is categorized (stereotype holistic impressions) tour operators in the online environment. and differentiated (unique attractions, auras) in the minds The comparative analysis of destination images is of of the targeted markets.’’ interest from at least two perspectives. First, it would be Destination image is formed by processing information reasonable to propose that US tour operators know more from various sources over time (Assael, 1984), which are about US tourists and what they are seeking. Therefore, to categorized into organic and induced (Gartner, 1993; see how Russia is presented by the tour operators of one of Gunn, 1972). The organic sources (books, school curricu- the largest tourist markets in the world should be useful to lum, news, movies, actual destination visits, etc.) do not both the Federal Tourism Agency of the Russian Federa- have a vested interest in promoting a destination, while the tion (FTA) and Russian travel providers. It should be induced sources (travel brochures, advertisements, posters, helpful to better understand the demand for the Russian videos, and, most recently, the Internet) are a means of tourism product and, if needed, in countering negative or communicating marketing messages of the destination and inaccurate information. Second, Russian tour operators suppliers to a chosen travel audience. As Morgan and should know more about the destinations within Russia. ´ Pritchard (2001, p. 275) pointed out, a country’s ‘‘cliched Thus, the Russian perspective should make US tour identity can y be reshaped and given greater complexity operators more aware of the travel opportunities within through effective and consistent marketing.’’ Messages Russia that they are missing. Therefore, the primary transmitted by the induced sources contribute to the objectives of this study were to: formation of the induced component of destination images, since, as Gartner (1989, p. 16) argued, ‘‘because of 1. Identify destinations within Russia mentioned most economic and time cost, vacation travel to a distant frequently by US and Russian tour operator websites. destination will usually be undertaken only after an The comparative analysis of frequencies will shed light extensive information search. In the absence of actual on the awareness levels of attractions and places of visitation, destination images are formed through induced interest within Russia among US tour operators. agents.’’ 2. Pinpoint the most frequent meaningful words (these might include ‘‘Moscow’’, ‘‘Kremlin’’, ‘‘church’’) when 1.3. Internet as tourism marketing medium tour operators offer Russia as a destination and to uncover the common themes in their descriptions of The Internet is becoming a prominent medium in Russia. The most frequent meaningful words were tourism marketing (O’Connor & Murphy, 2004; Oh, interpreted as the induced image variables and were Kim, & Shin, 2004). It has been actively used by hotels used to compare the US and Russian perspectives on (Baloglu & Pekcan, 2006; Fam, Foscht, & Collins, 2004; Russia as a travel destination. Scharl, Wober, & Bauer, 2004), airlines (Chu, 2001), travel ¨ + agencies (Ozturan & Roney, 2004), convention and visitors bureaus (Yuan, Gretzel, & Fesenmaier, 2003) and other 1.2. Destination image and its induced component destination marketing organizations (Doolin, Burgess, & Cooper, 2002; Stamboulis & Skayannis, 2003). Travel and Although an exact meaning of the term ‘‘destination tourism services appear to be especially well suited for image’’ is difficult to define (Echtner & Ritchie, 1991; Internet marketing because of their intangibility as well as Pearce, 1988), there is a general agreement among scholars high price, risk, and involvement levels. On the demand that destination image is a multi-faceted, composite side, an increasing number of people are using the Internet construct, which consists of interrelated cognitive and for information search because the World Wide Web affective evaluations woven into overall impressions provides more in-depth materials and richer content (Assael, 1984; Baloglu & McCleary, 1999; Gartner, 1993; compared with conventional promotional agents (Govers MacKay & Fesenmaier, 1997). Some researchers empha- & Go, 2003; Heung, 2004). sized the influence of destination image on destination The websites of American and Russian tour operators choice and argued that the image construct follows the providing travel to Russia were chosen as induced image three-element attitude model from psychology, which agents since: (a) the popularity of the Internet as a means includes cognitive, affective, and behavioral elements of advertising, promoting, and selling destinations is (Breckler, 1984; Pike & Ryan, 2004; White, 2004). Echtner growing in both countries and; (b) coordinated efforts by and Ritchie (1991, 1993) suggested that the destination the Russian government and tour operators to promote image construct consists of three dimensions: attribute- Russia have begun relatively recently, and Russian-made holistic, functional-psychological, and common-unique. printed materials are scarce (‘‘Izvestia’’, March 11, 2003). Images can be shared by groups of people (Lawson & Currently, the Internet is the least expensive and fastest
- 3. ARTICLE IN PRESS S. Stepchenkova, A.M. Morrison / Tourism Management 27 (2006) 943–956 945 way for Russian officials and tour operators to reach the 2.2. Proposed approach for destination image measurement international traveler. of textual data The composite nature of the destination image construct 2. Methodology presents great challenges for its measurement. In addition, destination image measurement techniques are dependent 2.1. Sample selection on the original data format. Strong preference has been given to structured methods of image measurement when Russia-related texts from 212 websites of US and data were obtained as answers to closed-ended survey Russian tour operators, official sources, and travel guides questions (Echtner & Ritchie, 1991; Pike, 2002). While were collected and stored for further content analysis as structured methodologies have a number of advantages 212 plain text documents. These files were regarded as a over qualitative methods, they focus on particular destina- sample from a population of all US and Russian websites tion attributes and generally neglect the holistic, or overall, promoting trips to Russia. Due to the global nature of the aspect of destination image. Qualitative studies, on the Internet, there were cases that were difficult to classify as contrary, are advantageous to measuring the holistic either US or Russian, for which a new category of aspect, but do not facilitate statistical and comparative ‘‘Partnership’’ was employed. The classification into US, analyses of destination images (Jenkins, 1999). Among the Russian, or Partnership websites is described below: studies dealing with content analysis of textual and/or pictorial materials are those by Andsager and Drzewiecka A company operating from the US with a website in the (2002), Dann (1996), Echtner (2002), Echtner and Ritchie .com domain was considered a US company. The US (1993), MacKay and Fesenmaier (1997), Reilly (1990), and sample included the websites of the US Tour Operator Tapachai and Waryszak (2000). These researchers em- Association (23), American Society of Travel Agents ployed sorting and categorization techniques to identify the (13), cruise lines (18), top 50 travel agencies (6), as well frequencies of certain words, concepts, objects, or people, as 19 ‘‘independent’’ websites, and 24 Internet travel which for ease of further reference are referred to as guides. All these websites with the exception of the ‘‘meaningful words.’’ The most frequent meaningful words ‘‘independent’’ category were included into the sample in these and other qualitative studies were treated as image by going through the comprehensive lists obtained variables, or dimensions, of the destination image con- through the associations’ websites or through the Yahoo struct. This study proposes a new approach for content search engine. analysis of textual data using the combination of long-on- Websites on travel to Russia with English language the-market CATPAC II software (Woelfel, 1998) and the content in the .ru domain were considered Russian. newly developed WORDER program (Kirilenko, 2004), Unfortunately, a complete list of the Russian companies which allows effective identification of destination image catering to international travelers could not be obtained. variables and clustering them into image themes of more Websites were found through the search engines, as well holistic nature. as from the websites of such organizations as The The CATPAC II software ‘‘is a self-organizing artificial Moscow Times, Moscow International Travel Tour- neural network that has been optimized for reading text. ism Exhibition, official Moscow city website, Yellow CATPAC identifies the most important words in a text and pages, etc. Websites on travel to Russia in the domains determines patterns of similarity based on the way they are .com, .net, and .org were considered Russian if a used in text’’ (Woelfel, 1998, p. 11). CATPAC has been Russian company owned them, had a Russian postal used to conduct content analysis of political speeches, address, and a predominantly Russian staff. The focus groups interviews, and marketing studies (Doerfel Russian sample included 84 tour operator websites, 6 Marsh, 2003; Schmidt, 1998), as well as in tourism-related websites of Russian official sources, and 13 travel research (Jeon Morrison, 2003; Kim, Xiang, guides. Fesenmaier, 2005). However, CATPAC works with only Websites that belonged to companies with offices one file at a time, which makes it unsuitable for analyzing both in the US and Russia (and elsewhere in the world) multiple individual responses or large samples of textual with Russian staff were considered Partnerships (e.g., data, like the websites in this study. WORDER, in White Nights: www.wnights.com). Companies with contrast, is able to count the frequencies of up to 1000 offices in the US, Russian people on staff, and Russian specified words in up to 1000 specified files in one run with agents in Russia specializing in travel to Russia were table-formatted output transferable to an SPSS file. also considered Partnerships (e.g., Sokol Tours: www. To attain the first objective, a master list of 344 sokoltours.com). destinations within Russia was compiled based on the standard division of Russia into 13 recreational regions In the SPSS file, every website was coded as US, Russian, (Goskomstat, 2000). These destinations were counted in or Partnership; tour operator, official source, or travel every file of the sample using the WORDER software guide; and by file length. program and their frequencies were entered into SPSS.
- 4. ARTICLE IN PRESS 946 S. Stepchenkova, A.M. Morrison / Tourism Management 27 (2006) 943–956 New integrated regional variables were computed by 3. Changing plural nouns into the singular form (e.g., aggregating the original destinations by region, e.g., the ‘‘palaces’’ into ‘‘palace’’) and counting synonyms as one Far East or Central integrated variables. Then t-tests were word (e.g., ‘‘monastery’’, ‘‘cloister’’, ‘‘convent’’, and conducted to compare frequencies of the regional inte- ‘‘abbey’’ were counted as ‘‘monastery’’) to reinforce the grated variables for the American and Russian samples. concept. With regard to the second objective, the US and Russian files were combined into two respective groups and content To indicate how to ‘‘smooth out’’ the original data, a list analyzed by CATPAC, which resulted in the list of the of key words was constructed. It included destinations, most frequent words used in the textual data. The task of which were very likely to have different spellings, and the researchers was to choose the most meaningful words, image variables as indicated by the initial CATPAC or image variables, setting aside such auxiliaries as articles, analysis of the original data. Table 1 gives an example prepositions, pronouns, and/or words related to organizing from the list of the key words. Every row corresponds to a tours (the auxiliary words were easily excluded from certain key word with all its various forms. When either of counting by placing them into an Exclude file). The final these forms was encountered in the analyzed text, it was set of image variables contained nouns, verbs, and substituted by the spelling specified in the first column and descriptors (i.e., adjectives and adverbs), since nouns are counted as such. In the counting process, WORDER used to focus attention on attractions (e.g., museum, creates a new file where the specified substitutions are made Baikal), verbs describe actions or tourism types (e.g., and does not change the original data. rafting, sightseeing), and descriptors (e.g., ancient, exciting) A number of tests were run to ensure that the results of create atmosphere (Echtner, 2002). counting by WORDER were consistent with that from Then WORDER obtained a response from every website CATPAC II. The small inconsistencies encountered might in the sample on the selected image variables. Since have been due to the various approaches to counting of CATPAC does not cope well with files of substantial special cases arising when converting different Web text size—dendograms, which are supposed to show how the encodings to a MS Word file, then to a .txt file. Otherwise, image variables cluster into meaningful concepts, look it was found that the results were generally consistent. The ‘‘like a mitten instead of a glove’’ (Woelfel, 1998, p. 25)— overall research design is depicted in Fig. 1. clustering the image variables into image themes was done using factor analysis. It was run on the combined sample to 2.4. List of destinations determine the main aspects of the induced Russian image. To compile a master list of the destinations within 2.3. Solving special issues of content analysis Russia to be counted, the accepted division of Russia into 13 recreational regions as illustrated in Fig. 2 was followed. A laborious ‘smoothing out’ process regarding the The main tourist destinations in every region, as indicated meaningful words should be performed on the textual data by: (a) the Goskomstat reports (Goskomstat, 2000); (b) the prior to using the CATPAC program (Schmidt, n.d.). The official website of the Federal Tourism Agency of the combination of CATPAC and WORDER software can Russian Federation; (c) UNESCO; (d) websites of admin- efficiently solve the following issues of content analysis: istrative entities of the Russian Federation; and (e) the researchers, were included. 1. Making spelling of the key words (i.e., destinations and The master list of the destinations contained: (a) capitals image variables) consistent in all text files. Even within a of federal entities; (b) large industrial centers; (c) old single website the spelling may be inconsistent (e.g., Russian cities, architectural and historical places; Saint-Petersburg vs. Sankt-Petersburg); across all the (d) centers of Russian folk art; (e) cities along the main websites the issue is of enormous proportion. waterway systems; (f) major ports; (g) places connected 2. Changing multi-word concepts, e.g., ‘‘Peter the Great’’, with famous Russian people; (h) resorts and spas; (i) places into a one-word format for further counting. If not, it of famous battles; (j) famous railways and major cities would be difficult to distinguish how many times the along them; (k) biggest rivers, cruise and white water; word ‘‘great’’ referred to Peter the Great and how often (l) mountain regions and peaks; (m) nature reserves; (n) it was counted with the meaning of ‘‘magnificent’’ or lakes; (o) UNESCO World Heritage List sites; (p) unique ‘‘splendid.’’ locations; and (q) destinations in neighboring countries, Table 1 Sample from the list of keywords Performance Performances Concert Concerts Show Shows Peterhof Peterhoff Petergof Petergoff Redsquare Red Square
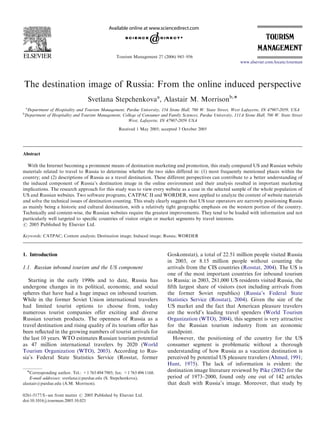
- 5. ARTICLE IN PRESS S. Stepchenkova, A.M. Morrison / Tourism Management 27 (2006) 943–956 947 List of keywords: List of List of most frequent Original words to describe text files keywords files: text Russia from Websites WORDER: Text Smoothing Function: Exclude CATPAC file Consistent spelling Synonyms Plural/singular Smoothed out text files Data Analysis: Multi-word Comparisons of concepts U.S./Russian destination U.S./Russian/ frequencies Partnership, affiliation, file T-tests of integrated size Destination destination variables SPSS Counting Function Factor Analysis of Russian induced image variables Fig. 1. Research design. (e.g., ‘‘cruise’’) were also specified for counting by WORDER in every one of 212 files in order to better interpret the destination frequency results. These words were given the title of ‘‘help words.’’ Since many destinations in the master list provided different forms of tourism, the help words gave a clearer indication of the prevalent tourism types, e.g., high mean frequencies of Yaroslavl, Uglich, Kostroma, and Samara destinations along with those of such help words as ‘‘cruise’’, ‘‘ship’’ and ‘‘river’’ indicated that the cruises along the Volga river were being offered. 3. Results Fig. 2. Russian recreational regions. 1: Western; 2: North-Western; 3: Central; 4: Southern; 5: Povolzhje; 6: Urals; 7: Azov-Black Sea; 8: Caucasus; 9: Ob’-Altai; 10: Yeniseisky; 11: Baikal; 12: Far Eastern; and 3.1. Estimation of richness of the destination pool 13: Northern. After the text smoothing process, the frequencies of all which are frequently included by tour operators into specified destinations were counted by WORDER and combined tours, cruises, or railway journeys. The total entered in SPSS. Out of 344 destinations, 43 had zero number of destinations selected was 344, many belonging frequencies, 45 destinations appeared in only one website, to several categories. It is well known that after the Russian 34 in only two websites. The destinations with zero Revolution in 1917, many ancient Russian cities were frequencies can be roughly divided into three main types: renamed after prominent communist figures, and starting at the end of the 1980s, the original names were given back Industrial cities or administrative centers, which offer to many of these locations. Nowadays, these cities are very little to the international traveler in terms of sometimes referred to by using both names together, e.g., architecture, arts, and scenery. ‘‘Vyatka, former Kirov.’’ To avoid double counting, the Places with historical, religious, and/or cultural impor- current name was retained for the analysis. When a tance, far from main transportation centers and/or location had equally used names, e.g., Zagorsk/Sergiyev lacking in infrastructure. Posad, it was decided to count both occurrences but to Local parks, which cannot compete with the well-known assign them to one variable, in this case, Zagorsk. nature reserves of Caucasus, Altai, Baikal, etc. 2.5. List of help words It is natural to assume that not all the destinations that are mentioned in the sampled websites were actually Besides the 344 destinations, 30 words, which indicated included into the master list for counting. To estimate the tourism activities (e.g., ‘‘hunting’’, ‘‘rafting’’), main nature richness of the destination pool and to see how many features (e.g., ‘‘river’’, ‘‘mountain’’), and types of travel destinations might have ‘‘slipped through’’ undetected, the
- 6. ARTICLE IN PRESS 948 S. Stepchenkova, A.M. Morrison / Tourism Management 27 (2006) 943–956 Chao and jackknife statistical methods of extrapolated larger in Russian websites, which might indicate more richness were used (Chao, 1987; Oksanen, 2002). Chao’s extensive destination coverage. For destinations common extrapolation of destination richness gave 330.78 destina- to both lists, the standard deviation for the US websites tions; first- and second-order jackknife methods gave was smaller for all destinations except Peterhof. This 345.78 and 356.78 destinations, respectively. Overall, the means that the US tour operators gave a more balanced specified pool of 344 destinations was considered to be a description of the main Russian places of interest. There very good scope. was more agreement among US tour operators as to what were the best places in Russia to visit. The large standard 3.2. Destination frequencies deviations of destination variables in the Russian websites reflected the specialization of the Russian tour operators The top 25 destinations for 79 US and 84 Russian tour on one or another destination or set of destinations. It is operator websites are given in Table 2; help words which especially evident with the Baikal–Irkutsk–Listvyanka–Ol- were also counted in order to identify the dominant khon destination set around Lake Baikal, and also true for tourism types are also shown in italics. In round numbers, Kamchatka, Novosibirsk, Petrozavodsk, Vladivostok, Al- the average length of Russian-related texts on US websites tai and Solovki, all of them being Siberian, Far Eastern, or was 5000 words with a standard deviation of 6700 words, Northern destinations. However, there were relatively large while for Russian websites these parameters were 9700 and standard deviations in the US list for Kamchatka, 13,400, respectively. The destination means were generally Sakhalin, and the Amur River (Russian North and Far Table 2 Top 25 destinations for US and Russian tour operator websites US—79 sites Mean SD Russian—84 Mean SD sites 1 St. Petersburg 25.14 30.55 1 Moscow 29.33 46.32 2 Moscow 23.48 29.66 2 St. Petersburg 26.20 42.34 Cruise 4.89 8.05 3 Baikal 15.69 44.25 3 Peterhof 3.99 6.95 Mountain 13.11 34.75 Ship 3.10 4.92 Volcano 10.76 34.62 4 Volgaa 2.54 4.70 Hunting 9.63 59.92 5 Helsinkia 2.24 7.32 4 Irkutsk 7.98 17.73 6 Yaroslavl 2.00 3.79 5 Kamchatka 6.52 19.23 7 Uglicha 1.90 3.67 Fishing 6.18 14.99 Mountain 1.80 7.59 Rafting 4.05 10.78 8 Novgorod 1.73 3.56 Skiing 3.67 10.21 9 Kamchatka 1.68 10.13 Nature reserve 3.52 26.99 10 Kizhi 1.67 3.00 Ship 3.45 10.00 11 Pavlovska 1.66 4.90 6 Vladimir 3.44 6.33 12 Finland 1.61 2.49 7 Altaib 3.27 12.20 13 Vladimir 1.51 3.11 8 Vladivostok 3.18 12.96 14 Vladivostok 1.49 6.86 9 Listvyankab 3.02 9.06 15 Irkutsk 1.30 4.55 10 Novosibirsk 3.01 14.31 16 Kazan 1.20 2.99 11 Yaroslavl 2.71 7.90 17 Amura 1.19 9.68 12 Olkhonb 2.60 10.04 18 Suzdal 1.16 3.50 13 Petrozavodskb 2.58 14.31 19 Sakhalina 1.14 10.01 14 Suzdal 2.56 5.54 20 Baikal 1.13 4.02 15 Peterhof 2.54 4.24 21 Zagorsk 1.09 1.99 16 Kizhi 2.50 9.36 22 Trans-Siba 1.06 3.83 17 Novgorod 2.33 5.07 23 Kostroma 1.01 2.30 Resort 2.02 6.81 24 Golden Ring 0.95 2.06 18 Kazan 2.00 7.47 25 Far Easta 0.87 4.91 19 Kostroma 1.93 4.90 — Cruise 1.93 4.41 — 20 Zagorsk 1.89 3.62 Volcano 0.72 3.30 21 Solovkib 1.82 11.13 — Geyser 1.76 6.04 Hunting 0.68 3.96 22 Uralsb 1.76 5.86 — 23 Barnaulb 1.68 7.83 — 24 Valaamb 1.65 5.39 — 25 Golden Ring 1.62 4.51 a Destinations that did not make Russian Top 25 list. b Destinations that did not make US Top 25 list.
- 7. ARTICLE IN PRESS S. Stepchenkova, A.M. Morrison / Tourism Management 27 (2006) 943–956 949 East) indicating that these destinations were described and Adding Russian official websites and Russian and US promoted by some US websites more heavily. A close look travel guides increased the samples (Russian-100, US-103) into the data revealed that several US tour operators, in but did not much change the frequency picture. In the 103- fact, specialized in travel to Russian Far East, and their US top-25 list there were the same destinations with the websites had very extensive coverage of the region and its mean frequencies only slightly changed. Standard devia- natural resources. tions were smaller, which means that such comprehensive Two capitals, Moscow and St. Petersburg, were at the websites as travel guides mentioned more destinations and very top of both lists with St. Petersburg having the places of interest than the websites of tour operators. For absolute largest mean in the US sample. Moscow, being the the Russian sample, the words ‘‘Solovki’’, ‘‘Barnaul’’, and Russia’s official capital and main transportation center, ‘‘Valaam’’ gave way to ‘‘Volga’’, ‘‘Trans-Sib’’, and was reflected by the largest mean in the Russian sample. In ‘‘Caucasus’’, which was understandable, since Barnaul the US list, Helsinki and Finland appeared, which made the short list by being the major transportation confirmed that the US tour operators offered many tours center for Altai region (seventh place in the Table 2, for the to Russia as part of longer itineraries and cruises. The Russian list). Not very many Russian tour operators work words ‘‘cruise’’, ‘‘ship’’ and ‘‘Volga’’ along with destina- with Trans-Sib packages either, while travel guides tell tions of Kizhi, Yaroslavl, Uglich, Kostroma, and Kazan, more about it. And, again, Caucasus entering the list was that are located along the main waterways, showed that very much in line with adventure travel, promoted by the cruises and river tours were very popular with US tour Russian side. operators. Peterhof, Pavlovsk and the number 26 destina- tion of Tsarskoye Selo in the US list are all day-trip 3.3. Integrated regional variables: t-tests destinations from St. Petersburg. They were especially popular with US tour operators, as well as Zagorsk, a day- In order to get a broader picture of the US and Russian trip destination from Moscow. travel offers, all destinations belonging to the same There seems to be a consensus on both the US and recreational region were aggregated into one integrated Russian sides as to what are the best Russian cities from variable by adding up the frequencies of the original the historical and architectural standpoint. They are the so- destinations. Using the division given in Fig. 2, 13 regional called Golden Ring cities of Suzdal, Vladimir, Yaroslavl, integrated variables were computed. Since it was noted Zagorsk, and Kostroma, as well as Novgorod. However, from the data that there were joint tours of Russia–Fin- Vladimir’s results were most definitely inflated, since it was land, Russia–Ukraine, and Russia–Mongolia–China, one impossible to separate the city’s name from a widely used more regional variable, namely Foreign ¼ Beijing+Fin- Russian personal first name. Vladimir and Suzdal are land+Helsinki+Kiev+Odessa+Ulaanbaatar, was com- geographically close and often mentioned together, so puted to see how often US and Russian tour operators Vladimir’s true frequency should be closer to that of offered travel to Russia as part of multi-country trips. Suzdal. Normality tests for the regional integrated variables The Trans-Siberian Railway (Trans-Sib) and the cities revealed that the data did not come from normally along it—Yaroslavl, Novosibirsk, Irkutsk, Vladivostok distributed populations, and outliers and skewedness were and, possibly, Kazan (strictly speaking, Kazan is not on detected. However, the t-test method is quite robust to the Trans-Sib but there are tourist train routes which go deviations from normality if sample sizes are large enough through Kazan because of its beauty and historical and do not differ too much. Table 3 presents the results of importance)—also made the US top 25 list. In the US list, the t-test comparisons of the means of the regional the number 34 destination was Beijing, which indicates that integrated variables for the two independent samples, the some US tour operators offered the combined Trans- websites of US and Russian tour operators. Siberian and Trans-Mongolian journey, when from Lake For the long-established destinations of Moscow, St. Baikal a train goes to Beijing through the steppes of Petersburg, North-Western and Central regions, significant Mongolia to make this epic journey even more exotic. differences in frequency of mention were not detected. The While the mentioned cities were also in the Russian list, the North-Western region is famous for Kizhi cruises from St. variable Trans-Sib was only number 45 there. Petersburg, as well as for the old Russian cities of From this short list, it can also be concluded that the Novgorod and Pskov. The Central region includes the Russian side actively promoted hunting and fishing as well Golden Ring cities and most centers of Russian folk art. as adventure travel, which was indicated by such destina- Together, these two regions share cruises from Moscow to tions as Baikal, Kamchatka, Altai, and the Urals, along St. Petersburg and back, which are popular with both sides. with the words ‘‘mountain’’, ‘‘volcano’’, ‘‘hunting’’, ‘‘fish- The Foreign regional variable was the only one with a ing’’ and ‘‘rafting.’’ It seems that the Russian potential higher mean for the US sample, indicating that US tour regarding adventure travel was also being recognized by operators more often included Russia as a part of multi- the US side, judging from the words ‘‘mountain’’, country tours. ‘‘volcano’’, ‘‘hunting’’ combined with such destinations as The Povolzhje region is famous for Volga river tours and Kamchatka, Sakhalin, the Amur River, and Baikal. Volga-Don cruises to the Ukraine. The Southern region is
- 8. ARTICLE IN PRESS 950 S. Stepchenkova, A.M. Morrison / Tourism Management 27 (2006) 943–956 Table 3 t-test comparisons between US and Russian websites for integrated regional variables Integrated regional Mean US sample—79 sites Mean Russian sample—84 t-statistic Sig variables sites St. Petersburg 25.14 26.20 0.183 0.855 Moscow 23.48 29.33 0.966 0.335 North-Western without St. 15.20 21.57 1.123 0.263 Petersburg Central without Moscow 11.06 17.44 1.586 0.115 Foreign 5.61 2.74 À2.200 0.030* Northern 4.42 18.18 2.222 0.028* Povolzhje 4.03 6.36 1.130 0.260 Far Eastern 2.85 4.73 0.681 0.497 Baikal 2.82 31.98 3.189 0.002** Urals 1.05 3.69 2.109 0.038* Azov-Black Sea 0.70 0.83 0.270 0.787 Ob’-Altai 0.67 11.42 2.582 0.012* Caucasus 0.61 5.18 2.106 0.038* Yeniseisky 0.48 5.18 2.815 0.006** Western 0.25 1.00 1.619 0.109 Southern 0.00 0.57 1.021 0.310 *0.01opp0.05, **pp0.01. mostly agricultural, and both sides do not see many attractions there for the foreign traveler, which was indicated by the very low means. The Western region— Kaliningradskaya oblast—is probably considered Eur- opean rather than Russian, and not offered either. Although the Azov-Black Sea region has the main Russian resorts, which are quite popular with Russians, their quality and service standards are lower than what is expected by the foreign traveler, and are too close to the Caucasus with its unstable political situation. The Russian North, Siberia (Ob’-Altai, Yeniseisky, and Baikal regions), Urals, and Caucasus were the regions where significant differences were registered. It is consistent Fig. 3. Integrated regional variables: t-test comparisons of US and with the policy declared by the Russian tourism authorities Russian websites. that Siberia, especially Lake Baikal, is the main develop- mental focus of the Federal Tourism Agency of the Russian Federation (‘‘Izvestia’’, March 11, 2003). The quite remarkable and represents quite a high level of Russian side promotes the Caucasus as a skiing and agreement between the US and Russian sides on the mountain destination with the highest peak in Europe. The historical, cultural, and arts components of the Russian Russian Far East did not come up as being significant in tourism image. The remaining 17 words showed that the the analysis. The visual representation of the t-test results is US side explored in more depth the cultural attractions of given in Fig. 3. Moscow and St. Petersburg, river cruises, and Russia’s Soviet past. The Russian side placed more emphasis on the 3.4. Russian induced image variables country’s vast and unique natural resources with their fishing and hunting opportunities. For the comparative analysis of the most frequent meaningful words used to describe Russia, the 103 US 3.5. Factor analysis: induced image themes files were combined together and 100 Russian and 9 Partnerships files made the other text body. It was decided To get further insights into the overall induced images of to join the Partnership files with the Russian sample Russia as a tourist destination, 212 files smoothed by because the Partnership websites exhibited more simila- WORDER, were combined into one file and then analyzed rities to the Russian websites. The CATPAC II analysis by CATPAC II. It was decided to exclude from the analysis revealed that out of the 60 most frequent words, 43 were all words that related to the organization of tours, such as the same for both sides, as indicated by Table 4. This is ‘‘arrival’’, ‘‘breakfast’’, ‘‘bus’’, etc. As a result, a list of the
- 9. ARTICLE IN PRESS S. Stepchenkova, A.M. Morrison / Tourism Management 27 (2006) 943–956 951 Table 4 Top 60 most frequent words used to describe Russia ## US—103 Russian ## US—103 Russian partnerships—109 partnerships—109 1 Moscow City 31 Enjoya Campb 2 City Moscow 32 Capital Volcanob 3 Petersburg Museum 33 Royala Town 4 Palace River 34 Sovieta Collection 5 Museum Lake 35 Sea Monument 6 Cathedral Petersburg 36 Summer Irkutskb 7 Great Ancient 37 Fortress Huntingb 8 Famous Cathedral 38 Local Sea 9 Church Church 39 Train Train 10 River Palace 40 Cruisea Square 11 Art Architecture 41 Sightseeing Uniqueb 12 Century Century 42 Lake Theater 13 Ancient Great 43 Red Squarea Kamchatkab 14 World Famous 44 Peterhofa Tsar 15 Kremlin Baikalb 45 Besta Performance 16 Beautiful History 46 Siberia Waterb 17 Architecture Monastery 47 War Stationb 18 Tsar Art 48 Region Woodenb 19 Monastery Mountainb 49 Gardena Capital 20 History World 50 Europea Summer 21 Performance Excursion 51 Metroa Fishingb 22 Island Siberia 52 Stylea Peter the Great 23 Collection Island 53 Winter Palacea Fortress 24 Town Region 54 Monument Hermitage 25 Hermitage Beautiful 55 Nevaa Valleyb 26 Peter the Great Kremlin 56 Volgaa War 27 Large Large 57 Pushkina Natureb 28 Square Park 58 Shipa Whiteb 29 Theater Local 59 Petera Nationalb 30 Park Villageb 60 Excursion Sightseeing a Words that did not make Russian Top 60 list. b Words that did not make US Top 60 list. 70 most frequent meaningful words used to describe Russia ‘‘central’’—that did not load higher than 0.35 on any remained. These words were regarded as the overall factor, were eliminated. Looking at the interpretability of induced image variables of Russia. They were counted by the remaining factors, it was noted that factor 8 did not WORDER in every file of the sample, and entered into contain any words that loaded strongly on it. However, the SPSS as new variables. It was proposed that these words words ‘‘sea’’, ‘‘white’’, ‘‘monastery’’, ‘‘island’’ suggested described the major image themes as they appeared in the that this factor was the Russian North/Solovki theme with Russia-related texts from the sampled websites. The factor one of the key words, namely Solovki, left out of the analysis method was employed to look into the underlying analysis, since it ranked lower than 70 in the CATPAC II structure of these variables and identify the main image list (Solovki is a group of islands in the White Sea, which themes. was famous for its monastery ensemble and served as a As was expected, the correlation matrix displayed high prison under Stalin’s regime. Now it is a popular tourist pair-wise coefficients between most of the variables, and attraction with cruises from St. Petersburg). To check this communalities for all the variables were higher than 0.60. hypothesis, as well as stability of the solution, the analysis The Bartlett’s Test of Sphericity was significant with was repeated with the ‘‘Solovki’’ variable included, and the po0:001, and the KMO statistic of sampling adequacy final results are given in Table 5. The solution explained 85 was 0.916. Ten factors with Eigenvalues greater than 1.0 percent of the original variance, however, since the factors were extracted, which explained 84.2 percent of the co-varied, the sum of variances explained by each factor variance. To rotate the factors, the Direct Oblimin rotation was larger than the total variance. was preferred over Varimax (Kline, 1994), since it allows All the factors were self-explanatory, with image themes the factors to co-vary. With a number of variables loaded easily identified as Culture and History, Nature Parks, highly on several factors, the Oblimin rotation produced Siberia and Baikal, Cruise Tours, Moscow, St. Petersburg, the most simple and interpretable factor structure. Weak Country and State, Solovki, Kamchatka, and Hunting. items—‘‘beautiful’’, ‘‘traditional’’, ‘‘world’’, ‘‘famous’’, and Consistent with the previously described results, the main
- 10. ARTICLE IN PRESS 952 S. Stepchenkova, A.M. Morrison / Tourism Management 27 (2006) 943–956 Table 5 Factor analysis: Main Russian image themes Factors F1 F2 F3 F4 F5 F6 F7 F8 F9 F10 Culture and Nature Siberia Cruise tours Moscow St. Country Solovki Kamchatka Hunting history parks Baikal Petersburg state Cronbach’s 0.877 0.880 0.948 0.748 0.947 0.947 0.855 0.873 0.871 0.603 alpha Variance 15.600 10.320 17.035 5.279 16.316 15.735 11.526 6.045 10.304 6.050 explaineda Monument 0.767 Architecture 0.597 Museum 0.562 History 0.535 Unique 0.503 0.434 City 0.463 Park 0.740 National 0.727 Mountain 0.506 À0.418 White 0.490 0.484 Baikal À0.897 Irkutsk À0.830 Village À0.720 Siberia À0.684 Lake À0.657 Local À0.637 Special À0.628 Best À0.623 0.365 Train À0.611 Wooden À0.579 Water À0.572 Town À0.562 Station À0.530 Ancient À0.459 0.406 Cruise 0.716 Sightseeing 0.647 Enjoy À0.396 0.631 Kremlin 0.905 Monastery 0.744 Tsar 0.700 Moscow 0.681 0.448 Century 0.624 Soviet 0.541 0.433 Square 0.479 0.470 Cathedral 0.475 0.393 Performance 0.388 0.464 0.370 Art 0.451 Collection 0.445 0.378 Church 0.440 0.360 Residence 0.394 0.415 Palace 0.894 Petergr 0.799 Royal 0.756 Hermitage 0.676 Great 0.602 Petersburg 0.447 0.585 Fortress 0.579 Summer 0.507 Style 0.483 Theater 0.396 0.461 War 0.352 0.403 0.360 Region 0.659 Country 0.454 0.612 Large 0.501 Capital 0.437 Northern 0.431 0.432 Sea 0.350 0.386 0.373
- 11. ARTICLE IN PRESS S. Stepchenkova, A.M. Morrison / Tourism Management 27 (2006) 943–956 953 Table 5 (continued ) Factors F1 F2 F3 F4 F5 F6 F7 F8 F9 F10 Culture and Nature Siberia Cruise tours Moscow St. Country Solovki Kamchatka Hunting history parks Baikal Petersburg state Solovki 0.921 Island À0.374 0.413 Volcano 1.038 Kamchatka 0.890 Fishing 0.445 0.598 Excursion 0.457 0.492 River 0.419 Hunting 1.033 Camp 0.368 0.539 Extraction method: principal components analysis. Rotation method: Oblimin with Kaiser normalization. Rotation converged in 35 iterations. a The solution explained 85% of the total variance. Since the factors co-vary, the sum of factor variances is larger than 85. themes were related to the cultural, historical, and arts Tour operator websites had both textual and pictorial aspects of the Russian image (themes Culture and History, material. Although visual imagery is acknowledged to play Moscow, St. Petersburg), as well as the nature aspect an important role in destination image formation (Andsa- (Kamchatka, Nature Parks, Baikal and Siberia). A new ger Drzewiecka, 2002; MacKay Fesenmaier, 1997), the theme, Country and State, was also identified. proposed method is suitable for content analysis of textual data only. Furthermore, the study dealt with images as they were transmitted by the suppliers of Russia-related travel 4. Limitations products. Further research is needed to see how the promoted images have been interpreted by consumers. A question that still remains is how representative was This research was the first to use WORDER software, the sample of the whole population of US and Russian and some content analysis issues to be aware of have websites? While the researchers were fairly confident that emerged. WORDER substitutes the apostrophe character they had a good scope of US websites by going through the for a space while counting. Because of that, the Don River comprehensive lists of USTOA, ASTA, travel guides, etc., quite unexpectedly came up into the top 25 list of they could not be so certain about the Russian sample. A destinations. Although cruises along the Volga-Don route reliable statistical method to estimate how many sites were are quite popular, the counting was inflated by ‘‘don’t’’ left out from the analysis was not found. However, one of words, which were substituted for ‘‘don’t’’ by WORDER. the indications of a sufficient scope might be that the The ‘‘Don’’ variable was excluded from the analysis. researchers began encountering the same websites from different sources. 5. Conclusions and implications The research team firmly believes that the two sets of tour operators were comparable, but acknowledges that The first objective of this research was to identify there may be some differences in the nature and objectives destinations within Russia mentioned most frequently by of the providers of these websites. For example, in the US US and Russian tour operator websites. In general, there tour operators and wholesalers tend to specialize in tour was a substantial overlap between the top 25 destinations development, marketing and administration. They tend not in the two groups of websites. Seventeen destinations were to operate as travel agencies, and focus almost exclusively common: St. Petersburg, Moscow, Peterhof, Yaroslavl, on outbound tourism from the US. It is more likely that at Novgorod, Kamchatka, Kizhi, Finland, Vladimir, Vladi- least some of the Russian tour operators have more vostok, Irkutsk, Kazan, Suzdal, Baikal, Zagorsk, Kostro- diversified operations, perhaps functioning both as in- ma, and Golden Ring. Among the top 25 destinations in bound and outbound tour operators, and as travel agents. the US tour operator sites, eight were not found in the top Another limitation of the study was the insufficient 25 Russian list and vice versa. number of cases for comparative factor analysis of the There were several notable differences between the image themes that would use the US and Russian samples results for the US and Russian tour operator websites. separately. Since out of 60 most frequent meaningful words First, US tour operators gave a more balanced description to describe Russia, 43 were the same, to capture differences of the main places of interest, indicating more agreement in the images about 60–70 variables and consequently more among US tour operators as to the best places in Russia to than 150 cases for each side would have been needed. visit. The Russian tour operator websites were more
- 12. ARTICLE IN PRESS 954 S. Stepchenkova, A.M. Morrison / Tourism Management 27 (2006) 943–956 specialized, with a focus on one destination or a specific set great scope to broaden or further diversify the positioning of destinations. For example, some Russian tour operators strategies of US tour operators. For example, the US sites heavily promoted hunting, fishing, and adventure travel in could be expanded by adding information to target special- eastern Russia. Second, when the destinations were interest or niche markets such as adventure travel, culinary grouped into the 13 Russian recreational regions plus a and nature-based tours, and fishing and hunting. The foreign country category, t-tests detected seven significant website of the Federal Tourism Agency of the Russian differences for these 14 integrated regional variables. The Federation (http://www.russiatourism.ru/eng/default.asp, US tour operator websites only had the higher mean for 2004) provides useful guidance in this respect, by listing the ‘‘foreign’’ regional variable; while the Russian tour ecological tourism, sport and extreme tourism, fishing and operator websites had significantly more coverage for the hunting tourism, mountain skiing tours, and sea and river other six variables (Northern; Baikal; Urals; Ob’-Altai; cruising as niche market segments. Other image themes can Caucasus; Yeniseisky). This shows that the US tour also be more prominently highlighted in US tour operator operator websites were much narrower in their geographic websites, some of which are currently being used by the focus on Russian destinations, but were more likely to Russian counterparts. The nature parks theme and the discuss Russia in conjunction with other neighboring broader perspective of Russia’s outstanding natural countries. features and attractions is an example of a topic that The second objective was to identify the most used could be expanded. meaningful words when tour operators offer Russia as a Technically and content-wise, the Russian websites destination and to uncover the common themes in their require the greatest improvements. They tend to be loaded descriptions of Russia. These words and themes were with information and not particularly well targeted to interpreted as the induced image components and used to specific countries of visitor origin or market segments by compare the US and Russian perspectives on Russia as a travel interests. Moreover, there is no portal website of travel destination. The 10 image themes identified were information to Russia’s tour operators, such as the US has culture and history; nature parks; Siberia and Baikal; through the US Tour Operators Association (USTOA) and cruise tours; Moscow; St. Petersburg; country and state; the National Tour Association (NTA). The Russian Union Solovki; Kamchatka; and hunting. The most prevalent of Travel Industry or RUTI (formerly known as RATA, themes were related to the cultural, historical, and arts Russian Association of Tourist Agencies) could provide aspects of the Russian image (culture and history; Moscow; such a portal, but at the time of writing, the English version St. Petersburg), and the natural features of Russia of the organization’s website was not fully developed. (Kamchatka; nature parks; Baikal; Siberia). Generally, the websites of the Russian tour operators need In considering the management implications of these to be given a more professional appearance to inspire major conclusions, it should be realized that modern greater confidence and trust in potential travelers from the Russian tourism is still very young when compared to other US. There is also a need for greater consistency in the destinations, perhaps just 15 years old. It is suspected that content of the Russian websites, particularly with respect many of the Russian sites were originally designed and to destinations names, even on the official websites. The written for the domestic market, and have been directly Federal Tourism Agency of Russian Federation (FTA) is translated from Russian into English without adequate represented in the US by the Russian National Group thought given to cultural differences and varying destina- (RNG), a private representative firm. A cursory analysis of tion preferences. The Russian websites, in particular, need RNG’s current website clearly indicated that it was also in to be carefully redesigned and customized according to need of great improvement in appearance, user friendliness, major country of origin target markets. In the case of the market positioning and segmentation. US, the Russian tour operator websites should be adjusted It is true that this research study only considered one to make them more similar to the US tour operator component of destination image and in just one format websites, which probably better reflect the current market through a single research method: content analysis of demands of US travelers to Russia. digital information on the Web. Undoubtedly, the natural This study clearly suggests that US tour operators are environment images of Russia remain to be determined in a narrowly positioning Russia as mainly being a historic and variety of media. With regard to Russia’s natural environ- cultural destination, with a relatively tight geographic ment image, the FTA has little influence over the country’s emphasis on the western portion of the country. The US political and economic agenda and cannot control negative tour operators also have another specific focus on Russia media coverage, which results from complicated world as a destination for cruises. The positioning strategies of politics. Moreover, images have a considerable amount of the Russian tour operators are much broader and stability over time (Fakeye Crompton, 1991; Gartner geographically dispersed. Additionally, the Russian web- Hunt, 1987) and the larger the entity (like Russia), the sites place a much greater emphasis on Russia’s natural slower the image change (Gartner, 1993). However, features, and on special-interest travel activities beyond the through induced agents (including these websites), Russian country’s history, heritage, and culture. Since Russia is the tourism marketers can stress its positive features and world’s largest country measured in land area, there is address apprehensions that potential visitors might have
- 13. ARTICLE IN PRESS S. Stepchenkova, A.M. Morrison / Tourism Management 27 (2006) 943–956 955 about traveling there (Kale Weir, 1986). Although Doolin, B., Burgess, L., Cooper, J. (2002). Evaluating the use of the websites are fast becoming the major source of information Web for tourism marketing: A case study from New Zealand. Tourism Management, 23, 557–561. for travel planning and booking, other induced image Echtner, C. M. (2002). The content of Third World tourism marketing: A channels (sources of travel information) need to be 4A approach. The International Journal of Tourism Research, 4, analyzed. These include tour operator and destination 413–434. marketing brochures, media advertisements, and posters Echtner, C. M., Ritchie, J. R. B. (1991). The meaning and measurement and other display materials. of destination image. The Journal of Tourism Studies, 2(2), 2–12. The major contribution of this work is thought to be in Echtner, C. M., Ritchie, J. R. B. (1993). The measurement of destination image: An empirical assessment. Journal of Travel the uniqueness of the methodology applied, especially Research, 31(Spring), 3–13. through the development and application of the WOR- Fakeye, P., Crompton, J. (1991). Image differences between prospective, DER software. The methodology of combining CATPAC first-time, and repeat visitors to the Lower Rio Grande Valley. Journal and WORDER software allows for wider use of statistical of Travel Research, 30(2), 10–16. methods in the content analysis of textual materials. Fam, K. S., Foscht, T., Collins, R. D. (2004). Trust and the online relationship—an exploratory study from New Zealand. Tourism Textual files are treated as a sample of respondents and Management, 25, 195–207. frequencies of the variable of interest are identified in every Federal Tourism Agency of the Russian Federation (2004). Official file. Special issues of content analysis, such as different website at: www.russiatourism.ru. spelling of image variables, plural/singular, synonyms, and Gartner, W. C. (1989). Tourism image: Attribute measurement of state tourism products using multidimensional scaling techniques. Journal of multi-word concepts, are efficiently handled. The proposed Travel Research, 28(Fall), 16–20. procedure of identifying the frequencies of the image Gartner, W. C. (1993). Image formation process. Journal of Travel and variables in every single file of the textual sample allows the Tourism Marketing, 2, 191–216. further use of factor analysis to cluster variables into Gartner, W. C., Hunt, J. D. (1987). An analysis of state image change meaningful image themes of more holistic nature. Jenkins over a twelve-year period (1971–1983). Journal of Travel Research, (1999) wrote ‘‘there has been a strong preference for 16(Fall), 15–19. Goskomstat (2000). Tourism in figures. Annual report (in Russian). structured methods that concentrate on the attribute Govers, R., Go, F. M. (2003). Deconstructing destination image in the component of destination image.’’ The holistic component information age. Information Technology Tourism, 6, 13–29. has not received enough attention. This study addressed Gunn, C. A. (1972). Vacationscape: Designing tourist regions. Austin: this issue by identifying the induced image themes of a Bureau of Business Research, University of Texas. Heung, V. C. S. (2004). Internet usage by international travelers: Reasons holistic nature. and barriers. International Journal of Contemporary Hospitality Marketing, 15(7), 370–378. Acknowledgement Hunt, J. D. (1975). Image as a factor in tourism development. Journal of Travel Research, 13(Winter), 1–7. The authors would like to thank Dr. Andrei Kirilenko, ‘‘Izvestia’’ newspaper (March 11, 2003). A girl in the kokoshnik is the Purdue University, for writing the WORDER software for face of Russia. Last retrieved on March 24, 2005 from http://www. izvestia.ru/community/40642_print (in Russian). destination counting process. Jenkins, O. H. (1999). Understanding and measuring tourist destination images. The International Journal of Tourism Research, 1(1), 1–15. References Jeon, S. -M., Morrison, A. M. (2003). Americans’ perceptions (image) of South Korea as a travel destination. In Proceedings of the annual Ahmed, Z. U. (1991). The influence of the components of a state’s tourist graduate education and graduate student research conference in image on product positioning strategy. Tourism Management, Decem- hospitality and tourism: Vol. 8. Advances in Hospitality and Tourism ber, 331–340. Research (pp. 234–237). Andsager, J. L., Drzewiecka, J. A. (2002). Desirability of differences in Kale, S. H., Weir, K. M. (1986). Marketing third world countries to the destinations. Annals of Tourism Research, 29(2), 401–421. Western traveler: The case of India. Journal of Travel Research, 25, Assael, H. (1984). Consumer behavior and marketing action. Boston: Kent. 2–7. Baloglu, S., McCleary, K. W. (1999). A model of destination image Kim, S. -E., Xiang, Z., Hu, C., Fesenmaier, D. R. (2005). The degree of formation. Annals of Tourism Research, 26(4), 868–897. language congruence between consumer and restaurant websites: Baloglu, S., Pekcan, Y. A. (2006). The web design and Internet site Implications for developing online restaurant recommendation sys- marketing practices of upscale and luxury hotels in Turkey. Tourism tems. In The 10th annual hospitality and tourism graduate student Management, 27(1), 171–176. education and research conference proceedings. Breckler, S. J. (1984). Empirical validation of affect, behavior, and Kirilenko, A. P. (2004). WORDER (Version 2.0) [Computer software]. cognition as distinct components of attitude. Journal of Personality and http://web.ics.purdue.edu/$akirilen/worder; last accessed on July 29, Social Psychology, 47(6), 1191–1205. 2005. Chao, A. (1987). Estimating the population size for capture-recapture data Kline, P. (1994). An easy guide to factor analysis. New York: Routledge. with unequal catchability. Biometrics, 43, 783–791. Lawson, F., Baud-Bovy, M. (1977). Tourism and recreational Chu, R. (2001). What online Hong Kong travelers look for on airline/ development. London: Architectural Press. travel websites? Hospitality Management, 20, 95–100. MacKay, K. J., Fesenmaier, D. R. (1997). Pictorial element of Dann, G. M. S. (1996). The people of tourist brochures. In T. Selwyn destination in image formation. Annals of Tourism Research, 24, (Ed.), The tourist image: Myths and myth making in tourism (pp. 537–565. 61–81). Wiley: London. Morgan, N., Pritchard, A. (2001). Advertising in tourism and leisure. Doerfel, M. L., Marsh, P. S. (2003). Candidate-issue positioning in the Oxford: Butterworth-Heinemann. context of presidential debates. Journal of Applied Communication O’Connor, P., Murphy, J. (2004). Research on information technology Research, 31(3), 212–237. in the hospitality industry. Hospitality Management, 23, 473–484.
- 14. ARTICLE IN PRESS 956 S. Stepchenkova, A.M. Morrison / Tourism Management 27 (2006) 943–956 Oh, H., Kim, B.-Y., Shin, J.-H. (2004). Hospitality and tourism Schmidt, M. (1998). Quantitative analysis of qualitative interviews: marketing: Recent developments in research and future directions. Theoretical considerations and empirical analysis. Last retrieved March Hospitality Management, 23, 425–447. 22, 2005 from http://www.mic.cbs.dk/marcus/GBPapers/AMA98/ Oksanen, J. (2002). Extrapolated species richness in a species pool. MarcBos.htm. Retrieved February 13, 2005 from http://cc.oulu.fi/$jarioksa/ Schmidt, M (n.d.). Software review: CATPAC for windows. Last retrieved softhelp/vegan/html/specpool.html. May 20, 2005 from http://www.mic.cbs.dk/marcus/GBPapers/ + Ozturan, M., Roney, S. A. (2004). Internet use among travel 25_Tourism/25_Software%20review%20Catpac.htm. agencies in Turkey: An exploratory study. Tourism Management, 25, Stamboulis, Y., Skayannis, P. (2003). Innovation strategies and 259–266. technology for experience-based tourism. Tourism Management, 24, Pearce, P. L. (1988). The Ulysses factor: Evaluating visitors in tourist 35–43. settings. New York: Springer. Tapachai, N., Waryszak, R. (2000). An examination of the role of Pike, S. (2002). Destination image analysis—A review of 142 papers from beneficial image in tourist destination selection. Journal of Travel 1973 to 2000. Tourism Management, 23, 541–549. Research, 39(August), 37–44. Pike, S., Ryan, C. (2004). Destination positioning analysis through a White, C. J. (2004). Destination image: to see or not to see? International comparison of cognitive, affective, and conative perceptions. Journal Journal of Contemporary Hospitality Management, 16(5), 309–314. of Travel Research, 42(May), 333–342. Woelfel, J. (1998). CATPAC: Users guide. New York: RAH Press: The Pizam, A., Jafari, J., Milman, A. (1991). Influence of tourism on Galileo Company. attitudes: US students visiting USSR. Tourism Management, 12(1), World Tourism Organization (WTO) (2003). WTO News, issue 3. 47–54. Retrieved September 1, 2004 from http://www.world-tourism. Reilly, M. D. (1990). Free elicitation of descriptive adjectives for tourism org/newsroom/magazine/archives/3quarter2003/WTO%20NEWS%20 image assessment. Journal of Travel Research, 28(Spring), 21–26. INGLES%2032003.pdf. Russia’s Federal State Statistics Service (Rosstat) (2004). Tourism and World Tourism Organization (WTO) (2004). Inbound tourism—World’s tourist resources in Russia, official publication. Moscow, Russia: Top tourism destinations. Last retrieved on May 18, 2005 from http:// Publishing center: ‘‘Statistics of Russia’’ (in Russian). www.world-tourism.org/facts/tmt.html. Scharl, A., Wober, K. W., Bauer, C. (2004). An integrated approach to ¨ Yuan, Y., Gretzel, U., Fesenmaier, D. R. (2003). Internet technology measure web site effectiveness in the European hotel industry. use by American convention and visitors bureaus. Journal of Travel Information Technology Tourism, 6, 257–271. Research, 41(3), 240–255.