SlideShare uma empresa Scribd logo
1 de 80
PRESENTATION INDEX
OVERVIEW                                  MACAU
           FUTURE OUTLOOK                          ATTRACTIVE MARKET QUALITATIVE
           BUSINESS MODEL FULL                     ATTRACTIVE MARKET STATISTICS
           BUSINESS MODEL MAP                      DEAL STRUCTURE
                                                   WYNN MACAU PARTNERSHIP
ISSUES                                             WYNN MACAU MARKETING
           NEW MARKET ENTRY                        FINANCIAL GAIN
           CURRENT STRATEGY
                                          IMPLEMENTATION
ALEGRIA                                            TIMELINE
           BUSINESS MODEL SHIFT                    SUMMARY
           TOUR LOCATIONS DATES
           TOUR LOCATIONS MAP
           FINANCIAL GAINS

FRANCE
           ATTRACTIVE MARKET DISNEY
           ATTRACTIVE MARKET QUOTES
           ATTRACTIVE MARKET ATTENDANCE
           DEAL STRUCTURE
           DISNEYLAND MARKETING
           FINANCIAL GAIN
THE TRAPEZE STRATEGY
CIRQUE DU SOLEIL
 Diversifying Show Production & Geographic Expansion

Dark Horse Consulting
Fahad | Miata | Sascha | Derek


Team 7 – Simon Fraser University
STRATEGIC PATHWAY
                     “The TRAPEZE
                       Strategy”


 Overview   Issues                  Implementation
STRATEGIC PATHWAY
                        “The TRAPEZE
                          Strategy”

                         Alegria


 Overview   Issues     France          Implementation


                     Macau
FUTURE OUTLOOK
                            NPV OF INCREMENTAL PROFIT UNTIL 2022
                 $
                                      $167 M
     MACAU                                                   $114 M

    FRANCE                                        $26 M
   ALEGRIA                             $27 M
                            STATIC


OVERVIEW         ISSUES    ALEGRIA   FRANCE    MACAU   IMPLEMENTATION

FUTURE OUTLOOK    BUSINESS MODEL
BUSINESS MODEL 2008
                                            CIRQUE DU SOLEIL


       7         RESIDENTS              2        ARENA            6         BIG-TOP


       MYSTERE               LOVE            SALTIMBANCO          KOOZA               DRALION

           O              LA NOUBA             DELIRIUM           CORTEO              QURDAM

      ZUMANITY            WINTUK                                  VAREKAI             ALEGRIA

           KA


OVERVIEW         ISSUES       ALEGRIA       FRANCE        MACAU    IMPLEMENTATION

FUTURE OUTLOOK    BUSINESS MODEL
BUSINESS MODEL 2010
                                            CIRQUE DU SOLEIL


     13          RESIDENTS              1        ARENA           8          BIG-TOP


       MYSTERE               LOVE            SALTIMBANCO         KOOZA                DRALION

           O              LA NOUBA                               CORTEO               QURDAM

      ZUMANITY            WINTUK                                 VAREKAI              ALEGRIA

           KA                ELVIS                                   2009              2010

     CHRIS ANGEL             DUBAI

       MACAO #1           MACAO #2           TOKYO


OVERVIEW         ISSUES       ALEGRIA       FRANCE       MACAU    IMPLEMENTATION

FUTURE OUTLOOK     BUSINESS MODEL
BUSINESS MODEL 2010
                                        CIRQUE DU SOLEIL


                 RESIDENTS                   ARENA                     BIG-TOP


       MYSTERE               LOVE        SALTIMBANCO         KOOZA               DRALION

           O              LA NOUBA                           CORTEO              QURDAM

      ZUMANITY            WINTUK                             VAREKAI             ALEGRIA

           KA                ELVIS                            2009                2010

     CHRIS ANGEL             DUBAI

       MACAO #1           MACAO #2       TOKYO


OVERVIEW         ISSUES       ALEGRIA   FRANCE       MACAU    IMPLEMENTATION

FUTURE OUTLOOK     BUSINESS MODEL
BUSINESS MODEL 2010
                                        CIRQUE DU SOLEIL


                 RESIDENCE                   ARENA                         BIG-TOP


       MYSTERE               LOVE        SALTIMBANCO           KOOZA                 DRALION

           O
                                 1
                          LA NOUBA                             CORTEO                QURDAM


                          7 1                                                1
      ZUMANITY            WINTUK

                                                           1
                                                               VAREKAI
                                                                       2             ALEGRIA

           KA                ELVIS                              2009                  2010

     CHRIS ANGEL             DUBAI
     = Resident shows
       MACAO #1           MACAO #2       TOKYO


OVERVIEW         ISSUES       ALEGRIA   FRANCE       MACAU      IMPLEMENTATION

FUTURE OUTLOOK     BUSINESS MODEL
BUSINESS MODEL 2010
                                        CIRQUE DU SOLEIL


                 RESIDENCE                   ARENA         Berlin           BIG-TOP

                New York                                   London
       MYSTERE               LOVE        SALTIMBANCO       Paris KOOZA                DRALION

           O
                                 1
                          LA NOUBA                              CORTEO                QURDAM


                          7 1                                                 1
      ZUMANITY            WINTUK

                                                           1
                                                                VAREKAI
                                                                        2             ALEGRIA

           KA                ELVIS                               2009             Sydney
                                                                                    2010

     CHRIS ANGEL             DUBAI

       MACAO #1           MACAO #2       TOKYO


OVERVIEW         ISSUES       ALEGRIA   FRANCE       MACAU       IMPLEMENTATION

FUTURE OUTLOOK     BUSINESS MODEL
BUSINESS MODEL 2010
                                        CIRQUE DU SOLEIL


                 RESIDENCE                   ARENA         Berlin           BIG-TOP

                                                           London
       MYSTERE               LOVE        SALTIMBANCO       FranceKOOZA                DRALION

           O
                FUTURE UNCERTAINTY
                    1     LA NOUBA

                                1
                                                                CORTEO                QURDAM

      ZUMANITY
                          7 1
                          WINTUK                                VAREKAI
                                                                        2             ALEGRIA

           KA                ELVIS
                                                           1     2009             Australia
                                                                                    2010

     CHRIS ANGEL             DUBAI

       MACAO #1           MACAO #2       TOKYO


OVERVIEW         ISSUES       ALEGRIA   FRANCE       MACAU       IMPLEMENTATION

FUTURE OUTLOOK     BUSINESS MODEL
ISSUES
Today                                                                   Future


            FUTURE UNCERTAINTY


OVERVIEW     ISSUES      ALEGRIA      FRANCE   MACAU   IMPLEMENTATION

NEW MARKET ENTRY   CURRENT STRATEGY
NEW MARKET ENTRY
Today                                                                       Future
                      Successful Partnership Duplication
                         with New Projects in Correct
                                   Markets

                                      Successful Partner
                         MGM          Casino Market
                                      Resident Shows


OVERVIEW     ISSUES      ALEGRIA      FRANCE     MACAU     IMPLEMENTATION

NEW MARKET ENTRY   CURRENT STRATEGY
CURRENT STRATEGY
Today                                                                           Future
                          Under-utilization of Arena
                        Segment to Display Successful
                                 Strategy


                                               Creativity
                             Strategy          Theatricality
                                               Experience


OVERVIEW     ISSUES      ALEGRIA      FRANCE       MACAU       IMPLEMENTATION

NEW MARKET ENTRY   CURRENT STRATEGY
BUSINESS MODEL SHIFT

                                        1        ARENA           8          BIG-TOP


                                             SALTIMBANCO         KOOZA                DRALION

 -Set to retires Big Top tour in 2008                            CORTEO               QURDAM

 -Delirium retired April 18th 2008                               VAREKAI              ALEGRIA


 -Transition Alegria into arena tour                                 2009              2010
 immediately

 -Begin tour in Europe

 OVERVIEW       ISSUES       ALEGRIA        FRANCE       MACAU   IMPLEMENTATION

BUSINESS MODEL SHIFT   TOUR LOCATIONS   FINANCIAL GAIN
BUSINESS MODEL SHIFT

                                        2        ARENA            7          BIG-TOP


                                             SALTIMBANCO          KOOZA                DRALION

 -Set to retires Big Top tour in 2008           ALEGRIA           CORTEO               QURDAM

 -Delirium retired April 18th 2008                                VAREKAI


 -Transition Alegria into arena tour                                  2009              2010
 immediately

 -Begin tour in Europe

 OVERVIEW       ISSUES       ALEGRIA        FRANCE        MACAU   IMPLEMENTATION

BUSINESS MODEL SHIFT   TOUR LOCATIONS   FINANCIAL GAIN
TOUR LOCATIONS
                                            Paris, FR - From 15 March 2010 to 17 April 2010
                                            Birmingham, UK - From 24 February 2010 to 13 March 2010
                                            Manchester, UK - From 6 January 2010 to 27 January 2010
                                            Lille, FR - From 25 November 2010 to 26 December 2010
                                            Rome, IT - From 7 October 2010 to 31 October 2010
                                            Frankfurt, DE - From 20 August 2010 to 25 September 2010
                                            Gijon, ES - From 25 June 2010 to 31 July 2010
                                            Milan, IT - From 29 April 2010 to 6 June 2010
                                            Lyon, FR - From 5 March 2010 to 18 April 2010
                                            Seville, ES - From 16 January 2010 to 22 February 2010
                                            Valencia, ES - From 28 November 2009 to 21 December 2009
                                            Zurich, CH - From 19 September 2009 to 26 October 2009
                                            Oostende, CH - From 24 July 2009 to 17 August 2009
                                            Cologne, DE - From 5 June 2009 to 29 June 2009
                                            Geneva, CH - From 18 April 2009 to 25 May 2009
                                            Bilbao, ES - From 26 February 2009 to 6 April 2009
                                            London, UK - From 7 January 2009 to 6 February 2009
                                            Madrid, ES - From 31 October 2009 to 26 December 2009
                                            Brussels, BE - From 4 September 2009 to 19 October 2009
                                            Vienna, AT - From 10 July 2009 to 4 August 2009
                                            Barcelona, ES - From 26 April 2009 to 26 May 2009


 OVERVIEW       ISSUES       ALEGRIA       FRANCE           MACAU           IMPLEMENTATION

BUSINESS MODEL SHIFT   TOUR LOCATIONS   FINANCIAL GAIN
FINANCIAL GAIN
     $                                                                         $27 M

                                                                                 2009           2010         2011-2022
              $114 M                    Upfront Production Costs           -       4,000,000
                                        Scenic and Transport Equip.        -       6,000,000
                                        Ticket Sales                                            88,290,000      88,290,000
                                        Additional Merchandise                                   2,648,700       2,648,700
                                        Operating costs                                         76,518,000      76,518,000
               $26 M                    Royalty
                                        Net Income                         -      10,000,000
                                                                                                 8,829,000
                                                                                                 5,591,700
                                                                                                                 8,829,000
                                                                                                                 5,591,700


               $27 M                    NPV                                    $27,018,033.53

                                        Investment        $9,090,909.09          Annual ROI             6.55%
                                        Return           $36,108,942.62
               STATIC                   NPV ROI                297.20%
                                        Payback period           3 years


 OVERVIEW       ISSUES       ALEGRIA           FRANCE             MACAU             IMPLEMENTATION

BUSINESS MODEL SHIFT   TOUR LOCATIONS    FINANCIAL GAIN
ATTRACTIVE MARKET


OVERVIEW         ISSUES        ALEGRIA     FRANCE       MACAU        IMPLEMENTATION

           ATTRACTIVE MARKET    DEAL STRUCTURE   DISNEYLAND   FINANCIAL GAIN
ATTRACTIVE MARKET


OVERVIEW         ISSUES        ALEGRIA     FRANCE       MACAU        IMPLEMENTATION

           ATTRACTIVE MARKET    DEAL STRUCTURE   DISNEYLAND   FINANCIAL GAIN
ATTRACTIVE MARKET
                                          Cirque du Soleil at Disneyland Paris


                                             “In 2008, Disneyland Paris was the
                                             most visited attraction in Europe,
                                              receiving more visitors than the
                                                Louvre and the Eiffel Tower
                                                              combined”


OVERVIEW         ISSUES        ALEGRIA     FRANCE       MACAU        IMPLEMENTATION

           ATTRACTIVE MARKET    DEAL STRUCTURE   DISNEYLAND   FINANCIAL GAIN
ATTRACTIVE MARKET
                                          Cirque du Soleil at Disneyland Paris


                                             “From the moment I saw the show
                                            in LA until I finally made a deal with
                                              Guy Laliberte, I was obsessed by
                                                         Cirque du Soleil”
                                                                                 -Michael Eisner,
                                                                       President & CEO of Disney


OVERVIEW         ISSUES        ALEGRIA     FRANCE       MACAU        IMPLEMENTATION

           ATTRACTIVE MARKET    DEAL STRUCTURE   DISNEYLAND   FINANCIAL GAIN
ATTRACTIVE MARKET
                                          Cirque du Soleil at Disneyland Paris


                                                 “The French Institute Alliance
                                            Française (FIAF) in New York city will
                                               award the Trophée des arts to
                                             Cirque du Soleil at a gala awarded
                                               each year since 1992 to group
                                                     beloved by the French”


OVERVIEW         ISSUES        ALEGRIA     FRANCE       MACAU        IMPLEMENTATION

           ATTRACTIVE MARKET    DEAL STRUCTURE   DISNEYLAND   FINANCIAL GAIN
ATTRACTIVE MARKET
                                          Cirque du Soleil at Disneyland Paris


OVERVIEW         ISSUES        ALEGRIA     FRANCE       MACAU        IMPLEMENTATION

           ATTRACTIVE MARKET    DEAL STRUCTURE   DISNEYLAND   FINANCIAL GAIN
ATTRACTIVE MARKET
                                          Cirque du Soleil at Disneyland Paris


OVERVIEW         ISSUES        ALEGRIA     FRANCE       MACAU        IMPLEMENTATION

           ATTRACTIVE MARKET    DEAL STRUCTURE   DISNEYLAND   FINANCIAL GAIN
ATTRACTIVE MARKET
                                          Cirque du Soleil at Disneyland Paris


OVERVIEW         ISSUES        ALEGRIA     FRANCE       MACAU        IMPLEMENTATION

           ATTRACTIVE MARKET    DEAL STRUCTURE   DISNEYLAND   FINANCIAL GAIN
ATTRACTIVE MARKET
                                          Cirque du Soleil at Disneyland Paris


OVERVIEW         ISSUES        ALEGRIA     FRANCE       MACAU        IMPLEMENTATION

           ATTRACTIVE MARKET    DEAL STRUCTURE   DISNEYLAND   FINANCIAL GAIN
DEAL STRUCTURE

  -Structured after MGM partnership
                                                              Investment           $43,342,154.83
                                                              Return               $50,589,127.77
    -Disney to build theatre
                                                              NPV ROI                     14.33%
                                                              Payback Period               5 years
    -Split initial production costs (50/50)
                                                      -MGM has experienced average
    -Split operating profits (50/50)                  entertainment revenue increase of 23.37%
                                                      over last five years


OVERVIEW         ISSUES        ALEGRIA     FRANCE       MACAU            IMPLEMENTATION

           ATTRACTIVE MARKET    DEAL STRUCTURE   DISNEYLAND    FINANCIAL GAIN
DISNEYLAND
                                                                     Resident Theatre: Florida


           Tokyo                           Paris

OVERVIEW         ISSUES        ALEGRIA     FRANCE         MACAU        IMPLEMENTATION

           ATTRACTIVE MARKET    DEAL STRUCTURE     DISNEYLAND   FINANCIAL GAIN
DISNEYLAND
                                                                     Resident Theatre: Florida


                                                                Capacity utilized to
                                                                model financial gain


           Tokyo                           Paris

OVERVIEW         ISSUES        ALEGRIA     FRANCE         MACAU        IMPLEMENTATION

           ATTRACTIVE MARKET    DEAL STRUCTURE     DISNEYLAND   FINANCIAL GAIN
FINANCIAL GAIN
   $                                                                             $26 M
                                                                                    2009            2010       2011-2022
                                         Upfront Production Costs            -       15,000,000 - 15,000,000
              $114 M                     Ticket Sales                                                          59,892,000
                                         Creative Royalty                                                       7,785,960
                                         Rent                                                                   7,187,040
                                         Operating costs                                                       26,951,400
                                         Operating Profit - 100%             -       15,000,000 - 15,000,000   17,967,600
               $26 M                     Operating Profit - 50%
                                         Add: Merchandise Income
                                                                             -        7,500,000 - 7,500,000
                                                                                                           -
                                                                                                                8,983,800
                                                                                                                1,796,760
                                         Less: Costume Salary                         3,000,000    3,000,000    3,000,000
                                         Net Income                          -       10,500,000 - 10,500,000    7,780,560
               $27 M
                                         NPV                                      $25,590,362.02

               STATIC                    Investment        $18,223,140.50         Annual ROI               32.47%
                                         Return            $43,813,502.52
                                         NPV ROI                 140.43%
                                         Payback period            5 years


OVERVIEW         ISSUES        ALEGRIA         FRANCE          MACAU                IMPLEMENTATION

           ATTRACTIVE MARKET    DEAL STRUCTURE      DISNEYLAND          FINANCIAL GAIN
ATTRACTIVE MARKET


   Increasing Gaming                Vegas of the East               Established Presence
     Concessions (6)


OVERVIEW    ISSUES     ALEGRIA       FRANCE       MACAU        IMPLEMENTATION

             ATTRACTIVE MARKET   DEAL STRUCTURE   WYNN MACAU   FINANCIAL GAIN
ATTRACTIVE MARKET

                           Projected Annual Macau Tourists
               400,000,000
               350,000,000
               300,000,000
               250,000,000
               200,000,000
               150,000,000                                         Annual Macau
   Increasing Gaming                 Vegas of the East              Established Presence
                                                                   Tourists
               100,000,000
     Concessions (6)
                 50,000,000
                          -


OVERVIEW     ISSUES     ALEGRIA       FRANCE       MACAU        IMPLEMENTATION

              ATTRACTIVE MARKET   DEAL STRUCTURE   WYNN MACAU   FINANCIAL GAIN
DEAL STRUCTURE


-Similar results to MGM partnership, experienced
                                                             Investment                 $68,109,100.45
average revenue increases over last five years of:           Return                    $124,214,376.21
                                                             NPV ROI                           45.17%
  - Casino:                  12.92%                          Payback Period                    4 years
  - Food & Bev.:             23.03%
  - Entertainment:           23.37%


OVERVIEW      ISSUES      ALEGRIA       FRANCE       MACAU        IMPLEMENTATION

               ATTRACTIVE MARKET    DEAL STRUCTURE   WYNN MACAU       FINANCIAL GAIN
WYNN MACAU
                              Wynn Macau

                                                      -Owns 1/6 national gaming concessions

                                                      -Wynn left the newly formed MGM
                                                      Mirage in 2000
                              Wynn Encore
                                                      - Strong pre-existing relationship, Wynn
                                                      responsible for Cirque du Soleil initial
                                                      introduction into Las Vegas
   Steve Wynn


OVERVIEW        ISSUES     ALEGRIA       FRANCE         MACAU       IMPLEMENTATION

                 ATTRACTIVE MARKET   DEAL STRUCTURE    WYNN MACAU   FINANCIAL GAIN
WYNN MACAU


                        Tokyo                          Macau

OVERVIEW    ISSUES     ALEGRIA       FRANCE       MACAU        IMPLEMENTATION

             ATTRACTIVE MARKET   DEAL STRUCTURE   WYNN MACAU   FINANCIAL GAIN
FINANCIAL GAIN
   $                                                                $114 M
                                                                            2009            2010     2011 - 2022
                                    Upfront Production Costs         -       15,000,000 - 15,000,000
           $114 M                   Ticket Sales                                                     147,056,250
                                    Creative Royalty                                                  19,117,313
                                    Rent                                                              17,646,750
                                    Operating costs                                                   66,175,313
                                    Operating Profit - 100%          -       15,000,000 - 15,000,000  44,116,875
            $26 M                   Operating Profit - 50%
                                    Add: Merchandise Income
                                                                     -        7,500,000 - 7,500,000 22,058,438
                                                                                                   -   4,411,688
                                    Less: Costume Salary                      3,000,000    3,000,000   3,000,000
                                    Net Income                       -       10,500,000 - 10,500,000  23,470,125
            $27 M
                                    NPV                                  $113,940,660.16

            STATIC                  Investment         $18,223,140.50        Annual ROI         43.09%
                                    Return            $132,163,800.66
                                    NPV ROI                  625.25%
                                    Payback period             3 years


OVERVIEW     ISSUES     ALEGRIA        FRANCE            MACAU             IMPLEMENTATION

              ATTRACTIVE MARKET   DEAL STRUCTURE        WYNN MACAU           FINANCIAL GAIN
TIMELINE
            ALEGRIA

End Big Tent tour: Alegria
Transition Alegria: Big Top  Arena
Alegria Arena Tour: Europe *
Alegria Arena Tour: Australia*
Alegria Arena Tour New Cycle: N.A.


                                                    1         2               3        4
                                                             Years
*Refer to schedule in presentation


OVERVIEW            ISSUES            ALEGRIA   FRANCE   MACAU        IMPLEMENTATION

                                                                  TIMELINE   SUMMARY
TIMELINE
            FRANCE


Negotiate deal with Disney Paris
Construct Disney Paris theatre
Production: Amant de Rêve
Disneyland Paris: Amant de Rêve


                                                 1         2               3        4
                                                          Years


OVERVIEW            ISSUES         ALEGRIA   FRANCE   MACAU        IMPLEMENTATION

                                                               TIMELINE   SUMMARY
TIMELINE
            MACAU


Negotiate deal with Wynn Resort Ltd
Construct Wynn Macau Theatre
Production: Rouge
Wynn Macau: Rouge


                                                    1         2               3        4
                                                             Years


OVERVIEW            ISSUES            ALEGRIA   FRANCE   MACAU        IMPLEMENTATION

                                                                  TIMELINE   SUMMARY
SUMMARY
Today                                                                Future


           FUTURE UNCERTAINTY


OVERVIEW    ISSUES   ALEGRIA   FRANCE   MACAU       IMPLEMENTATION

                                                TIMELINE   SUMMARY
SUMMARY
Today                                                                Future


            ALEGRIA


OVERVIEW    ISSUES   ALEGRIA   FRANCE   MACAU       IMPLEMENTATION

                                                TIMELINE   SUMMARY
SUMMARY
Today                                                                Future


            ALEGRIA            FRANCE


OVERVIEW    ISSUES   ALEGRIA   FRANCE   MACAU       IMPLEMENTATION

                                                TIMELINE   SUMMARY
SUMMARY
Today                                                                Future


            ALEGRIA            FRANCE                MACAU


OVERVIEW    ISSUES   ALEGRIA   FRANCE   MACAU       IMPLEMENTATION

                                                TIMELINE   SUMMARY
THE TRAPEZE STRATEGY
NPV OF INCREMENTAL PROFIT UNTIL 2022
      $
                                   $167 M
 MACAU                                                $114 M

FRANCE                                        $26 M
ALEGRIA                               $27 M
                     STATIC


          Dark Horse Consulting
          Fahad | Sascha | Miata | Derek


     THANK-YOU! QUESTIONS?
SWOT
•Creativity/artistic expression                 •Creative platform extension failures
•Leveraging creative process                    •Unwilling to compromise their
•Ability to successfully manage partnerships    creativity/vision
•Maintained original vision/values              •Untapped market opportunities
•Product differentiation                        •Underutilization of Arena strategy


•Large number of possible partnerships         •Cannibalization of current Las Vegas
•Growth: current markets                       market
•Growth: Untapped markets                      •Competitors: Dragone
KEY SUCCESS FACTORS
NEW BUSINESS MODEL
                               CIRQUE DU SOLEIL


           RESIDENTS                ARENA                           BIG-TOP


 MYSTERE               LOVE     SALTIMBANCO                KOOZA              DRALION

    O             LA NOUBA        ALEGRIA                  CORTEO             QURDAM

ZUMANITY           WINTUK                              VAREKAI                 2010

    KA                 ELVIS                                                   2009

CHRIS ANGEL            DUBAI    WYNN


 MACAO #1         MACAO #2      TOKYO             FRANCE
BIG TOPS NVP COMPARISON
$      NPV OF INCREMENTAL PROFIT
                UNTIL 2022         Two Big Top touring shows
                                   are planned for launch in
                                   the next two years


                              MACAU
             ALEGRIA FRANCE
    BIG TOPS
                              $114 M
     $22 M   $27 M    $26 M
BIG TOPS FINANCIALS
                              NPV CALCULATION

                                       2009                   2010       2011 - 2022
Upfront Production Costs          -   15,000,000        -   15,000,000


Scenic and Transport Equip.       -    3,500,000        -   3,500,000


Big Top                           -    6,500,000        -   6,500,000
Ticket Sales                                                             30,375,000
Additional Merchandise                                                      911,250
Operating costs                                                          19,743,750
Net Income                        -   25,000,000        -   25,000,000   11,542,500


NPV                                    $21,609,122.20
BIG TOPS
          Big Tops Alternative
                  Conservative Assumptions - Macau
    Discount Rate                                    10.00%
    Upfront Production Costs ($ M)                       30
    Scenic and Transport. Equip. ($ M)                    7
    Big Top ($ M)                                        13
    Time for production (years)                           2
    Capacity (people)                                 2,500
    Weekly Performances                                   9
    Weeks                                                36
    Break-even occupancy                             65.00%
    Occupancy                                        75.00%
    Merchandise                                      10.00%
    Merchandise Margin                               30.00%
    Ticket Price ($)                                  50.00
WHY NOT BERLIN OR LONDON
                      Based on these factors

          France instead of Berlin or London: the country is
             very close in proximity to Berlin and London


          Cirque du Soleil always identifies solid partnerships
             before entering a market: entering these new
            markets without existing relationships could be
                                difficult
WHY NOT LAS VEGAS
                      Based on these factors
                Category size: Large; Category growth;
                  Low, Category attractiveness; High


            Increased number of shows = increased chance of
                           cannibalization
WHY NOT DISNEYLAND LOS ANGELES

                          Based on these factors
               Does not achieve the goal of creating a foothold in
                             a new foreign market


                  Already have one Disney Partnership: Walt
                         Disneyworld Resort, Florida
WHY NOT DUBAI (FURTHER)

                                                                          Lack of gambling makes replication of current
                       100
  Number of Tourists


                              82                                                    business model difficult
                        80
                        60
     (Millions)


                        40                                     France
                                       27
                        20                     5.5
                                                               Macau
                         0                                     Dubai
                              France
                                       Macau
                                               Dubai


                                                                          No presence of large scale amusement park to
                                                                            replicate the Disney theme park success


OVERVIEW                     ISSUES                  ALEGRIA      MACAU     FRANCE        IMPLEMENTATION

                                                                               TIMELINE   SUCCESS FACTORS
WHY NEW YORK IN THE FUTURE
                                                  Based on these factors
                                      Success of Zumanity indicator of potential resident
                                                       show success


                                      Market Potential: Demographics demonstrates that
                                        proportion of upper middle class individuals and
                                      other s have a long standing appreciation of the arts


OVERVIEW   ISSUES   ALEGRIA   MACAU         FRANCE        IMPLEMENTATION

                                              TIMELINE   SUCCESS FACTORS
WHY AUSTRALIA IN THE FUTURE

                                      With touring of Alegria, possibility for market
                                              evaluation for resident show


                                  Partnership opportunity with Sydney Opera House


OVERVIEW   ISSUES   ALEGRIA   MACAU       FRANCE        IMPLEMENTATION

                                            TIMELINE   SUCCESS FACTORS
FINANCIAL ASSUMPTIONS
         Arena Alegria
    Conservative Assumptions - Europe Arena Tour
  Discount Rate                                10.00%
  Upfront Production Costs ($ M)                     4
  Time for production (years)                        1
  Scenic and Transport. Equip. ($ M)                 6
  Capacity (people)                            10,000
  Weekly Performances                                6
  Weeks                                            36
  Break-even occupancy                         65.00%
  Royalty to Arena                             10.00%
  Occupancy                                    75.00%
  Merchandise                                  10.00%
  Merchandise Margin                           30.00%
  Ticket Price ($)                             54.50
ALEGRIA SENSITIVITY I
                                    Sensitivity Analysis - Alegria
            40,000,000.00


            35,000,000.00
                                                                            Prod. Costs
                                                                            Scenic
            30,000,000.00
                                                                            Capacity
Value ($)


                                                                            Weekly
            25,000,000.00                                                   Weeks
                                                                            Occ. Rate

            20,000,000.00                                                   Royalty
                                                                            Merch. Margin
                                                                            Ticket Price
            15,000,000.00
                            Worst              Conservative          Best
                                                Scenario
ALEGRIA SENSITIVITY II
                          Prod. Costs        Scenic         Capacity        Weekly          Weeks            Occ. Rate        Royalty       Merch. Margin    Ticket Price

Worst                    26,108,942.62    26,108,942.62   19,796,245.00   20,999,876.42   26,015,007.34 - 43,679,475.18 - 1,489,026.43      21,316,621.53   17,411,067.14

Conservative             27,018,033.53    27,018,033.53   27,018,033.53   27,018,033.53   27,018,033.53     27,018,033.53   27,018,033.53   27,018,033.53   27,018,033.53

Best                     28,836,215.34    27,927,124.43   34,239,822.05   33,036,190.63   29,024,085.89     97,715,542.23   55,525,093.49   32,719,445.52   30,662,055.26

 Production Costs                                                  Weekly Shows
 $2M                                     28,836,215.34 Best                                                  5      20,999,876.42 Worst
 $3M                                     27,927,124.43                                                       6      27,018,033.53 Cons
 $4M                                     27,018,033.53 Cons                                                  7      33,036,190.63 Best
 $5M                                     26,108,942.62 Worst
                                                                   Weeks
 Scenic and Transport.                                                                                     35       26,015,007.34 Worst
 $5M                                     27,927,124.43 Best                                                36       27,018,033.53 Cons
 $6M                                     27,018,033.53 Cons                                                37       28,021,059.71
 $7M                                     26,108,942.62 Worst                                               38       29,024,085.89 Best

 Capacity                                                          Occupancy
                          8000           19,796,245.00 Worst                                              0.65-    43,679,475.18 Worst
                          9000           23,407,139.26                                                     0.7-     8,330,720.83
                         10000           27,018,033.53 Cons                                               0.75     27,018,033.53 Cons
                         11000           30,628,927.79                                                     0.8     62,366,787.88
                         12000           34,239,822.05 Best                                               0.85     97,715,542.23 Best
ALEGRIA SENSITIVITY III
Royalty
                     0.05    55,525,093.49 Best
                      0.1    27,018,033.53 Cons
                     0.15-    1,489,026.43 Worst

Merchandise Margin
                      0.2    21,316,621.53 Worst
                     0.25    24,167,327.53
                      0.3    27,018,033.53 Cons.
                     0.35    29,868,739.52
                      0.4    32,719,445.52 Best

Ticket Price
                      40     17,411,067.14 Worst
                      45     20,723,814.17
                      50     24,036,561.20
                     54.5    27,018,033.53 Cons.
                      60     30,662,055.26 Best
FINANCIAL ASSUMPTIONS
 Disney France Resident
          Conservative Assumptions - Disney
 Discount Rate                                10.00%
 Upfront Production Costs ($ M)                    30
 Time for production (years)                        2
 Capacity (people)                              1,750
 Weekly Performances                               10
 Weeks                                             46
 Op. Costs                                    45.00%
 Creative Royalty                             13.00%
 Rent                                         12.00%
 Occupancy                                    93.00%
 Ticket Price                                      80
 Merchandise                                  10.00%
 Merchandise Margin                           30.00%
 Costume Staff                          3,000,000.00
FRANCE SENSITIVITY I
                                    Sensitivity Analysis - France
            40,000,000.00


            35,000,000.00                                                  Time for Prod.
                                                                           Capacity
            30,000,000.00                                                  Weekly Perf.
                                                                           Weeks
Value ($)


            25,000,000.00                                                  Op. Costs
                                                                           Creative Royalty
            20,000,000.00                                                  Rent
                                                                           Occ.
            15,000,000.00
                                                                           Ticket Price
                                                                           Merch. Margin
            10,000,000.00
                                                                           Cost. Staff
                            Worst             Conservative          Best
                                               Scenario
FRANCE SENSITIVITY II
                      Time for Prod. Capacity       Weekly Perf.   Weeks        Op. Costs     Creative Royalty Rent         Occ.          Ticket Price   Merch. Margin Cost. Staff

Worst                  18,073,036.7116,917,940.12 13,448,971.36 22,950,929.27 17,158,840.73 22,217,753.51     20,531,449.25 23,632,073.21 10,413,623.69 22,217,753.51 10,856,987.11

Conservative           25,590,362.0225,590,362.02 25,590,362.02 25,590,362.02 25,590,362.02 25,590,362.02     25,590,362.02 25,590,362.02 25,590,362.02 25,590,362.02 25,590,362.02

Best                   33,880,081.0334,262,783.93 37,731,752.69 28,229,794.78 34,021,883.32 30,649,274.80     28,962,970.54 26,895,887.90 40,767,100.35 28,647,541.83 40,323,736.94


                                                                           Weeks
Time for Production
                                                                                                                      44     22,950,929.27 Worst
                                   1            33,880,081.03 Best
                                                                                                                      45     24,270,645.65
                                   2            25,590,362.02 Cons                                                    46     25,590,362.02 Cons
                                   3            18,073,036.71 Worst                                                   47     26,910,078.40
                                                                                                                      48     28,229,794.78 Best
Capacity
                              1500              16,917,940.12 Worst        Op. Costs
                              1750              25,590,362.02 Cons                                                0.4        34,021,883.32 Best
                                                                                                                 0.45        25,590,362.02 Cons
                              2000              34,262,783.93 Best
                                                                                                                  0.5        17,158,840.73 Worst

Weekly Performances                                                        Creative Royalty
                                   8            13,448,971.36 Worst                                               0.1        30,649,274.80 Best
                                   9            19,519,666.69                                                    0.11        28,962,970.54
                                  10            25,590,362.02 Cons                                               0.12        27,276,666.28
                                  11            31,661,057.36                                                    0.13        25,590,362.02 Cons
                                                                                                                 0.14        23,904,057.77
                                  12            37,731,752.69 Best
                                                                                                                 0.15        22,217,753.51 Worst
FRANCE SENSITIVITY III
Rent                                             Merchandise Margin
                     0.1   28,962,970.54 Best                                 0.2   22,217,753.51   Worst
                    0.11   27,276,666.28                                      0.3   25,590,362.02   Cons
                    0.12   25,590,362.02 Cons                                 0.4   28,647,541.83   Best
                    0.13   23,904,057.77
                    0.14   22,217,753.51         Costume Staff
                    0.15   20,531,449.25 Worst                        1,000,000     40,323,736.94   Best
                                                                      2,000,000     32,957,049.48
Occupancy                                                             3,000,000     25,590,362.02   Cons
                     0.9   23,632,073.21 Worst                        4,000,000     18,223,674.57
                                                                      5,000,000     10,856,987.11   Worst
                    0.91   24,284,836.15
                    0.92   24,937,599.09
                    0.93   25,590,362.02 Cons
                    0.94   26,243,124.96
                    0.95   26,895,887.90 Best

Ticket Price
                     60    10,413,623.69 Worst
                     70     $18,001,992.86
                     80    25,590,362.02 Cons
                     90    33,178,731.19
                    100    40,767,100.35 Best
FINANCIAL ASSUMPTIONS

Macau Resident Alternative
             Conservative Assumptions - Macau
 Discount Rate                                     10.00%
 Upfront Production Costs ($ M)                        30
 Time for production (years)                             2
 Capacity (people)                                  2,750
 Weekly Performances                                   10
 Weeks                                                 46
 Op. Costs                                         45.00%
 Creative Royalty                                  13.00%
 Rent                                              12.00%
 Occupancy                                         93.00%
 Ticket Price                                         125
 Merchandise                                       10.00%
 Merchandise Margin                                30.00%
 Costume Staff                              3,000,000.00
MACAU SENSITIVITY I
                                Sensitivity Analysis - Macau
            160,000,000.00

            150,000,000.00
                                                                 Time for Prod.
            140,000,000.00
                                                                 Capacity
            130,000,000.00
                                                                 Weekly Perf.
            120,000,000.00
                                                                 Weeks
Value ($)


            110,000,000.00                                       Op. Costs
            100,000,000.00                                       Creative Royalty

             90,000,000.00                                       Rent
                                                                 Occ.
             80,000,000.00
                                                                 Ticket Price
             70,000,000.00
                                                                 Merch. Margin
             60,000,000.00                                       Cost. Staff
                             Worst        Conservative    Best
                                           Scenario
MACAU SENSITIVITY II
                      Time for Prod.    Capacity      Weekly Perf.   Weeks           Op. Costs       Creative Royalty Rent          Occ.            Ticket Price    Merch. Margin   Cost. Staff
Worst                     94,635,532.44 73,288,682.49   84,129,209.87 107,459,910.10   93,238,264.13   105,659,701.75 101,519,222.54 109,132,361.73    84,129,209.87 105,659,701.75   99,207,285.25
Conservative             113,940,660.16 113,940,660.16 113,940,660.16 113,940,660.16 113,940,660.16    113,940,660.16 113,940,660.16 113,940,660.16 113,940,660.16 113,940,660.16 113,940,660.16
Best                     135,196,961.81 154,592,637.83 143,752,110.45 120,421,410.22 134,643,056.20    126,362,097.78 122,221,618.58 117,146,192.45 143,752,110.45 122,221,618.58 128,674,035.07


Time for Production                                                                    Weeks
                                           1        135,196,961.81           Best                                                           44        107,459,910.10            Worst
                                           2        113,940,660.16           Cons                                                           45        110,700,285.13
                                           3         94,635,532.44           Worst                                                          46        113,940,660.16            Cons
                                                                                                                                            47        117,181,035.19
Capacity                                                                                                                                    48        120,421,410.22            Best
                                      2000           73,288,682.49           Worst
                                      2250           86,839,341.71                     Op. Costs
                                      2500          100,390,000.94                                                                         0.4        134,643,056.20            Best
                                      2750          113,940,660.16           Cons                                                         0.45        113,940,660.16            Cons
                                      3000          127,491,319.38                                                                         0.5         93,238,264.13            Worst
                                      3250          141,041,978.61
                                      3500          154,592,637.83           Best      Creative Royalty
                                                                                                                                           0.1        126,362,097.78            Best
Weekly Performances                                                                                                                       0.11        122,221,618.58
                                           8         84,129,209.87           Worst                                                        0.12        118,081,139.37
                                           9         99,034,935.02                                                                        0.13        113,940,660.16            Cons
                                          10        113,940,660.16           Cons                                                         0.14        109,800,180.95
                                          11        128,846,385.31                                                                        0.15        105,659,701.75            Worst
                                          12        143,752,110.45           Best
MACAU SENSITIVITY III
Rent                                               Merchandise Margin
                    0.1   122,221,618.58   Best                                     0.2   105,659,701.75   Worst
                   0.11   118,081,139.37
                   0.12   113,940,660.16   Cons                                     0.3   113,940,660.16   Cons
                   0.13   109,800,180.95                                            0.4   122,221,618.58   Best
                   0.14   105,659,701.75
                   0.15   101,519,222.54   Worst   Costume Staff
Occupancy                                                               1,000,000         128,674,035.07   Best
                    0.9   109,132,361.73   Worst                        2,000,000         121,307,347.62
                   0.91   110,735,127.87
                   0.92   112,337,894.02                                3,000,000         113,940,660.16   Cons
                   0.93   113,940,660.16   Cons                         4,000,000         106,573,972.70
                   0.94   115,543,426.31                                5,000,000          99,207,285.25   Worst
                   0.95   117,146,192.45   Best

Ticket Price
                   100     84,129,209.87   Worst
                   110     96,053,789.99
                   120    107,978,370.10
                   125    113,940,660.16   Cons
                   130    119,902,950.22
                   140    131,827,530.34
                   150    143,752,110.45   Best
AUSTRALIA TOUR DATES


    Sydney, AU - From 7 January 2011
    Perth, AU - From 9 September 2010
    Adelaide, AU - From 21 July 2010
    Brisbane, AU - From 28 May 2010
    Melbourne, AU - From 2 April 2010
MGM BENEFITS

                2003   2004     2005     2006     2007    Average


Casino                 2.13%   32.86%   13.24%    3.47%   12.92%
Food & Bev.            6.63%   57.49%   16.69%   11.31%   23.03%
Entertainment          4.92%   58.67%    7.81%   22.07%   23.37%
THEATRE CONSTRUCTION
            Name      Location     Capacity (seats)     Construction costs ($M)         Year          Cost/Person


Kodak                LA                          3100                             95           2001       30,645.16

Colosseum            LV                          4100                             95           2003       23,170.73

Aqua                 LV                          3000                             100          2005       33,333.33

Wynn                 LV                          1200                             40           2005       33,333.33

Arts (planned)       UCONN                       800                              65           2005       81,250.00

Phantom              LV                          1800                             40           2006       22,222.22


Average                                  2,333.33                                                         37,325.80


Average (no UCONN)                       2,640.00                                                         28,540.96


                     Production costs included
TICKET PRICE CALCULATION
      Saltimbanco Tour Plan Spring/Summer 2008

      (Assume all prices in USD)

                                Low            High
      Level 3-2                          40               60
      Level 1-0                          70               90

      Number of Shows                    118

      Price Breakdown
      Level                     Amount         Percent         Allocation
                            0            90              10%                9
                            1            70              15%             10.5
                            2            60              25%               15
                            3            40              50%               20
                                                                  $     54.50
MACAU TOURIST CALCULATION
Tourism Data
                                                   Tourism Projection
Jan - April 2008                                   Average 3 Year Growth            0.1887
                                    12 mos.
Tourists                9 995 006       29985018                                     2009        2010              2011          2012
Incr. Over last year        16.28                  Tourists                    35,642,361 42,367,087         50,360,583    59,862,231

Jan - Dec 2007
                                                               2013          2014               2015              2016           2017
                                                         71,156,576    84,581,852        100,540,105       119,509,239    142,057,323
Tourists               27 003 370
Incr. Over last year        22.75
                                                                2018              2019              2020            2021        2022
                                                         168,859,606       200,718,738       238,588,806     283,603,907 337,112,112
Jan - Dec 2006

Tourists               21 998 122
Incr. Over last year        17.57
RISK AND MITIGATION

           Risk                              Mitigation
           LV Sands partnership              -Not an exclusive partnership
           problems                          with LV Sands, still providing
                                             top quality show
           Disney refuses to build           -Locate new Parisian partner,
           exclusive theatre                 to be determined
           Wynn refuses to build             -Enter Macau with exclusive
           exclusive theatre                 MGM Grand deal
           Alegria cannot transition into    -Develop new arena show,
           arena format                      delay timeline as necessary


OVERVIEW   ISSUES      ALEGRIA       MACAU       FRANCE       IMPLEMENTATION

                                                   TIMELINE   SUCCESS FACTORS
SUCCESS INDICATORS

           Success Indicators
           Payback period for each project achieved, as indicated
           Break-even for each recommendation after April 2009
           NPV ROI ≥ 0.00%


OVERVIEW     ISSUES     ALEGRIA      MACAU       FRANCE       IMPLEMENTATION

                                                   TIMELINE   SUCCESS FACTORS
BACK-UP INDEX
ANALYSIS                             FRANCE
           SWOT                                FINANCIAL ASSSUMPTIONS
           KEY SUCCESS FACTORS                 SENSITIVITY ANALYSIS
           BUSINESS MODEL
                                     MACAU
ALTERNATIVES                                   FINANCIAL ASSUMPTIONS
          BIG TOPS NPV COMPARISON              SENSITIVITY ANALYSIS
          BIG TOPS NPV CALCULATION
          BIG TOPS ASSUMPTIONS       MISCELLANEOUS
                                               AUSTRALIA TOUR DATES
           BERLIN OR LONDON                    MGM BENEFITS
           LAS VEGAS                           THEATRE CONSTRUCTION
           DISNEYLAND LOS ANGELAS              TICKET PRICE CALCULATION
           DUBAI                               MACAU TOURIST CALUCLATION
                                               RISK & MITIGATIONS
FUTURE OUTLOOK                                 SUCCESS INDICATORS
          NEW YORK
          AUSTRALIA

ALEGRIA
           FINANCIAL ASSUMPTIONS
           SENSITIVITY ANALYSIS

Mais conteúdo relacionado

Destaque (8)

MMICC 2009 - 1st Place - USC
MMICC 2009 - 1st Place - USCMMICC 2009 - 1st Place - USC
MMICC 2009 - 1st Place - USC
 
MMICC 2009 - 3rd Place - UC Berkeley
MMICC 2009 - 3rd Place - UC BerkeleyMMICC 2009 - 3rd Place - UC Berkeley
MMICC 2009 - 3rd Place - UC Berkeley
 
MMICC 2010 - 1st Place - THM
MMICC 2010 - 1st Place - THMMMICC 2010 - 1st Place - THM
MMICC 2010 - 1st Place - THM
 
MM Cirque du Soleil Case_Group_3_Sec_b
MM Cirque du Soleil Case_Group_3_Sec_bMM Cirque du Soleil Case_Group_3_Sec_b
MM Cirque du Soleil Case_Group_3_Sec_b
 
2007 2nd Place
2007 2nd Place2007 2nd Place
2007 2nd Place
 
MMICC 2010 - 3rd Place - PEN
MMICC 2010 - 3rd Place - PENMMICC 2010 - 3rd Place - PEN
MMICC 2010 - 3rd Place - PEN
 
MMICC 2010 - 2nd Place - HKU
MMICC 2010 - 2nd Place - HKUMMICC 2010 - 2nd Place - HKU
MMICC 2010 - 2nd Place - HKU
 
Deloitte Case Competition 2013
Deloitte Case Competition 2013Deloitte Case Competition 2013
Deloitte Case Competition 2013
 

Mais de McGill Management International Case Competition

Mais de McGill Management International Case Competition (16)

MMICC 2009 Rules Briefing
MMICC 2009 Rules BriefingMMICC 2009 Rules Briefing
MMICC 2009 Rules Briefing
 
2006 1st Place Thammasat University
2006 1st Place Thammasat University2006 1st Place Thammasat University
2006 1st Place Thammasat University
 
2006 3rd Place Peking University
2006 3rd Place Peking University2006 3rd Place Peking University
2006 3rd Place Peking University
 
2007 3rd Place
2007 3rd Place2007 3rd Place
2007 3rd Place
 
2008 2nd Place
2008 2nd Place2008 2nd Place
2008 2nd Place
 
2008 3rd Place
2008 3rd Place2008 3rd Place
2008 3rd Place
 
2008 1st Place
2008 1st Place2008 1st Place
2008 1st Place
 
2008 1st Place
2008 1st Place2008 1st Place
2008 1st Place
 
2008 3rd Place
2008 3rd Place2008 3rd Place
2008 3rd Place
 
2008 2nd Place
2008 2nd Place2008 2nd Place
2008 2nd Place
 
2006 1st Place
2006 1st Place2006 1st Place
2006 1st Place
 
Knowledge Management @ Ogilvy Renault
Knowledge Management @ Ogilvy RenaultKnowledge Management @ Ogilvy Renault
Knowledge Management @ Ogilvy Renault
 
MMICC '08 Ambassadors Team First Meeting
MMICC '08 Ambassadors Team First MeetingMMICC '08 Ambassadors Team First Meeting
MMICC '08 Ambassadors Team First Meeting
 
MMICC 2008 Ambassadors Team
MMICC 2008 Ambassadors TeamMMICC 2008 Ambassadors Team
MMICC 2008 Ambassadors Team
 
2007 1st Place
2007 1st Place2007 1st Place
2007 1st Place
 
MMICC 2007 Rules
MMICC 2007 RulesMMICC 2007 Rules
MMICC 2007 Rules
 

Cirque du Soleil's Strategic Pathway to Growth

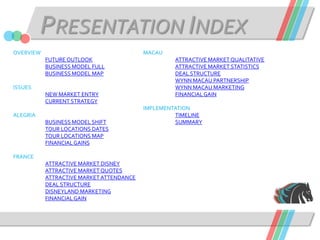
  • 1. PRESENTATION INDEX OVERVIEW MACAU FUTURE OUTLOOK ATTRACTIVE MARKET QUALITATIVE BUSINESS MODEL FULL ATTRACTIVE MARKET STATISTICS BUSINESS MODEL MAP DEAL STRUCTURE WYNN MACAU PARTNERSHIP ISSUES WYNN MACAU MARKETING NEW MARKET ENTRY FINANCIAL GAIN CURRENT STRATEGY IMPLEMENTATION ALEGRIA TIMELINE BUSINESS MODEL SHIFT SUMMARY TOUR LOCATIONS DATES TOUR LOCATIONS MAP FINANCIAL GAINS FRANCE ATTRACTIVE MARKET DISNEY ATTRACTIVE MARKET QUOTES ATTRACTIVE MARKET ATTENDANCE DEAL STRUCTURE DISNEYLAND MARKETING FINANCIAL GAIN
  • 3. CIRQUE DU SOLEIL Diversifying Show Production & Geographic Expansion Dark Horse Consulting Fahad | Miata | Sascha | Derek Team 7 – Simon Fraser University
  • 4. STRATEGIC PATHWAY “The TRAPEZE Strategy” Overview Issues Implementation
  • 5. STRATEGIC PATHWAY “The TRAPEZE Strategy” Alegria Overview Issues France Implementation Macau
  • 6. FUTURE OUTLOOK NPV OF INCREMENTAL PROFIT UNTIL 2022 $ $167 M MACAU $114 M FRANCE $26 M ALEGRIA $27 M STATIC OVERVIEW ISSUES ALEGRIA FRANCE MACAU IMPLEMENTATION FUTURE OUTLOOK BUSINESS MODEL
  • 7. BUSINESS MODEL 2008 CIRQUE DU SOLEIL 7 RESIDENTS 2 ARENA 6 BIG-TOP MYSTERE LOVE SALTIMBANCO KOOZA DRALION O LA NOUBA DELIRIUM CORTEO QURDAM ZUMANITY WINTUK VAREKAI ALEGRIA KA OVERVIEW ISSUES ALEGRIA FRANCE MACAU IMPLEMENTATION FUTURE OUTLOOK BUSINESS MODEL
  • 8. BUSINESS MODEL 2010 CIRQUE DU SOLEIL 13 RESIDENTS 1 ARENA 8 BIG-TOP MYSTERE LOVE SALTIMBANCO KOOZA DRALION O LA NOUBA CORTEO QURDAM ZUMANITY WINTUK VAREKAI ALEGRIA KA ELVIS 2009 2010 CHRIS ANGEL DUBAI MACAO #1 MACAO #2 TOKYO OVERVIEW ISSUES ALEGRIA FRANCE MACAU IMPLEMENTATION FUTURE OUTLOOK BUSINESS MODEL
  • 9. BUSINESS MODEL 2010 CIRQUE DU SOLEIL RESIDENTS ARENA BIG-TOP MYSTERE LOVE SALTIMBANCO KOOZA DRALION O LA NOUBA CORTEO QURDAM ZUMANITY WINTUK VAREKAI ALEGRIA KA ELVIS 2009 2010 CHRIS ANGEL DUBAI MACAO #1 MACAO #2 TOKYO OVERVIEW ISSUES ALEGRIA FRANCE MACAU IMPLEMENTATION FUTURE OUTLOOK BUSINESS MODEL
  • 10. BUSINESS MODEL 2010 CIRQUE DU SOLEIL RESIDENCE ARENA BIG-TOP MYSTERE LOVE SALTIMBANCO KOOZA DRALION O 1 LA NOUBA CORTEO QURDAM 7 1 1 ZUMANITY WINTUK 1 VAREKAI 2 ALEGRIA KA ELVIS 2009 2010 CHRIS ANGEL DUBAI = Resident shows MACAO #1 MACAO #2 TOKYO OVERVIEW ISSUES ALEGRIA FRANCE MACAU IMPLEMENTATION FUTURE OUTLOOK BUSINESS MODEL
  • 11. BUSINESS MODEL 2010 CIRQUE DU SOLEIL RESIDENCE ARENA Berlin BIG-TOP New York London MYSTERE LOVE SALTIMBANCO Paris KOOZA DRALION O 1 LA NOUBA CORTEO QURDAM 7 1 1 ZUMANITY WINTUK 1 VAREKAI 2 ALEGRIA KA ELVIS 2009 Sydney 2010 CHRIS ANGEL DUBAI MACAO #1 MACAO #2 TOKYO OVERVIEW ISSUES ALEGRIA FRANCE MACAU IMPLEMENTATION FUTURE OUTLOOK BUSINESS MODEL
  • 12. BUSINESS MODEL 2010 CIRQUE DU SOLEIL RESIDENCE ARENA Berlin BIG-TOP London MYSTERE LOVE SALTIMBANCO FranceKOOZA DRALION O FUTURE UNCERTAINTY 1 LA NOUBA 1 CORTEO QURDAM ZUMANITY 7 1 WINTUK VAREKAI 2 ALEGRIA KA ELVIS 1 2009 Australia 2010 CHRIS ANGEL DUBAI MACAO #1 MACAO #2 TOKYO OVERVIEW ISSUES ALEGRIA FRANCE MACAU IMPLEMENTATION FUTURE OUTLOOK BUSINESS MODEL
  • 13. ISSUES Today Future FUTURE UNCERTAINTY OVERVIEW ISSUES ALEGRIA FRANCE MACAU IMPLEMENTATION NEW MARKET ENTRY CURRENT STRATEGY
  • 14. NEW MARKET ENTRY Today Future Successful Partnership Duplication with New Projects in Correct Markets Successful Partner MGM Casino Market Resident Shows OVERVIEW ISSUES ALEGRIA FRANCE MACAU IMPLEMENTATION NEW MARKET ENTRY CURRENT STRATEGY
  • 15. CURRENT STRATEGY Today Future Under-utilization of Arena Segment to Display Successful Strategy Creativity Strategy Theatricality Experience OVERVIEW ISSUES ALEGRIA FRANCE MACAU IMPLEMENTATION NEW MARKET ENTRY CURRENT STRATEGY
  • 16. BUSINESS MODEL SHIFT 1 ARENA 8 BIG-TOP SALTIMBANCO KOOZA DRALION -Set to retires Big Top tour in 2008 CORTEO QURDAM -Delirium retired April 18th 2008 VAREKAI ALEGRIA -Transition Alegria into arena tour 2009 2010 immediately -Begin tour in Europe OVERVIEW ISSUES ALEGRIA FRANCE MACAU IMPLEMENTATION BUSINESS MODEL SHIFT TOUR LOCATIONS FINANCIAL GAIN
  • 17. BUSINESS MODEL SHIFT 2 ARENA 7 BIG-TOP SALTIMBANCO KOOZA DRALION -Set to retires Big Top tour in 2008 ALEGRIA CORTEO QURDAM -Delirium retired April 18th 2008 VAREKAI -Transition Alegria into arena tour 2009 2010 immediately -Begin tour in Europe OVERVIEW ISSUES ALEGRIA FRANCE MACAU IMPLEMENTATION BUSINESS MODEL SHIFT TOUR LOCATIONS FINANCIAL GAIN
  • 18. TOUR LOCATIONS Paris, FR - From 15 March 2010 to 17 April 2010 Birmingham, UK - From 24 February 2010 to 13 March 2010 Manchester, UK - From 6 January 2010 to 27 January 2010 Lille, FR - From 25 November 2010 to 26 December 2010 Rome, IT - From 7 October 2010 to 31 October 2010 Frankfurt, DE - From 20 August 2010 to 25 September 2010 Gijon, ES - From 25 June 2010 to 31 July 2010 Milan, IT - From 29 April 2010 to 6 June 2010 Lyon, FR - From 5 March 2010 to 18 April 2010 Seville, ES - From 16 January 2010 to 22 February 2010 Valencia, ES - From 28 November 2009 to 21 December 2009 Zurich, CH - From 19 September 2009 to 26 October 2009 Oostende, CH - From 24 July 2009 to 17 August 2009 Cologne, DE - From 5 June 2009 to 29 June 2009 Geneva, CH - From 18 April 2009 to 25 May 2009 Bilbao, ES - From 26 February 2009 to 6 April 2009 London, UK - From 7 January 2009 to 6 February 2009 Madrid, ES - From 31 October 2009 to 26 December 2009 Brussels, BE - From 4 September 2009 to 19 October 2009 Vienna, AT - From 10 July 2009 to 4 August 2009 Barcelona, ES - From 26 April 2009 to 26 May 2009 OVERVIEW ISSUES ALEGRIA FRANCE MACAU IMPLEMENTATION BUSINESS MODEL SHIFT TOUR LOCATIONS FINANCIAL GAIN
  • 19. TOUR LOCATIONS Paris, FR - From 15 March 2010 to 17 April 2010 Birmingham, UK - From 24 February 2010 to 13 March 2010 Manchester, UK - From 6 January 2010 to 27 January 2010 Lille, FR - From 25 November 2010 to 26 December 2010 Rome, IT - From 7 October 2010 to 31 October 2010 Frankfurt, DE - From 20 August 2010 to 25 September 2010 Gijon, ES - From 25 June 2010 to 31 July 2010 Milan, IT - From 29 April 2010 to 6 June 2010 Lyon, FR - From 5 March 2010 to 18 April 2010 Seville, ES - From 16 January 2010 to 22 February 2010 Valencia, ES - From 28 November 2009 to 21 December 2009 Zurich, CH - From 19 September 2009 to 26 October 2009 Oostende, CH - From 24 July 2009 to 17 August 2009 Cologne, DE - From 5 June 2009 to 29 June 2009 Geneva, CH - From 18 April 2009 to 25 May 2009 Bilbao, ES - From 26 February 2009 to 6 April 2009 London, UK - From 7 January 2009 to 6 February 2009 Madrid, ES - From 31 October 2009 to 26 December 2009 Brussels, BE - From 4 September 2009 to 19 October 2009 Vienna, AT - From 10 July 2009 to 4 August 2009 Barcelona, ES - From 26 April 2009 to 26 May 2009 OVERVIEW ISSUES ALEGRIA FRANCE MACAU IMPLEMENTATION BUSINESS MODEL SHIFT TOUR LOCATIONS FINANCIAL GAIN
  • 20. FINANCIAL GAIN $ $27 M 2009 2010 2011-2022 $114 M Upfront Production Costs - 4,000,000 Scenic and Transport Equip. - 6,000,000 Ticket Sales 88,290,000 88,290,000 Additional Merchandise 2,648,700 2,648,700 Operating costs 76,518,000 76,518,000 $26 M Royalty Net Income - 10,000,000 8,829,000 5,591,700 8,829,000 5,591,700 $27 M NPV $27,018,033.53 Investment $9,090,909.09 Annual ROI 6.55% Return $36,108,942.62 STATIC NPV ROI 297.20% Payback period 3 years OVERVIEW ISSUES ALEGRIA FRANCE MACAU IMPLEMENTATION BUSINESS MODEL SHIFT TOUR LOCATIONS FINANCIAL GAIN
  • 21. ATTRACTIVE MARKET OVERVIEW ISSUES ALEGRIA FRANCE MACAU IMPLEMENTATION ATTRACTIVE MARKET DEAL STRUCTURE DISNEYLAND FINANCIAL GAIN
  • 22. ATTRACTIVE MARKET OVERVIEW ISSUES ALEGRIA FRANCE MACAU IMPLEMENTATION ATTRACTIVE MARKET DEAL STRUCTURE DISNEYLAND FINANCIAL GAIN
  • 23. ATTRACTIVE MARKET Cirque du Soleil at Disneyland Paris “In 2008, Disneyland Paris was the most visited attraction in Europe, receiving more visitors than the Louvre and the Eiffel Tower combined” OVERVIEW ISSUES ALEGRIA FRANCE MACAU IMPLEMENTATION ATTRACTIVE MARKET DEAL STRUCTURE DISNEYLAND FINANCIAL GAIN
  • 24. ATTRACTIVE MARKET Cirque du Soleil at Disneyland Paris “From the moment I saw the show in LA until I finally made a deal with Guy Laliberte, I was obsessed by Cirque du Soleil” -Michael Eisner, President & CEO of Disney OVERVIEW ISSUES ALEGRIA FRANCE MACAU IMPLEMENTATION ATTRACTIVE MARKET DEAL STRUCTURE DISNEYLAND FINANCIAL GAIN
  • 25. ATTRACTIVE MARKET Cirque du Soleil at Disneyland Paris “The French Institute Alliance Française (FIAF) in New York city will award the Trophée des arts to Cirque du Soleil at a gala awarded each year since 1992 to group beloved by the French” OVERVIEW ISSUES ALEGRIA FRANCE MACAU IMPLEMENTATION ATTRACTIVE MARKET DEAL STRUCTURE DISNEYLAND FINANCIAL GAIN
  • 26. ATTRACTIVE MARKET Cirque du Soleil at Disneyland Paris OVERVIEW ISSUES ALEGRIA FRANCE MACAU IMPLEMENTATION ATTRACTIVE MARKET DEAL STRUCTURE DISNEYLAND FINANCIAL GAIN
  • 27. ATTRACTIVE MARKET Cirque du Soleil at Disneyland Paris OVERVIEW ISSUES ALEGRIA FRANCE MACAU IMPLEMENTATION ATTRACTIVE MARKET DEAL STRUCTURE DISNEYLAND FINANCIAL GAIN
  • 28. ATTRACTIVE MARKET Cirque du Soleil at Disneyland Paris OVERVIEW ISSUES ALEGRIA FRANCE MACAU IMPLEMENTATION ATTRACTIVE MARKET DEAL STRUCTURE DISNEYLAND FINANCIAL GAIN
  • 29. ATTRACTIVE MARKET Cirque du Soleil at Disneyland Paris OVERVIEW ISSUES ALEGRIA FRANCE MACAU IMPLEMENTATION ATTRACTIVE MARKET DEAL STRUCTURE DISNEYLAND FINANCIAL GAIN
  • 30. DEAL STRUCTURE -Structured after MGM partnership Investment $43,342,154.83 Return $50,589,127.77 -Disney to build theatre NPV ROI 14.33% Payback Period 5 years -Split initial production costs (50/50) -MGM has experienced average -Split operating profits (50/50) entertainment revenue increase of 23.37% over last five years OVERVIEW ISSUES ALEGRIA FRANCE MACAU IMPLEMENTATION ATTRACTIVE MARKET DEAL STRUCTURE DISNEYLAND FINANCIAL GAIN
  • 31. DISNEYLAND Resident Theatre: Florida Tokyo Paris OVERVIEW ISSUES ALEGRIA FRANCE MACAU IMPLEMENTATION ATTRACTIVE MARKET DEAL STRUCTURE DISNEYLAND FINANCIAL GAIN
  • 32. DISNEYLAND Resident Theatre: Florida Capacity utilized to model financial gain Tokyo Paris OVERVIEW ISSUES ALEGRIA FRANCE MACAU IMPLEMENTATION ATTRACTIVE MARKET DEAL STRUCTURE DISNEYLAND FINANCIAL GAIN
  • 33. FINANCIAL GAIN $ $26 M 2009 2010 2011-2022 Upfront Production Costs - 15,000,000 - 15,000,000 $114 M Ticket Sales 59,892,000 Creative Royalty 7,785,960 Rent 7,187,040 Operating costs 26,951,400 Operating Profit - 100% - 15,000,000 - 15,000,000 17,967,600 $26 M Operating Profit - 50% Add: Merchandise Income - 7,500,000 - 7,500,000 - 8,983,800 1,796,760 Less: Costume Salary 3,000,000 3,000,000 3,000,000 Net Income - 10,500,000 - 10,500,000 7,780,560 $27 M NPV $25,590,362.02 STATIC Investment $18,223,140.50 Annual ROI 32.47% Return $43,813,502.52 NPV ROI 140.43% Payback period 5 years OVERVIEW ISSUES ALEGRIA FRANCE MACAU IMPLEMENTATION ATTRACTIVE MARKET DEAL STRUCTURE DISNEYLAND FINANCIAL GAIN
  • 34. ATTRACTIVE MARKET Increasing Gaming Vegas of the East Established Presence Concessions (6) OVERVIEW ISSUES ALEGRIA FRANCE MACAU IMPLEMENTATION ATTRACTIVE MARKET DEAL STRUCTURE WYNN MACAU FINANCIAL GAIN
  • 35. ATTRACTIVE MARKET Projected Annual Macau Tourists 400,000,000 350,000,000 300,000,000 250,000,000 200,000,000 150,000,000 Annual Macau Increasing Gaming Vegas of the East Established Presence Tourists 100,000,000 Concessions (6) 50,000,000 - OVERVIEW ISSUES ALEGRIA FRANCE MACAU IMPLEMENTATION ATTRACTIVE MARKET DEAL STRUCTURE WYNN MACAU FINANCIAL GAIN
  • 36. DEAL STRUCTURE -Similar results to MGM partnership, experienced Investment $68,109,100.45 average revenue increases over last five years of: Return $124,214,376.21 NPV ROI 45.17% - Casino: 12.92% Payback Period 4 years - Food & Bev.: 23.03% - Entertainment: 23.37% OVERVIEW ISSUES ALEGRIA FRANCE MACAU IMPLEMENTATION ATTRACTIVE MARKET DEAL STRUCTURE WYNN MACAU FINANCIAL GAIN
  • 37. WYNN MACAU Wynn Macau -Owns 1/6 national gaming concessions -Wynn left the newly formed MGM Mirage in 2000 Wynn Encore - Strong pre-existing relationship, Wynn responsible for Cirque du Soleil initial introduction into Las Vegas Steve Wynn OVERVIEW ISSUES ALEGRIA FRANCE MACAU IMPLEMENTATION ATTRACTIVE MARKET DEAL STRUCTURE WYNN MACAU FINANCIAL GAIN
  • 38. WYNN MACAU Tokyo Macau OVERVIEW ISSUES ALEGRIA FRANCE MACAU IMPLEMENTATION ATTRACTIVE MARKET DEAL STRUCTURE WYNN MACAU FINANCIAL GAIN
  • 39. FINANCIAL GAIN $ $114 M 2009 2010 2011 - 2022 Upfront Production Costs - 15,000,000 - 15,000,000 $114 M Ticket Sales 147,056,250 Creative Royalty 19,117,313 Rent 17,646,750 Operating costs 66,175,313 Operating Profit - 100% - 15,000,000 - 15,000,000 44,116,875 $26 M Operating Profit - 50% Add: Merchandise Income - 7,500,000 - 7,500,000 22,058,438 - 4,411,688 Less: Costume Salary 3,000,000 3,000,000 3,000,000 Net Income - 10,500,000 - 10,500,000 23,470,125 $27 M NPV $113,940,660.16 STATIC Investment $18,223,140.50 Annual ROI 43.09% Return $132,163,800.66 NPV ROI 625.25% Payback period 3 years OVERVIEW ISSUES ALEGRIA FRANCE MACAU IMPLEMENTATION ATTRACTIVE MARKET DEAL STRUCTURE WYNN MACAU FINANCIAL GAIN
  • 40. TIMELINE ALEGRIA End Big Tent tour: Alegria Transition Alegria: Big Top  Arena Alegria Arena Tour: Europe * Alegria Arena Tour: Australia* Alegria Arena Tour New Cycle: N.A. 1 2 3 4 Years *Refer to schedule in presentation OVERVIEW ISSUES ALEGRIA FRANCE MACAU IMPLEMENTATION TIMELINE SUMMARY
  • 41. TIMELINE FRANCE Negotiate deal with Disney Paris Construct Disney Paris theatre Production: Amant de Rêve Disneyland Paris: Amant de Rêve 1 2 3 4 Years OVERVIEW ISSUES ALEGRIA FRANCE MACAU IMPLEMENTATION TIMELINE SUMMARY
  • 42. TIMELINE MACAU Negotiate deal with Wynn Resort Ltd Construct Wynn Macau Theatre Production: Rouge Wynn Macau: Rouge 1 2 3 4 Years OVERVIEW ISSUES ALEGRIA FRANCE MACAU IMPLEMENTATION TIMELINE SUMMARY
  • 43. SUMMARY Today Future FUTURE UNCERTAINTY OVERVIEW ISSUES ALEGRIA FRANCE MACAU IMPLEMENTATION TIMELINE SUMMARY
  • 44. SUMMARY Today Future ALEGRIA OVERVIEW ISSUES ALEGRIA FRANCE MACAU IMPLEMENTATION TIMELINE SUMMARY
  • 45. SUMMARY Today Future ALEGRIA FRANCE OVERVIEW ISSUES ALEGRIA FRANCE MACAU IMPLEMENTATION TIMELINE SUMMARY
  • 46. SUMMARY Today Future ALEGRIA FRANCE MACAU OVERVIEW ISSUES ALEGRIA FRANCE MACAU IMPLEMENTATION TIMELINE SUMMARY
  • 48. NPV OF INCREMENTAL PROFIT UNTIL 2022 $ $167 M MACAU $114 M FRANCE $26 M ALEGRIA $27 M STATIC Dark Horse Consulting Fahad | Sascha | Miata | Derek THANK-YOU! QUESTIONS?
  • 49. SWOT •Creativity/artistic expression •Creative platform extension failures •Leveraging creative process •Unwilling to compromise their •Ability to successfully manage partnerships creativity/vision •Maintained original vision/values •Untapped market opportunities •Product differentiation •Underutilization of Arena strategy •Large number of possible partnerships •Cannibalization of current Las Vegas •Growth: current markets market •Growth: Untapped markets •Competitors: Dragone
  • 51. NEW BUSINESS MODEL CIRQUE DU SOLEIL RESIDENTS ARENA BIG-TOP MYSTERE LOVE SALTIMBANCO KOOZA DRALION O LA NOUBA ALEGRIA CORTEO QURDAM ZUMANITY WINTUK VAREKAI 2010 KA ELVIS 2009 CHRIS ANGEL DUBAI WYNN MACAO #1 MACAO #2 TOKYO FRANCE
  • 52. BIG TOPS NVP COMPARISON $ NPV OF INCREMENTAL PROFIT UNTIL 2022 Two Big Top touring shows are planned for launch in the next two years MACAU ALEGRIA FRANCE BIG TOPS $114 M $22 M $27 M $26 M
  • 53. BIG TOPS FINANCIALS NPV CALCULATION 2009 2010 2011 - 2022 Upfront Production Costs - 15,000,000 - 15,000,000 Scenic and Transport Equip. - 3,500,000 - 3,500,000 Big Top - 6,500,000 - 6,500,000 Ticket Sales 30,375,000 Additional Merchandise 911,250 Operating costs 19,743,750 Net Income - 25,000,000 - 25,000,000 11,542,500 NPV $21,609,122.20
  • 54. BIG TOPS Big Tops Alternative Conservative Assumptions - Macau Discount Rate 10.00% Upfront Production Costs ($ M) 30 Scenic and Transport. Equip. ($ M) 7 Big Top ($ M) 13 Time for production (years) 2 Capacity (people) 2,500 Weekly Performances 9 Weeks 36 Break-even occupancy 65.00% Occupancy 75.00% Merchandise 10.00% Merchandise Margin 30.00% Ticket Price ($) 50.00
  • 55. WHY NOT BERLIN OR LONDON Based on these factors France instead of Berlin or London: the country is very close in proximity to Berlin and London Cirque du Soleil always identifies solid partnerships before entering a market: entering these new markets without existing relationships could be difficult
  • 56. WHY NOT LAS VEGAS Based on these factors Category size: Large; Category growth; Low, Category attractiveness; High Increased number of shows = increased chance of cannibalization
  • 57. WHY NOT DISNEYLAND LOS ANGELES Based on these factors Does not achieve the goal of creating a foothold in a new foreign market Already have one Disney Partnership: Walt Disneyworld Resort, Florida
  • 58. WHY NOT DUBAI (FURTHER) Lack of gambling makes replication of current 100 Number of Tourists 82 business model difficult 80 60 (Millions) 40 France 27 20 5.5 Macau 0 Dubai France Macau Dubai No presence of large scale amusement park to replicate the Disney theme park success OVERVIEW ISSUES ALEGRIA MACAU FRANCE IMPLEMENTATION TIMELINE SUCCESS FACTORS
  • 59. WHY NEW YORK IN THE FUTURE Based on these factors Success of Zumanity indicator of potential resident show success Market Potential: Demographics demonstrates that proportion of upper middle class individuals and other s have a long standing appreciation of the arts OVERVIEW ISSUES ALEGRIA MACAU FRANCE IMPLEMENTATION TIMELINE SUCCESS FACTORS
  • 60. WHY AUSTRALIA IN THE FUTURE With touring of Alegria, possibility for market evaluation for resident show Partnership opportunity with Sydney Opera House OVERVIEW ISSUES ALEGRIA MACAU FRANCE IMPLEMENTATION TIMELINE SUCCESS FACTORS
  • 61. FINANCIAL ASSUMPTIONS Arena Alegria Conservative Assumptions - Europe Arena Tour Discount Rate 10.00% Upfront Production Costs ($ M) 4 Time for production (years) 1 Scenic and Transport. Equip. ($ M) 6 Capacity (people) 10,000 Weekly Performances 6 Weeks 36 Break-even occupancy 65.00% Royalty to Arena 10.00% Occupancy 75.00% Merchandise 10.00% Merchandise Margin 30.00% Ticket Price ($) 54.50
  • 62. ALEGRIA SENSITIVITY I Sensitivity Analysis - Alegria 40,000,000.00 35,000,000.00 Prod. Costs Scenic 30,000,000.00 Capacity Value ($) Weekly 25,000,000.00 Weeks Occ. Rate 20,000,000.00 Royalty Merch. Margin Ticket Price 15,000,000.00 Worst Conservative Best Scenario
  • 63. ALEGRIA SENSITIVITY II Prod. Costs Scenic Capacity Weekly Weeks Occ. Rate Royalty Merch. Margin Ticket Price Worst 26,108,942.62 26,108,942.62 19,796,245.00 20,999,876.42 26,015,007.34 - 43,679,475.18 - 1,489,026.43 21,316,621.53 17,411,067.14 Conservative 27,018,033.53 27,018,033.53 27,018,033.53 27,018,033.53 27,018,033.53 27,018,033.53 27,018,033.53 27,018,033.53 27,018,033.53 Best 28,836,215.34 27,927,124.43 34,239,822.05 33,036,190.63 29,024,085.89 97,715,542.23 55,525,093.49 32,719,445.52 30,662,055.26 Production Costs Weekly Shows $2M 28,836,215.34 Best 5 20,999,876.42 Worst $3M 27,927,124.43 6 27,018,033.53 Cons $4M 27,018,033.53 Cons 7 33,036,190.63 Best $5M 26,108,942.62 Worst Weeks Scenic and Transport. 35 26,015,007.34 Worst $5M 27,927,124.43 Best 36 27,018,033.53 Cons $6M 27,018,033.53 Cons 37 28,021,059.71 $7M 26,108,942.62 Worst 38 29,024,085.89 Best Capacity Occupancy 8000 19,796,245.00 Worst 0.65- 43,679,475.18 Worst 9000 23,407,139.26 0.7- 8,330,720.83 10000 27,018,033.53 Cons 0.75 27,018,033.53 Cons 11000 30,628,927.79 0.8 62,366,787.88 12000 34,239,822.05 Best 0.85 97,715,542.23 Best
  • 64. ALEGRIA SENSITIVITY III Royalty 0.05 55,525,093.49 Best 0.1 27,018,033.53 Cons 0.15- 1,489,026.43 Worst Merchandise Margin 0.2 21,316,621.53 Worst 0.25 24,167,327.53 0.3 27,018,033.53 Cons. 0.35 29,868,739.52 0.4 32,719,445.52 Best Ticket Price 40 17,411,067.14 Worst 45 20,723,814.17 50 24,036,561.20 54.5 27,018,033.53 Cons. 60 30,662,055.26 Best
  • 65. FINANCIAL ASSUMPTIONS Disney France Resident Conservative Assumptions - Disney Discount Rate 10.00% Upfront Production Costs ($ M) 30 Time for production (years) 2 Capacity (people) 1,750 Weekly Performances 10 Weeks 46 Op. Costs 45.00% Creative Royalty 13.00% Rent 12.00% Occupancy 93.00% Ticket Price 80 Merchandise 10.00% Merchandise Margin 30.00% Costume Staff 3,000,000.00
  • 66. FRANCE SENSITIVITY I Sensitivity Analysis - France 40,000,000.00 35,000,000.00 Time for Prod. Capacity 30,000,000.00 Weekly Perf. Weeks Value ($) 25,000,000.00 Op. Costs Creative Royalty 20,000,000.00 Rent Occ. 15,000,000.00 Ticket Price Merch. Margin 10,000,000.00 Cost. Staff Worst Conservative Best Scenario
  • 67. FRANCE SENSITIVITY II Time for Prod. Capacity Weekly Perf. Weeks Op. Costs Creative Royalty Rent Occ. Ticket Price Merch. Margin Cost. Staff Worst 18,073,036.7116,917,940.12 13,448,971.36 22,950,929.27 17,158,840.73 22,217,753.51 20,531,449.25 23,632,073.21 10,413,623.69 22,217,753.51 10,856,987.11 Conservative 25,590,362.0225,590,362.02 25,590,362.02 25,590,362.02 25,590,362.02 25,590,362.02 25,590,362.02 25,590,362.02 25,590,362.02 25,590,362.02 25,590,362.02 Best 33,880,081.0334,262,783.93 37,731,752.69 28,229,794.78 34,021,883.32 30,649,274.80 28,962,970.54 26,895,887.90 40,767,100.35 28,647,541.83 40,323,736.94 Weeks Time for Production 44 22,950,929.27 Worst 1 33,880,081.03 Best 45 24,270,645.65 2 25,590,362.02 Cons 46 25,590,362.02 Cons 3 18,073,036.71 Worst 47 26,910,078.40 48 28,229,794.78 Best Capacity 1500 16,917,940.12 Worst Op. Costs 1750 25,590,362.02 Cons 0.4 34,021,883.32 Best 0.45 25,590,362.02 Cons 2000 34,262,783.93 Best 0.5 17,158,840.73 Worst Weekly Performances Creative Royalty 8 13,448,971.36 Worst 0.1 30,649,274.80 Best 9 19,519,666.69 0.11 28,962,970.54 10 25,590,362.02 Cons 0.12 27,276,666.28 11 31,661,057.36 0.13 25,590,362.02 Cons 0.14 23,904,057.77 12 37,731,752.69 Best 0.15 22,217,753.51 Worst
  • 68. FRANCE SENSITIVITY III Rent Merchandise Margin 0.1 28,962,970.54 Best 0.2 22,217,753.51 Worst 0.11 27,276,666.28 0.3 25,590,362.02 Cons 0.12 25,590,362.02 Cons 0.4 28,647,541.83 Best 0.13 23,904,057.77 0.14 22,217,753.51 Costume Staff 0.15 20,531,449.25 Worst 1,000,000 40,323,736.94 Best 2,000,000 32,957,049.48 Occupancy 3,000,000 25,590,362.02 Cons 0.9 23,632,073.21 Worst 4,000,000 18,223,674.57 5,000,000 10,856,987.11 Worst 0.91 24,284,836.15 0.92 24,937,599.09 0.93 25,590,362.02 Cons 0.94 26,243,124.96 0.95 26,895,887.90 Best Ticket Price 60 10,413,623.69 Worst 70 $18,001,992.86 80 25,590,362.02 Cons 90 33,178,731.19 100 40,767,100.35 Best
  • 69. FINANCIAL ASSUMPTIONS Macau Resident Alternative Conservative Assumptions - Macau Discount Rate 10.00% Upfront Production Costs ($ M) 30 Time for production (years) 2 Capacity (people) 2,750 Weekly Performances 10 Weeks 46 Op. Costs 45.00% Creative Royalty 13.00% Rent 12.00% Occupancy 93.00% Ticket Price 125 Merchandise 10.00% Merchandise Margin 30.00% Costume Staff 3,000,000.00
  • 70. MACAU SENSITIVITY I Sensitivity Analysis - Macau 160,000,000.00 150,000,000.00 Time for Prod. 140,000,000.00 Capacity 130,000,000.00 Weekly Perf. 120,000,000.00 Weeks Value ($) 110,000,000.00 Op. Costs 100,000,000.00 Creative Royalty 90,000,000.00 Rent Occ. 80,000,000.00 Ticket Price 70,000,000.00 Merch. Margin 60,000,000.00 Cost. Staff Worst Conservative Best Scenario
  • 71. MACAU SENSITIVITY II Time for Prod. Capacity Weekly Perf. Weeks Op. Costs Creative Royalty Rent Occ. Ticket Price Merch. Margin Cost. Staff Worst 94,635,532.44 73,288,682.49 84,129,209.87 107,459,910.10 93,238,264.13 105,659,701.75 101,519,222.54 109,132,361.73 84,129,209.87 105,659,701.75 99,207,285.25 Conservative 113,940,660.16 113,940,660.16 113,940,660.16 113,940,660.16 113,940,660.16 113,940,660.16 113,940,660.16 113,940,660.16 113,940,660.16 113,940,660.16 113,940,660.16 Best 135,196,961.81 154,592,637.83 143,752,110.45 120,421,410.22 134,643,056.20 126,362,097.78 122,221,618.58 117,146,192.45 143,752,110.45 122,221,618.58 128,674,035.07 Time for Production Weeks 1 135,196,961.81 Best 44 107,459,910.10 Worst 2 113,940,660.16 Cons 45 110,700,285.13 3 94,635,532.44 Worst 46 113,940,660.16 Cons 47 117,181,035.19 Capacity 48 120,421,410.22 Best 2000 73,288,682.49 Worst 2250 86,839,341.71 Op. Costs 2500 100,390,000.94 0.4 134,643,056.20 Best 2750 113,940,660.16 Cons 0.45 113,940,660.16 Cons 3000 127,491,319.38 0.5 93,238,264.13 Worst 3250 141,041,978.61 3500 154,592,637.83 Best Creative Royalty 0.1 126,362,097.78 Best Weekly Performances 0.11 122,221,618.58 8 84,129,209.87 Worst 0.12 118,081,139.37 9 99,034,935.02 0.13 113,940,660.16 Cons 10 113,940,660.16 Cons 0.14 109,800,180.95 11 128,846,385.31 0.15 105,659,701.75 Worst 12 143,752,110.45 Best
  • 72. MACAU SENSITIVITY III Rent Merchandise Margin 0.1 122,221,618.58 Best 0.2 105,659,701.75 Worst 0.11 118,081,139.37 0.12 113,940,660.16 Cons 0.3 113,940,660.16 Cons 0.13 109,800,180.95 0.4 122,221,618.58 Best 0.14 105,659,701.75 0.15 101,519,222.54 Worst Costume Staff Occupancy 1,000,000 128,674,035.07 Best 0.9 109,132,361.73 Worst 2,000,000 121,307,347.62 0.91 110,735,127.87 0.92 112,337,894.02 3,000,000 113,940,660.16 Cons 0.93 113,940,660.16 Cons 4,000,000 106,573,972.70 0.94 115,543,426.31 5,000,000 99,207,285.25 Worst 0.95 117,146,192.45 Best Ticket Price 100 84,129,209.87 Worst 110 96,053,789.99 120 107,978,370.10 125 113,940,660.16 Cons 130 119,902,950.22 140 131,827,530.34 150 143,752,110.45 Best
  • 73. AUSTRALIA TOUR DATES Sydney, AU - From 7 January 2011 Perth, AU - From 9 September 2010 Adelaide, AU - From 21 July 2010 Brisbane, AU - From 28 May 2010 Melbourne, AU - From 2 April 2010
  • 74. MGM BENEFITS 2003 2004 2005 2006 2007 Average Casino 2.13% 32.86% 13.24% 3.47% 12.92% Food & Bev. 6.63% 57.49% 16.69% 11.31% 23.03% Entertainment 4.92% 58.67% 7.81% 22.07% 23.37%
  • 75. THEATRE CONSTRUCTION Name Location Capacity (seats) Construction costs ($M) Year Cost/Person Kodak LA 3100 95 2001 30,645.16 Colosseum LV 4100 95 2003 23,170.73 Aqua LV 3000 100 2005 33,333.33 Wynn LV 1200 40 2005 33,333.33 Arts (planned) UCONN 800 65 2005 81,250.00 Phantom LV 1800 40 2006 22,222.22 Average 2,333.33 37,325.80 Average (no UCONN) 2,640.00 28,540.96 Production costs included
  • 76. TICKET PRICE CALCULATION Saltimbanco Tour Plan Spring/Summer 2008 (Assume all prices in USD) Low High Level 3-2 40 60 Level 1-0 70 90 Number of Shows 118 Price Breakdown Level Amount Percent Allocation 0 90 10% 9 1 70 15% 10.5 2 60 25% 15 3 40 50% 20 $ 54.50
  • 77. MACAU TOURIST CALCULATION Tourism Data Tourism Projection Jan - April 2008 Average 3 Year Growth 0.1887 12 mos. Tourists 9 995 006 29985018 2009 2010 2011 2012 Incr. Over last year 16.28 Tourists 35,642,361 42,367,087 50,360,583 59,862,231 Jan - Dec 2007 2013 2014 2015 2016 2017 71,156,576 84,581,852 100,540,105 119,509,239 142,057,323 Tourists 27 003 370 Incr. Over last year 22.75 2018 2019 2020 2021 2022 168,859,606 200,718,738 238,588,806 283,603,907 337,112,112 Jan - Dec 2006 Tourists 21 998 122 Incr. Over last year 17.57
  • 78. RISK AND MITIGATION Risk Mitigation LV Sands partnership -Not an exclusive partnership problems with LV Sands, still providing top quality show Disney refuses to build -Locate new Parisian partner, exclusive theatre to be determined Wynn refuses to build -Enter Macau with exclusive exclusive theatre MGM Grand deal Alegria cannot transition into -Develop new arena show, arena format delay timeline as necessary OVERVIEW ISSUES ALEGRIA MACAU FRANCE IMPLEMENTATION TIMELINE SUCCESS FACTORS
  • 79. SUCCESS INDICATORS Success Indicators Payback period for each project achieved, as indicated Break-even for each recommendation after April 2009 NPV ROI ≥ 0.00% OVERVIEW ISSUES ALEGRIA MACAU FRANCE IMPLEMENTATION TIMELINE SUCCESS FACTORS
  • 80. BACK-UP INDEX ANALYSIS FRANCE SWOT FINANCIAL ASSSUMPTIONS KEY SUCCESS FACTORS SENSITIVITY ANALYSIS BUSINESS MODEL MACAU ALTERNATIVES FINANCIAL ASSUMPTIONS BIG TOPS NPV COMPARISON SENSITIVITY ANALYSIS BIG TOPS NPV CALCULATION BIG TOPS ASSUMPTIONS MISCELLANEOUS AUSTRALIA TOUR DATES BERLIN OR LONDON MGM BENEFITS LAS VEGAS THEATRE CONSTRUCTION DISNEYLAND LOS ANGELAS TICKET PRICE CALCULATION DUBAI MACAU TOURIST CALUCLATION RISK & MITIGATIONS FUTURE OUTLOOK SUCCESS INDICATORS NEW YORK AUSTRALIA ALEGRIA FINANCIAL ASSUMPTIONS SENSITIVITY ANALYSIS