SlideShare uma empresa Scribd logo
1 de 2
Baixar para ler offline
POPULATION

2010
Catalonia

Spain

234
7 535
49.5
50.5

93
47 151
49.3
50.7

116
502 520
48.8
51.2

DENSITY OF POPULATION

2009

Density (inh/km2)
Population (1 000)(1)
males (%)
females (%)
Structure
0-14 years (%)
15-24 years (%)
25-49 years (%)
50-64 years (%)
65-79 years (%)
≥ 80 years (%)

15.5
9.7
40.5
17.5
11.7
5.1

14.8
10.3
40.0
17.7
12.1
5.1

15.7

12.2

1.3
3.4
4.7

1.3
2.3
3.6

1.7
1.0
2.7

11.3
1.46

10.5
1.39

Density of population (inhab./km2)
(Catalonia = 232)
< 50
≥ 50 and < 100
≥ 100 and < 150
≥ 150 and < 200
≥ 200 and < 250
≥ 250

10.7
1.59

Net
Natural increase(2)
Total increase(2)
Birth rate(2)
Children per woman
Marriage rate(2)

3.7

Divorce rate(2)

3.6

2.8

Death rate(2)
Life expectancy (years)
males
females
1/01/2011.
(2) Per 1,000 inhabitants.

2008
(4) 2007

(1)

(3)

Estonia

8.3
82.2
79.1
85.3

(1) This

Latvia

(4)
(4)

2.0

United
Kingdom

17.8
18.6
16.7
39.5

Germany
Belgium

(3)
France

20.1
19.7
20.5
41.6

9.7
9.7
9.6
21.1

2010

Czech Rep.
Slovakia
Austria

Catalonia

Italy

2010

10 961 988
1.7
18.7
6.0
73.6

External trade (million €)
imports
exports

67 247
48 600

238 082
185 799

1 501 761
1 348 778

ICP. Annual variation (%)

2.0

2.0

2.1

GPD PER INHABITANT (Purchasing power parity)

Catalonia
Spain
EU-27

2009

2008

2007

2006

0

10

ENVIRONMENT
Catalonia

55 - 59

Area (1 000 km2)

50 - 54

Municipal waste (1 000 t)
landfilled (%)
incinerated (%)
others (%)

45 - 49
40 - 44
35 - 39
30 - 34

Municipal waste per person (kg)

25 - 29

kg per person per day

20 - 24
15 - 19

Grennhouse

10 - 14

EU-27

32

506

4 199
39.2
15.0
45.8

26 351
56.9
9.2
33.9

(2)

(2)

% of gross electricity consumption

%

524

(2)

575
1.58

1.44

124

127

87

(3)

16.7

(2)

0-4
0

Spain

1

2

3

4

5

EU-27

6

(1)
(3)

1990=100 (non-fluorinated gases) and 1995=100 (fluorinated gases).
UE-15

20.6

market
services

(2)
(2)

2008

(4) 2007

Spain

Hourly labour costs (€)
industry
construction
services
Gender pay gap(2)
Consumption expenditure of private households (€)
food (%)
housing (%)
Risk-of-poverty rate (%)
males
females
(1)

2008

(2)

60

80

100

120

140

2010

EU-27

2010

2009

Spain

EU-27

21.82
23.38
21.81
20.90

20.96
22.22
19.42
20.49

21.30
22.11
19.36
21.89

18.5

16.7

17.1

31 889
14.3
31.9

29 782
14.4
30.0

:
:
:

19.9
18.5
21.3

20.7
20.1
21.3

16.4
15.7
17.1

(1)

Spain

EU-27

Agricultural holdings (1 000)(1)
Agricultural area utilised (1 000 ha)(1)
cropland (%)

non-market
services

Catalonia
(2)

562

(4)

industry

4 403
261 840
39.5
19.5
41.0

1.54

8.8

agriculture

LIVING CONDITIONS

Electricity generated from renewable sources

5-9

gases(1)

Spain

40

Catalonia

Catalonia

2009

20

AGRICULTURE

5

Cyprus

0

60 - 64

Catalonia

961 592
2.7
15.8
10.2
71.3

15

Greece

Malta

65 - 69

0

192 724
1.1
18.5
9.1
71.2

20

Portugal

70 - 74

1

Gross value added (million €)
agriculture (%)
industry and energy (%)
construction (%)
services (%)

30

Romania

75 - 79

2

12 257 461
1.8
24 400

2010

80 - 84

3

1 062 591
-0.1
23 100

25

85 and over

4

209 727
0.1
28 262

35

Hungary

age

5

Gross domestic product (million €)
GDP. Growth rate (%)
GDP per inhabitant (€)

Bulgaria

POPULATION STRUCTURE

6

EU-27

40

Slovenia

Spain

%

Spain

%

Luxembourg

9.7
79.4
76.4
82.4

217 008
4.7
28.7
66.6

2010
Catalonia

45

Poland

(3)

18 457
3.8
23.0
73.2

rate has been calculated for the population 15 year old and over.

Netherlands

Ireland

57.6
65.0
50.6

emploYED PERSONS BY SECTORS

Lithuania

Denmark

4.5

2.2

7.9
82.3
79.3
85.2

Swden

240 089

59.3
67.3
51.7

3 138
2.1
28.1
69.7

Unemployment rate (%)
males (%)
females (%)
< 25 year old (%)

Finland

23 089

ECONOMY

EU-27

62.2
69.7
55.0

Employment (1 000)
agriculture (%)
industry and construction (%)
construction (%)

Spain

3 815

Activity rate (%)(1)
males (%)
females (%)

6.5

migration(2)

2010

Active population (1 000)

(3)

15.6
12.1
35.8
19.1
12.7
4.7

Foreigners (%)(1)

LABOUR MARKET
Catalonia

EU-27

59
1 148
69.1

972
23 753
64.7

13 700
:
:

Agricultural output (milion €)
crop (%)
animal (%)

3 967
38.4
58.5

37 829 345 168
65.4
54.5
33.5
40.9

Gross value added (million €)

1 815

22 016

(1)

2009

(2)

2007

INDUSTRY AND R&D

143 810

2010
Catalonia

R&D researchers(1)(2)
females (%)
2009

(2)

Full time equivalent.

Spain

EU-27

4.5

0.9

6.8

1.7
58.4
22.9
18.7

Industrial production index. Annual variation (%)
R&D expenditure/GDP (%)(1)
Business enterprises (%)
Higher education sector (%)
Government sector (%)

(1)

(2)

1.4
52.1
27.8
20.1

2.0
63.0
23.7
13.2

26 932
37.7
(3) 2008

133 803 1 584 880
38.5
29.3

(3)
ENERGY

2009
Catalonia

Spain

EU-27

Production of primary energy (1 000 toe)

6 273

(1)

29 579

812 221

Primary energy consumption (1 000 toe)
coal (%)
oil and petroleum products (%)
natural gas (%)

26 840
1.1
48.2
24.9

(1)

130 188
8.1
48.3
24.0

1 702 755
15.8
36.8
24.6

nuclear energy (%)

19.7

renewable sources (%)

6.1

Final energy consumption (1 000 toe)
industry (%)
transport (%)
domestic and others (%)

16 173
31.6
39.9
28.4

Energy consumption per inhabitant (1 000 toe)
Electricity consumption per inhabitant (kW/h)
(1)

2007

(2)

10.4

3.7
6 350

2008

13.6

9.3

(1)

(1)
(2)

9.0

88 966
26.7
42.5
30.7

1 113 671
24.2
33.0
42.8

2.8
5 563

3.4
5 433

2010
Catalonia

Spain

452

480

99.5
0.5

96.6
3.4

77.5
22.5

202 282
35 416

564 384
153 387

8 187 375
796 396

417

2 714

34 500

Passenger cars per 1 000 inhabitants
Inland freight transport (t/km)(1)
road (%)
rail and waterway (%)
Railways. Passengers (1 000)
Airports. Passengers (1 000)
Road accidents. Killed people(1)
2009

(2)

EU-27
(1)

473

(1)

(2)

2007

Spain

68.3

59.0

67.7
70.0
65.3

58.0
62.0
55.0

22.6

17.0

13.4

10.0

12.0

32.6
74.4

32.0
65.0

32.0
72.0

Enterprises having received orders on-line

(1)

Population aged 16 to 74 who access at least once a week.

(2)

2009

(2)

EDUCATION

2010
Catalonia

Spain

EU-27

5 581
49.2
50.8

41 953
44.4
55.6

736
42.0
58.0

3 302
54.1
45.9

28 078
43.8
56.2

65 107
69.6
30.4

364 864
73.2
26.8

2 233 396
67.6
32.4

Bed-places (1 000)
hotels (%)
others (%)
Nights spent (1 000)
hotels (%)
others (%)
2009

PARLiaMENT of Catalonia

2010

2010/11

C's

ERC 3.39

SI

CiU

3.29

38.43

7.00

PSC

18.38
ICVEUiA

Spain

1 487
22.2
30.1
30.9
16.8

9 443
18.7
29.8
32.5
19.1

107 558
13.6
26.1
42.1
18.1

250
9.7
49.9
5.7
10.8
23.9

1 801
10.5
42.1
10.5
12.6
24.5

19 470
12.5
43.2
10.2
14.1
20.0

Students (1 000)
pre-primary education (%)
primary education (%)
secondary education (%)
tertiary (%)
University. Students (1 000)
humanities (%)
social science (%)
science (%)
health (%)
engineering and architecture (%)
2009/10

EU-27

(1)

(1)

10
28
10

34

62

number of
seats

PPC

18

12.37

2010

187
5 956
25.0
64.1
11.0
13.4
11.3

190
6 059
17.8
67.9
14.3
9.3
6.7

204
6 506
13.8
68.8
17.4
10.4
3.2

Active population (1 000)
Activity rate (%)
Employment (1 000)
Unemployment rate (%)

2 249
51.0
1 940
12.6

2 533
52.5
2 223
12.2

3 092
57.9
2 826
8.6

3 815
62.2
3 138
17.8

GDP (million €)
GDP per inhabitant (€)
Exports (million €)
External trade ratio (Exp. + Imp./GDP) (%)

17 309
2 909
2 073
34.8

61 865
10 190
8 729
42.6

135 709
20 353
36 309
68.9

209 727
28 262
48 600
55.2

392
370
147
4 391
14 863
11 830
168

715
504
240
6 850
54 033
16 547
189

883
663
319
7 181
93 442
20 931
235

471
676
211
7 418
197 638
27 585
287

0.8
303

1.22
1 816

1.63
6 514

1.54
10 658

University. Students (1 000)
Inhabitants per doctor

(1)

HEALTH

Per 1 000 live births.

96
398

165
245

220
213

250
198

2010
Catalonia

Spain

Hospital beds (per 1 000 inhabitants)

4.7

3.2

5.5

(1)

Infant mortality rate (per 1 000 live births)

2.6

3.2

4.3

(1)

237.0
221.7
3.8

261.5
221.0
6.2

382.4
248.5
7.9

Main causes of death (per 100 000
circulatory system
neoplasia
transport accidents
(1) 2009

inhabitants)(1)

EU-27
(1)

BUDGET

Parliament (%)
Presidential Department (%)
Governance and Institutional
Relations (%)
Economy and Knowledge (%)
Education (%)
Health (%)
Home Affairs (%)
Territory and Sustainability (%)

www.idescat.cat

234
7 535
15.5
67.7
16.8
11.3
2.6

Municipal waste (kg/inh./day)
Protected areas (km2)

2011

Government of Catalonia. Expenditure (million €)	 32 630

votes (%)

7.37

(1)

454 583
44.8
55.2

Tourist establishments
hotels (%)
others (%)

(2)

2001

Cement consumption per inhabitant (kg)
Vehicles (per 1 000 inhabitants)
Vehicles registrations (1 000)
Credit institutions. Local units
Deposits (million €)
Visitors (1 000)
Hotel bed-places (1 000)

31.0

(%)(2)

1991

Population density (inhab./km2)
Population (1 000)
< 15 years (%)
15-64 years (%)
≥ 65 years (%)
Birth rate (per 1 000 inhabitants)
Infant mortality rate(1)

65.0
68.0
62.0

Individuals who have purchased goods/services (%)

1980

70.0

Internet. Regular users (%)(1)
males
females

E-government. Usage (%)
individuals(1)
enterprises

EVOLUTION OF INDICATORS

EU-27

Internet. Households with acces (%)

(1)

TOURISM

(1)

2010
Catalonia

Catalonia

TRANSPORT

(1)

INFORMATION SOCIETY

0.2 Culture (%)
1.7 Agriculture. Livestock. Fisheries.
Food and Natural Enviroment (%)
1.1 Social Welfare and Family (%)
3.9 Enterprise and Labour (%)
15.0 Justice (%)
28.0 Public Debt (%)
3.7 Local entities (%)
4.3

0.9
1.3
6.4
3.5
2.8
18.3
8.2

Edited by:

Statistical Institute of Catalonia

www.idescat.cat

Generalitat de Catalunya is the national selft-government of Catalonia made up
of the three institutions: the Parliament. the President and the Executive Council
or Government.
Sources:	
Government of Catalonia, Idescat, National Statistics Institute, ministries and
Eurostat.

Figures of
Catalonia

Updated: 15/11/2011Eurostat.
Revised edition: 12/01/2012
© Generalitat de Catalunya
Institut d'Estadística de Catalunya
Legal deposit: B-40830-2011
Printed by: Gràfiques Vilanova SL

ED PAPER
R E CYCL

Generalitat de Catalunya
Government of Catalonia

Mais conteúdo relacionado

Semelhante a Figures of Catalonia 2011

IFAD Cambodia Country program presentation apr 2015
IFAD Cambodia Country program presentation apr 2015 IFAD Cambodia Country program presentation apr 2015
IFAD Cambodia Country program presentation apr 2015
ifadseahub
 
Slides Ed1
Slides Ed1Slides Ed1
Slides Ed1
lizardyh
 
Ireland construction trends 2010-2018
Ireland construction trends 2010-2018 Ireland construction trends 2010-2018
Ireland construction trends 2010-2018
Matthew Scott
 
Social protest, housing, regulation
Social protest, housing, regulationSocial protest, housing, regulation
Social protest, housing, regulation
Anochi.com.
 

Semelhante a Figures of Catalonia 2011 (20)

Figures of Catalonia 2013
Figures of Catalonia 2013Figures of Catalonia 2013
Figures of Catalonia 2013
 
Figures of Catalonia 2009
Figures of Catalonia 2009Figures of Catalonia 2009
Figures of Catalonia 2009
 
Figures of Catalonia 2008
Figures of Catalonia 2008Figures of Catalonia 2008
Figures of Catalonia 2008
 
Figures of Catalonia 2015
Figures of Catalonia 2015Figures of Catalonia 2015
Figures of Catalonia 2015
 
Figures of Catalonia 2014
Figures of Catalonia 2014Figures of Catalonia 2014
Figures of Catalonia 2014
 
Figures of Catalonia 2006
Figures of Catalonia 2006Figures of Catalonia 2006
Figures of Catalonia 2006
 
Pablo Lattes - replacement migration revisiting a debated concept 15 years later
Pablo Lattes - replacement migration revisiting a debated concept 15 years laterPablo Lattes - replacement migration revisiting a debated concept 15 years later
Pablo Lattes - replacement migration revisiting a debated concept 15 years later
 
Luxembourg in figures 2016
Luxembourg in figures 2016Luxembourg in figures 2016
Luxembourg in figures 2016
 
Indian Economy
Indian EconomyIndian Economy
Indian Economy
 
Sickle Cell Disease: Newborn screening in France and the UK - Jacques Elion
Sickle Cell Disease: Newborn screening in France and the UK - Jacques ElionSickle Cell Disease: Newborn screening in France and the UK - Jacques Elion
Sickle Cell Disease: Newborn screening in France and the UK - Jacques Elion
 
IFAD Cambodia Country program presentation apr 2015
IFAD Cambodia Country program presentation apr 2015 IFAD Cambodia Country program presentation apr 2015
IFAD Cambodia Country program presentation apr 2015
 
Greek International Trade
Greek International TradeGreek International Trade
Greek International Trade
 
Slides Ed1
Slides Ed1Slides Ed1
Slides Ed1
 
Ireland construction trends 2010-2018
Ireland construction trends 2010-2018 Ireland construction trends 2010-2018
Ireland construction trends 2010-2018
 
Social protest, housing, regulation
Social protest, housing, regulationSocial protest, housing, regulation
Social protest, housing, regulation
 
The Spanish Economy
The Spanish EconomyThe Spanish Economy
The Spanish Economy
 
15 May 08 Global Poverty Presentation
15 May 08   Global Poverty Presentation15 May 08   Global Poverty Presentation
15 May 08 Global Poverty Presentation
 
Singapore 2012
Singapore 2012Singapore 2012
Singapore 2012
 
Chile's market analisys
Chile's market analisysChile's market analisys
Chile's market analisys
 
Comparative Analyses of Exclusionism in (Post-)Post Socialist Countries: With...
Comparative Analyses of Exclusionism in (Post-)Post Socialist Countries: With...Comparative Analyses of Exclusionism in (Post-)Post Socialist Countries: With...
Comparative Analyses of Exclusionism in (Post-)Post Socialist Countries: With...
 

Mais de Miqui Mel

Mais de Miqui Mel (20)

TC vs el Pla Estratègic d'Acció Exterior GenCat - Fallo
TC vs el Pla Estratègic d'Acció Exterior GenCat - FalloTC vs el Pla Estratègic d'Acció Exterior GenCat - Fallo
TC vs el Pla Estratègic d'Acció Exterior GenCat - Fallo
 
TC vs el Pla Estratègic d'Acció Exterior GenCat
TC vs el Pla Estratègic d'Acció Exterior GenCatTC vs el Pla Estratègic d'Acció Exterior GenCat
TC vs el Pla Estratègic d'Acció Exterior GenCat
 
Com Es Distribueix la Corrupció Política a Espanya
Com Es Distribueix la Corrupció Política a EspanyaCom Es Distribueix la Corrupció Política a Espanya
Com Es Distribueix la Corrupció Política a Espanya
 
Acord Parlamentari Junts Pel Si-CUP-CC
Acord Parlamentari Junts Pel Si-CUP-CCAcord Parlamentari Junts Pel Si-CUP-CC
Acord Parlamentari Junts Pel Si-CUP-CC
 
Frau i Improvisació en la Despesa - Anàlisi del pressupost de defensa espanyo...
Frau i Improvisació en la Despesa - Anàlisi del pressupost de defensa espanyo...Frau i Improvisació en la Despesa - Anàlisi del pressupost de defensa espanyo...
Frau i Improvisació en la Despesa - Anàlisi del pressupost de defensa espanyo...
 
Fem la República, Declaració de Vilanova
Fem la República, Declaració de VilanovaFem la República, Declaració de Vilanova
Fem la República, Declaració de Vilanova
 
Fil a l'Agulla - I Ara Què? Bases per a un Acord Polític de Futur
Fil a l'Agulla - I Ara Què? Bases per a un Acord Polític de FuturFil a l'Agulla - I Ara Què? Bases per a un Acord Polític de Futur
Fil a l'Agulla - I Ara Què? Bases per a un Acord Polític de Futur
 
Baròmetre d'Opinió Política Catalunya · 3a Onada 2015
Baròmetre d'Opinió Política Catalunya · 3a Onada 2015Baròmetre d'Opinió Política Catalunya · 3a Onada 2015
Baròmetre d'Opinió Política Catalunya · 3a Onada 2015
 
Political Opinion Barometer Catalonia - 3rd Wave 2015
Political Opinion Barometer Catalonia - 3rd Wave 2015Political Opinion Barometer Catalonia - 3rd Wave 2015
Political Opinion Barometer Catalonia - 3rd Wave 2015
 
El Govern en Funcions
El Govern en FuncionsEl Govern en Funcions
El Govern en Funcions
 
El Cami d'Escòcia Cap al Referendum d´Independència
El Cami d'Escòcia Cap al Referendum d´IndependènciaEl Cami d'Escòcia Cap al Referendum d´Independència
El Cami d'Escòcia Cap al Referendum d´Independència
 
Reuters Institute Digital News Report 2015
Reuters Institute Digital News Report 2015Reuters Institute Digital News Report 2015
Reuters Institute Digital News Report 2015
 
La Identitat de Barcelona i dels Barcelonins a l’Època Moderna
La Identitat de Barcelona i dels Barcelonins a l’Època Moderna La Identitat de Barcelona i dels Barcelonins a l’Època Moderna
La Identitat de Barcelona i dels Barcelonins a l’Època Moderna
 
Junts Pel Sí - Acord per crear un Estat independent i establir un Govern de c...
Junts Pel Sí - Acord per crear un Estat independent i establir un Govern de c...Junts Pel Sí - Acord per crear un Estat independent i establir un Govern de c...
Junts Pel Sí - Acord per crear un Estat independent i establir un Govern de c...
 
Economic effects of a potential secession of Catalonia from Spain and paths f...
Economic effects of a potential secession of Catalonia from Spain and paths f...Economic effects of a potential secession of Catalonia from Spain and paths f...
Economic effects of a potential secession of Catalonia from Spain and paths f...
 
Carta adreçada al M. Hble. Sr. Artur Mas, l’Hble. Sr. Oriol Junqueras i el Sr...
Carta adreçada al M. Hble. Sr. Artur Mas, l’Hble. Sr. Oriol Junqueras i el Sr...Carta adreçada al M. Hble. Sr. Artur Mas, l’Hble. Sr. Oriol Junqueras i el Sr...
Carta adreçada al M. Hble. Sr. Artur Mas, l’Hble. Sr. Oriol Junqueras i el Sr...
 
Anuari Mediacat: Els Silencis Mediatics de 2014
Anuari Mediacat: Els Silencis Mediatics de 2014Anuari Mediacat: Els Silencis Mediatics de 2014
Anuari Mediacat: Els Silencis Mediatics de 2014
 
Anuari Mediacat: Els Silencis Mediatics de 2013
Anuari Mediacat: Els Silencis Mediatics de 2013Anuari Mediacat: Els Silencis Mediatics de 2013
Anuari Mediacat: Els Silencis Mediatics de 2013
 
Diari ANC #03 - I Love Spain, I Love Catalonia
Diari ANC #03 - I Love Spain, I Love CataloniaDiari ANC #03 - I Love Spain, I Love Catalonia
Diari ANC #03 - I Love Spain, I Love Catalonia
 
Political Opinion Barometer - CEO (July 2015)
Political Opinion Barometer - CEO (July 2015)Political Opinion Barometer - CEO (July 2015)
Political Opinion Barometer - CEO (July 2015)
 

Último

THE OBSTACLES THAT IMPEDE THE DEVELOPMENT OF BRAZIL IN THE CONTEMPORARY ERA A...
THE OBSTACLES THAT IMPEDE THE DEVELOPMENT OF BRAZIL IN THE CONTEMPORARY ERA A...THE OBSTACLES THAT IMPEDE THE DEVELOPMENT OF BRAZIL IN THE CONTEMPORARY ERA A...
THE OBSTACLES THAT IMPEDE THE DEVELOPMENT OF BRAZIL IN THE CONTEMPORARY ERA A...
Faga1939
 
Powerful Love Spells in Phoenix, AZ (310) 882-6330 Bring Back Lost Lover
Powerful Love Spells in Phoenix, AZ (310) 882-6330 Bring Back Lost LoverPowerful Love Spells in Phoenix, AZ (310) 882-6330 Bring Back Lost Lover
Powerful Love Spells in Phoenix, AZ (310) 882-6330 Bring Back Lost Lover
PsychicRuben LoveSpells
 
{Qatar{^🚀^(+971558539980**}})Abortion Pills for Sale in Dubai. .abu dhabi, sh...
{Qatar{^🚀^(+971558539980**}})Abortion Pills for Sale in Dubai. .abu dhabi, sh...{Qatar{^🚀^(+971558539980**}})Abortion Pills for Sale in Dubai. .abu dhabi, sh...
{Qatar{^🚀^(+971558539980**}})Abortion Pills for Sale in Dubai. .abu dhabi, sh...
hyt3577
 

Último (20)

THE OBSTACLES THAT IMPEDE THE DEVELOPMENT OF BRAZIL IN THE CONTEMPORARY ERA A...
THE OBSTACLES THAT IMPEDE THE DEVELOPMENT OF BRAZIL IN THE CONTEMPORARY ERA A...THE OBSTACLES THAT IMPEDE THE DEVELOPMENT OF BRAZIL IN THE CONTEMPORARY ERA A...
THE OBSTACLES THAT IMPEDE THE DEVELOPMENT OF BRAZIL IN THE CONTEMPORARY ERA A...
 
Transformative Leadership: N Chandrababu Naidu and TDP's Vision for Innovatio...
Transformative Leadership: N Chandrababu Naidu and TDP's Vision for Innovatio...Transformative Leadership: N Chandrababu Naidu and TDP's Vision for Innovatio...
Transformative Leadership: N Chandrababu Naidu and TDP's Vision for Innovatio...
 
05052024_First India Newspaper Jaipur.pdf
05052024_First India Newspaper Jaipur.pdf05052024_First India Newspaper Jaipur.pdf
05052024_First India Newspaper Jaipur.pdf
 
Gujarat-SEBCs.pdf pfpkoopapriorjfperjreie
Gujarat-SEBCs.pdf pfpkoopapriorjfperjreieGujarat-SEBCs.pdf pfpkoopapriorjfperjreie
Gujarat-SEBCs.pdf pfpkoopapriorjfperjreie
 
China's soft power in 21st century .pptx
China's soft power in 21st century   .pptxChina's soft power in 21st century   .pptx
China's soft power in 21st century .pptx
 
Enjoy Night ≽ 8448380779 ≼ Call Girls In Palam Vihar (Gurgaon)
Enjoy Night ≽ 8448380779 ≼ Call Girls In Palam Vihar (Gurgaon)Enjoy Night ≽ 8448380779 ≼ Call Girls In Palam Vihar (Gurgaon)
Enjoy Night ≽ 8448380779 ≼ Call Girls In Palam Vihar (Gurgaon)
 
Enjoy Night ≽ 8448380779 ≼ Call Girls In Gurgaon Sector 48 (Gurgaon)
Enjoy Night ≽ 8448380779 ≼ Call Girls In Gurgaon Sector 48 (Gurgaon)Enjoy Night ≽ 8448380779 ≼ Call Girls In Gurgaon Sector 48 (Gurgaon)
Enjoy Night ≽ 8448380779 ≼ Call Girls In Gurgaon Sector 48 (Gurgaon)
 
Powerful Love Spells in Phoenix, AZ (310) 882-6330 Bring Back Lost Lover
Powerful Love Spells in Phoenix, AZ (310) 882-6330 Bring Back Lost LoverPowerful Love Spells in Phoenix, AZ (310) 882-6330 Bring Back Lost Lover
Powerful Love Spells in Phoenix, AZ (310) 882-6330 Bring Back Lost Lover
 
Enjoy Night ≽ 8448380779 ≼ Call Girls In Gurgaon Sector 46 (Gurgaon)
Enjoy Night ≽ 8448380779 ≼ Call Girls In Gurgaon Sector 46 (Gurgaon)Enjoy Night ≽ 8448380779 ≼ Call Girls In Gurgaon Sector 46 (Gurgaon)
Enjoy Night ≽ 8448380779 ≼ Call Girls In Gurgaon Sector 46 (Gurgaon)
 
Group_5_US-China Trade War to understand the trade
Group_5_US-China Trade War to understand the tradeGroup_5_US-China Trade War to understand the trade
Group_5_US-China Trade War to understand the trade
 
America Is the Target; Israel Is the Front Line _ Andy Blumenthal _ The Blogs...
America Is the Target; Israel Is the Front Line _ Andy Blumenthal _ The Blogs...America Is the Target; Israel Is the Front Line _ Andy Blumenthal _ The Blogs...
America Is the Target; Israel Is the Front Line _ Andy Blumenthal _ The Blogs...
 
06052024_First India Newspaper Jaipur.pdf
06052024_First India Newspaper Jaipur.pdf06052024_First India Newspaper Jaipur.pdf
06052024_First India Newspaper Jaipur.pdf
 
Busty Desi⚡Call Girls in Sector 62 Noida Escorts >༒8448380779 Escort Service
Busty Desi⚡Call Girls in Sector 62 Noida Escorts >༒8448380779 Escort ServiceBusty Desi⚡Call Girls in Sector 62 Noida Escorts >༒8448380779 Escort Service
Busty Desi⚡Call Girls in Sector 62 Noida Escorts >༒8448380779 Escort Service
 
Politician uddhav thackeray biography- Full Details
Politician uddhav thackeray biography- Full DetailsPolitician uddhav thackeray biography- Full Details
Politician uddhav thackeray biography- Full Details
 
Embed-4.pdf lkdiinlajeklhndklheduhuekjdh
Embed-4.pdf lkdiinlajeklhndklheduhuekjdhEmbed-4.pdf lkdiinlajeklhndklheduhuekjdh
Embed-4.pdf lkdiinlajeklhndklheduhuekjdh
 
04052024_First India Newspaper Jaipur.pdf
04052024_First India Newspaper Jaipur.pdf04052024_First India Newspaper Jaipur.pdf
04052024_First India Newspaper Jaipur.pdf
 
Embed-2 (1).pdfb[k[k[[k[kkkpkdpokkdpkopko
Embed-2 (1).pdfb[k[k[[k[kkkpkdpokkdpkopkoEmbed-2 (1).pdfb[k[k[[k[kkkpkdpokkdpkopko
Embed-2 (1).pdfb[k[k[[k[kkkpkdpokkdpkopko
 
{Qatar{^🚀^(+971558539980**}})Abortion Pills for Sale in Dubai. .abu dhabi, sh...
{Qatar{^🚀^(+971558539980**}})Abortion Pills for Sale in Dubai. .abu dhabi, sh...{Qatar{^🚀^(+971558539980**}})Abortion Pills for Sale in Dubai. .abu dhabi, sh...
{Qatar{^🚀^(+971558539980**}})Abortion Pills for Sale in Dubai. .abu dhabi, sh...
 
WhatsApp 📞 8448380779 ✅Call Girls In Chaura Sector 22 ( Noida)
WhatsApp 📞 8448380779 ✅Call Girls In Chaura Sector 22 ( Noida)WhatsApp 📞 8448380779 ✅Call Girls In Chaura Sector 22 ( Noida)
WhatsApp 📞 8448380779 ✅Call Girls In Chaura Sector 22 ( Noida)
 
declarationleaders_sd_re_greens_theleft_5.pdf
declarationleaders_sd_re_greens_theleft_5.pdfdeclarationleaders_sd_re_greens_theleft_5.pdf
declarationleaders_sd_re_greens_theleft_5.pdf
 

Figures of Catalonia 2011

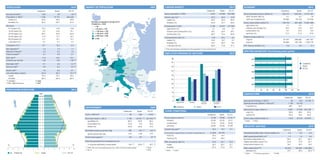
  • 1. POPULATION 2010 Catalonia Spain 234 7 535 49.5 50.5 93 47 151 49.3 50.7 116 502 520 48.8 51.2 DENSITY OF POPULATION 2009 Density (inh/km2) Population (1 000)(1) males (%) females (%) Structure 0-14 years (%) 15-24 years (%) 25-49 years (%) 50-64 years (%) 65-79 years (%) ≥ 80 years (%) 15.5 9.7 40.5 17.5 11.7 5.1 14.8 10.3 40.0 17.7 12.1 5.1 15.7 12.2 1.3 3.4 4.7 1.3 2.3 3.6 1.7 1.0 2.7 11.3 1.46 10.5 1.39 Density of population (inhab./km2) (Catalonia = 232) < 50 ≥ 50 and < 100 ≥ 100 and < 150 ≥ 150 and < 200 ≥ 200 and < 250 ≥ 250 10.7 1.59 Net Natural increase(2) Total increase(2) Birth rate(2) Children per woman Marriage rate(2) 3.7 Divorce rate(2) 3.6 2.8 Death rate(2) Life expectancy (years) males females 1/01/2011. (2) Per 1,000 inhabitants. 2008 (4) 2007 (1) (3) Estonia 8.3 82.2 79.1 85.3 (1) This Latvia (4) (4) 2.0 United Kingdom 17.8 18.6 16.7 39.5 Germany Belgium (3) France 20.1 19.7 20.5 41.6 9.7 9.7 9.6 21.1 2010 Czech Rep. Slovakia Austria Catalonia Italy 2010 10 961 988 1.7 18.7 6.0 73.6 External trade (million €) imports exports 67 247 48 600 238 082 185 799 1 501 761 1 348 778 ICP. Annual variation (%) 2.0 2.0 2.1 GPD PER INHABITANT (Purchasing power parity) Catalonia Spain EU-27 2009 2008 2007 2006 0 10 ENVIRONMENT Catalonia 55 - 59 Area (1 000 km2) 50 - 54 Municipal waste (1 000 t) landfilled (%) incinerated (%) others (%) 45 - 49 40 - 44 35 - 39 30 - 34 Municipal waste per person (kg) 25 - 29 kg per person per day 20 - 24 15 - 19 Grennhouse 10 - 14 EU-27 32 506 4 199 39.2 15.0 45.8 26 351 56.9 9.2 33.9 (2) (2) % of gross electricity consumption % 524 (2) 575 1.58 1.44 124 127 87 (3) 16.7 (2) 0-4 0 Spain 1 2 3 4 5 EU-27 6 (1) (3) 1990=100 (non-fluorinated gases) and 1995=100 (fluorinated gases). UE-15 20.6 market services (2) (2) 2008 (4) 2007 Spain Hourly labour costs (€) industry construction services Gender pay gap(2) Consumption expenditure of private households (€) food (%) housing (%) Risk-of-poverty rate (%) males females (1) 2008 (2) 60 80 100 120 140 2010 EU-27 2010 2009 Spain EU-27 21.82 23.38 21.81 20.90 20.96 22.22 19.42 20.49 21.30 22.11 19.36 21.89 18.5 16.7 17.1 31 889 14.3 31.9 29 782 14.4 30.0 : : : 19.9 18.5 21.3 20.7 20.1 21.3 16.4 15.7 17.1 (1) Spain EU-27 Agricultural holdings (1 000)(1) Agricultural area utilised (1 000 ha)(1) cropland (%) non-market services Catalonia (2) 562 (4) industry 4 403 261 840 39.5 19.5 41.0 1.54 8.8 agriculture LIVING CONDITIONS Electricity generated from renewable sources 5-9 gases(1) Spain 40 Catalonia Catalonia 2009 20 AGRICULTURE 5 Cyprus 0 60 - 64 Catalonia 961 592 2.7 15.8 10.2 71.3 15 Greece Malta 65 - 69 0 192 724 1.1 18.5 9.1 71.2 20 Portugal 70 - 74 1 Gross value added (million €) agriculture (%) industry and energy (%) construction (%) services (%) 30 Romania 75 - 79 2 12 257 461 1.8 24 400 2010 80 - 84 3 1 062 591 -0.1 23 100 25 85 and over 4 209 727 0.1 28 262 35 Hungary age 5 Gross domestic product (million €) GDP. Growth rate (%) GDP per inhabitant (€) Bulgaria POPULATION STRUCTURE 6 EU-27 40 Slovenia Spain % Spain % Luxembourg 9.7 79.4 76.4 82.4 217 008 4.7 28.7 66.6 2010 Catalonia 45 Poland (3) 18 457 3.8 23.0 73.2 rate has been calculated for the population 15 year old and over. Netherlands Ireland 57.6 65.0 50.6 emploYED PERSONS BY SECTORS Lithuania Denmark 4.5 2.2 7.9 82.3 79.3 85.2 Swden 240 089 59.3 67.3 51.7 3 138 2.1 28.1 69.7 Unemployment rate (%) males (%) females (%) < 25 year old (%) Finland 23 089 ECONOMY EU-27 62.2 69.7 55.0 Employment (1 000) agriculture (%) industry and construction (%) construction (%) Spain 3 815 Activity rate (%)(1) males (%) females (%) 6.5 migration(2) 2010 Active population (1 000) (3) 15.6 12.1 35.8 19.1 12.7 4.7 Foreigners (%)(1) LABOUR MARKET Catalonia EU-27 59 1 148 69.1 972 23 753 64.7 13 700 : : Agricultural output (milion €) crop (%) animal (%) 3 967 38.4 58.5 37 829 345 168 65.4 54.5 33.5 40.9 Gross value added (million €) 1 815 22 016 (1) 2009 (2) 2007 INDUSTRY AND R&D 143 810 2010 Catalonia R&D researchers(1)(2) females (%) 2009 (2) Full time equivalent. Spain EU-27 4.5 0.9 6.8 1.7 58.4 22.9 18.7 Industrial production index. Annual variation (%) R&D expenditure/GDP (%)(1) Business enterprises (%) Higher education sector (%) Government sector (%) (1) (2) 1.4 52.1 27.8 20.1 2.0 63.0 23.7 13.2 26 932 37.7 (3) 2008 133 803 1 584 880 38.5 29.3 (3)
  • 2. ENERGY 2009 Catalonia Spain EU-27 Production of primary energy (1 000 toe) 6 273 (1) 29 579 812 221 Primary energy consumption (1 000 toe) coal (%) oil and petroleum products (%) natural gas (%) 26 840 1.1 48.2 24.9 (1) 130 188 8.1 48.3 24.0 1 702 755 15.8 36.8 24.6 nuclear energy (%) 19.7 renewable sources (%) 6.1 Final energy consumption (1 000 toe) industry (%) transport (%) domestic and others (%) 16 173 31.6 39.9 28.4 Energy consumption per inhabitant (1 000 toe) Electricity consumption per inhabitant (kW/h) (1) 2007 (2) 10.4 3.7 6 350 2008 13.6 9.3 (1) (1) (2) 9.0 88 966 26.7 42.5 30.7 1 113 671 24.2 33.0 42.8 2.8 5 563 3.4 5 433 2010 Catalonia Spain 452 480 99.5 0.5 96.6 3.4 77.5 22.5 202 282 35 416 564 384 153 387 8 187 375 796 396 417 2 714 34 500 Passenger cars per 1 000 inhabitants Inland freight transport (t/km)(1) road (%) rail and waterway (%) Railways. Passengers (1 000) Airports. Passengers (1 000) Road accidents. Killed people(1) 2009 (2) EU-27 (1) 473 (1) (2) 2007 Spain 68.3 59.0 67.7 70.0 65.3 58.0 62.0 55.0 22.6 17.0 13.4 10.0 12.0 32.6 74.4 32.0 65.0 32.0 72.0 Enterprises having received orders on-line (1) Population aged 16 to 74 who access at least once a week. (2) 2009 (2) EDUCATION 2010 Catalonia Spain EU-27 5 581 49.2 50.8 41 953 44.4 55.6 736 42.0 58.0 3 302 54.1 45.9 28 078 43.8 56.2 65 107 69.6 30.4 364 864 73.2 26.8 2 233 396 67.6 32.4 Bed-places (1 000) hotels (%) others (%) Nights spent (1 000) hotels (%) others (%) 2009 PARLiaMENT of Catalonia 2010 2010/11 C's ERC 3.39 SI CiU 3.29 38.43 7.00 PSC 18.38 ICVEUiA Spain 1 487 22.2 30.1 30.9 16.8 9 443 18.7 29.8 32.5 19.1 107 558 13.6 26.1 42.1 18.1 250 9.7 49.9 5.7 10.8 23.9 1 801 10.5 42.1 10.5 12.6 24.5 19 470 12.5 43.2 10.2 14.1 20.0 Students (1 000) pre-primary education (%) primary education (%) secondary education (%) tertiary (%) University. Students (1 000) humanities (%) social science (%) science (%) health (%) engineering and architecture (%) 2009/10 EU-27 (1) (1) 10 28 10 34 62 number of seats PPC 18 12.37 2010 187 5 956 25.0 64.1 11.0 13.4 11.3 190 6 059 17.8 67.9 14.3 9.3 6.7 204 6 506 13.8 68.8 17.4 10.4 3.2 Active population (1 000) Activity rate (%) Employment (1 000) Unemployment rate (%) 2 249 51.0 1 940 12.6 2 533 52.5 2 223 12.2 3 092 57.9 2 826 8.6 3 815 62.2 3 138 17.8 GDP (million €) GDP per inhabitant (€) Exports (million €) External trade ratio (Exp. + Imp./GDP) (%) 17 309 2 909 2 073 34.8 61 865 10 190 8 729 42.6 135 709 20 353 36 309 68.9 209 727 28 262 48 600 55.2 392 370 147 4 391 14 863 11 830 168 715 504 240 6 850 54 033 16 547 189 883 663 319 7 181 93 442 20 931 235 471 676 211 7 418 197 638 27 585 287 0.8 303 1.22 1 816 1.63 6 514 1.54 10 658 University. Students (1 000) Inhabitants per doctor (1) HEALTH Per 1 000 live births. 96 398 165 245 220 213 250 198 2010 Catalonia Spain Hospital beds (per 1 000 inhabitants) 4.7 3.2 5.5 (1) Infant mortality rate (per 1 000 live births) 2.6 3.2 4.3 (1) 237.0 221.7 3.8 261.5 221.0 6.2 382.4 248.5 7.9 Main causes of death (per 100 000 circulatory system neoplasia transport accidents (1) 2009 inhabitants)(1) EU-27 (1) BUDGET Parliament (%) Presidential Department (%) Governance and Institutional Relations (%) Economy and Knowledge (%) Education (%) Health (%) Home Affairs (%) Territory and Sustainability (%) www.idescat.cat 234 7 535 15.5 67.7 16.8 11.3 2.6 Municipal waste (kg/inh./day) Protected areas (km2) 2011 Government of Catalonia. Expenditure (million €) 32 630 votes (%) 7.37 (1) 454 583 44.8 55.2 Tourist establishments hotels (%) others (%) (2) 2001 Cement consumption per inhabitant (kg) Vehicles (per 1 000 inhabitants) Vehicles registrations (1 000) Credit institutions. Local units Deposits (million €) Visitors (1 000) Hotel bed-places (1 000) 31.0 (%)(2) 1991 Population density (inhab./km2) Population (1 000) < 15 years (%) 15-64 years (%) ≥ 65 years (%) Birth rate (per 1 000 inhabitants) Infant mortality rate(1) 65.0 68.0 62.0 Individuals who have purchased goods/services (%) 1980 70.0 Internet. Regular users (%)(1) males females E-government. Usage (%) individuals(1) enterprises EVOLUTION OF INDICATORS EU-27 Internet. Households with acces (%) (1) TOURISM (1) 2010 Catalonia Catalonia TRANSPORT (1) INFORMATION SOCIETY 0.2 Culture (%) 1.7 Agriculture. Livestock. Fisheries. Food and Natural Enviroment (%) 1.1 Social Welfare and Family (%) 3.9 Enterprise and Labour (%) 15.0 Justice (%) 28.0 Public Debt (%) 3.7 Local entities (%) 4.3 0.9 1.3 6.4 3.5 2.8 18.3 8.2 Edited by: Statistical Institute of Catalonia www.idescat.cat Generalitat de Catalunya is the national selft-government of Catalonia made up of the three institutions: the Parliament. the President and the Executive Council or Government. Sources: Government of Catalonia, Idescat, National Statistics Institute, ministries and Eurostat. Figures of Catalonia Updated: 15/11/2011Eurostat. Revised edition: 12/01/2012 © Generalitat de Catalunya Institut d'Estadística de Catalunya Legal deposit: B-40830-2011 Printed by: Gràfiques Vilanova SL ED PAPER R E CYCL Generalitat de Catalunya Government of Catalonia