MidasLP expects 2011 revenues of over $1 billion. Founded in 2007, Zynga is the largest social-network game developer and has generated over $1.5 billion in cumulative bookings since its inception. As of September 2011, Zynga’s games have over 232 million monthly active users on Facebook.
3.
Busin
ness Model(s
s)
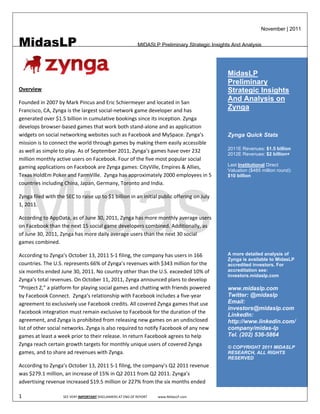
Zynga operates its
s games as liv
ve services that allow players to genera ally play for “f
free.” Zynga g
generates rev
venue
primarily from the
e in‐game sale of virtual go
oods and advvertising.
Revenu
ue Distributio Six Month
on ‐ hs Ended Jun
ne 30
100%
3.
.73% 5.39%
95%
90%
85%
80%
75%
96
6.27% 94.61%
70%
65%
60%
55%
50%
2010
2 2011
Data Source: Zynga's S‐1 Filing Virtual G
Goods Adve
ertising
Onlin
ne Game ‐ Zynga provides players with the opportun nity to purcha
ase virtual go
oods that enhance their ga ame‐playing
experience. Zynga a believes players choose t to pay for virt
tual goods for the same reeasons they are willing to p pay for other
forms of entertainnment. They e enjoy the add ditional playin
ng time or added convenie ence, the ability to personalize their
own game boards s, the satisfac
ction of levelin
ng up and the e opportunityy for sharing c
creative expreessions. Zyngga also
eves players are more likely
belie y to purchasee virtual goodds when they are connecte ed to and play
ying with thei ir friends,
whet ther those frie
ends play for free or also ppurchase virtual goods. Zyynga is suppor rted via direc
ct credit card payments
and ppartner businnesses
n example of monetization
As an n, several Zyn
nga games reqquire an "ene ergy" characte eristic to play
y. Engaging in “Missions”
consumes a certain amount of f energy. A character’s ene
ergy level slowwly replenishe es after a feww minutes or sseveral
hours. After energgy is replenishhed, players c
can engage in
n additional m missions. Players can receiv ve premium c currency or
gamee credits to re
eplenish theirr character’s e
energy by acc
cepting credit t card offers, taking surveyys or buying sservices from
Zynga's partners. Players may a also purchasee game creditts directly from Zynga via c credit cards oor PayPal. In M
March 2010,
Zynga started selling prepaid cards for virtuual currency at more than 1 12,800 stores s across the UUS.
In Maay 2010, Zyngga entered into an addend dum with Facebook requir ga transition its payment m
ring that Zyng method to
Facebook Credits, , Facebook’s pproprietary p
payment meth hod, as the pr
rincipal meanns of payment t within Zynga’s games
playeed through Faacebook. Und der this adden
ndum, Facebo ook compensates Zynga an n amount equ ual to 70% of the face
valuee of Facebook chased by players for use in the games.
k Credits purc . Zynga recognizes revenue e net of amouunts retained
d
by Faacebook. Prio
or to this adde
endum, Zynga a used third‐pparty paymen nt processors and paid theese processors service fees
s
rangiing from 2% tto 10% of thee purchase priice of virtual g
goods which were recorde ed in cost of r
revenue. Play
yers can
purchhase Faceboook Credits from Facebook, directly through games or through gam me cards purc chased from retailers and
distri
ibutors. On platforms othe book, players purchase virt
er than Faceb tual goods through various widely acce epted
3 SEE VERY IMPORT AT END OF REPORT www.MidasLP.com
TANT DISCLAIMERS A
5.
Management Team
Mark Pincus | Founder, CEO and Chief Product Officer
• Mark founded Zynga in 2007 to enable users to build social connections through games. Before Zynga, Mark
founded Tribe.net, one of the first social networks in the industry. He also founded Support.com, a leading
provider of support automation software that later went public. Before Support.com, Mark founded FreeLoader,
the first web‐based consumer push company and sold it months later.
Cadir Lee | Chief Technology Officer
• Cadir oversees the development and innovation of Zynga’s technology platform and large‐scale infrastructures.
He also manages the analytics, network operations, security and India operations team. Prior to Zynga, Cadir
was CTO of Support.com for 11 years with Zynga founder Mark Pincus.
John Schappert | Chief Operating Officer
• John is responsible for Zynga’s day‐to‐day operations, including the game studios, mobile division and
administration functions. Before Zynga, John was COO at Electronic Arts, responsible for multiple divisions of the
company. Prior to EA, John was Corporate Vice President at Microsoft and led the LIVE, Software, and Services
division of the Interactive Entertainment business that oversaw Xbox live and Xbox software.
Dave Wehner | Chief Financial Officer
• Dave is responsible for the finance, strategy and corporate development teams at Zynga. Before joining Zynga,
Dave was managing director at Allen & Company where he led corporate finance teams responsible for capital
raises and M&A transactions with a focus on the firm’s Silicon Valley clients. Prior to Allen & Company, Dave
worked as the VP Corporate Development for technology‐focused investment banking firm Hambrecht & Quist,
where he was involved in numerous M&A and financing transactions.
Owen van Natta | Chief Business Officer
• Owen is responsible for the company’s revenue strategy, corporate development, international expansion, and
brand. Previously, Owen was consulting for Zynga across a number of critical business functions and also
currently serves on the Board of Directors. Prior to Zynga, Owen was CEO of MySpace where he was responsible
for all aspects of the company’s strategic vision and the execution of its global business initiatives. Before
MySpace, Owen served as COO at Facebook, where he focused on revenue operations, business development
and strategic partnerships.
Colleen McCreary | Chief People Officer
• Colleen has over a decade of experience in recruiting, retaining and managing talent. Prior to Zynga, Colleen was
the global corporate human resources director at Electronic Arts. Before Electronic Arts, Colleen was a senior
technical recruiter and technical support manager at Microsoft.
5 SEE VERY IMPORTANT DISCLAIMERS AT END OF REPORT www.MidasLP.com
6.
Investors And Valuation
Firm Board # shares Unit share Investment Valuation Date Notes
Member price Amount Est.
Reid 2,939,488 $0.0564375 N/A January Angel investment,
Hoffman 2007 Reid Hoffman
joins the board
Reid Hoffman | Peter Brad Feld 33,706,080 $0.125 $10 Million January Series A
Thiel | Bob Pittman | 2008 financing, Brad
Andy Russell | Brad Feld Feld joins the
board
Bing 54,639,968 $0.4209375 $29 Million July 2008 Series B financing,
Gordon Bing Gordon of
Kleiner Perkins
joins the board
Kevin Rose $180 $1.5 ‐ $3 December Series C financing
Million Billion 2009
$300 $4.5 June 2010 Series D financing
Million Billion
1,782,010 $14.029115 $485 $10 February Series E financing
Million Billion 2011
Summary of Ownership Table (Estimated)
Name Class B Class C Preferred
Shares % Shares % Shares %
Mark Pincus 91,385,846 16.0 20,517,472 100
Kleiner Perkins Caufield and Byers 65,159,896 11.2 26,488,778 ‐
William Gordon 61,241,020 10.9
Brad Feld 34,560,060 6.1
Institutional Venture Partners 34,326,072 6.1 27,768,236 ‐
Foundry Venture Capital 34,560,060 6.1 27,768,236 ‐
Avalon Ventures 34,680,608 6.1 31,020,542 ‐
Union Square Ventures 30,738,892 5.4 7,436,896 ‐
Reid Hoffman 3,109,744 < 5.0 2,939,488 ‐
Mark Vranesh 2,174,108 < 5.0
Owen Van Natta 1,687,500 < 5.0
Reginald Davis 1,378,436 < 5.0
6 SEE VERY IMPORTANT DISCLAIMERS AT END OF REPORT www.MidasLP.com
7.
Jeffrey Katzenberg 388,410 < 5.0
Stanley Meresman 70,000 < 5.0
Board Of Directors
Mark Pincus – CEO and Chief Product Officer
Reid Hoffman – Co‐founder of LinkedIn, Greylock Partner
Jeffrey Katzenberg – CEO of DreamWorks Animation
John Schappert – Director and COO
Owen Van Natta – EVP of Business
Bing Gordon – Partner at Kleiner Perkins Caufield & Byers, Former Chief Creative Officer, Electronic Arts
Brad Feld – Managing director at Foundry Group
Stanley Meresman ‐ Director
Management Equity/Commitment
Founder, CEO and Chief Product Officer Mark Pincus owns an estimated 16% of Class B shares and 100% of Class C
shares in the company which is estimated to be worth over $10 billion in value. We believe Mark is truly committed to
the long‐term success of Zynga.
Selected Acquisitions And M&A Risk Assessment
Zynga has been targeting game developers and mobile applications to make more social games for Facebook and other
mobile devices. The mobile game development is a large part of Zynga’s future strategy as it tries to rapidly expand into
the smartphone and tablet game markets.
July 2011 – Five Mobile – Mobile application development
May 2011 – DNA Games – Game, video and entertainment development
April 2011 – Wonderland Software – Game software
April 2011 – JamLegend – Online music game
March 2011 – Floodgate Entertainment – Videogame developer
Janaury 2011 – Area/Code – Videogame developer
January 2011 – Flock – Web browser
December 2010 – Newtoy – Game developer
October 2010 – Bonfire Studios – Videogame developer
September 2010 – Dextrose – Videogame developer
7 SEE VERY IMPORTANT DISCLAIMERS AT END OF REPORT www.MidasLP.com
9. • Words with Friends – Words with Friends is a social mobile game, similar to Scrabble which challenges players
to create the highest‐scoring words while playing against family and friends.
Zynga’s Virtual Goods are digital representations of real world goods, such as Big Ben in CityVille, poker chips in Zynga
Poker or an aircraft carrier in Empires & Allies. According to Zynga’s S‐1 filing, players created more than three billion
virtual goods per day on average in June 2011. Virtual goods allow players to extend their play sessions, enhance or
personalize their game environments, accelerate their progress in games, and share and trade with friends.
In addition to the portfolio of social games, Zynga also offers players network features, which provide players real‐time
updates during game play on what is happening in Zynga’s games and with their friends who are playing Zynga’s games.
These products enable players to discover new games, connect with their friends by sending and receiving messages,
collaborate with their friends by giving and receiving help to advance in a game, navigate among games, claim rewards
to level up and earn virtual currency across the portfolio of games.
To support the growth of its business Zynga has invested extensively in developing a proprietary technology stack.
Zynga’s proprietary technology stack includes datacenter and cloud computing management, a shared code base,
network and cross‐promotional features, proprietary data analytics, monetization and internationalization. Zynga
believes that its technology stack is a competitive advantage and will continue to innovate and optimize the stack to
extend its technology leadership. Zynga’s technology stack has the ability to handle sudden bursts of activity for millions
of players over a short period of time with high levels of performance and reliability.
Zynga’s physical network infrastructure operates a combination of datacenters and public cloud datacenters linked with
high‐speed networking. Zynga uses commodity hardware, and its architecture is designed for high availability and fault
tolerance while accommodating the demands of social game play.
Zynga develops its architecture to work effectively in a flexible cloud environment that has a high degree of
elasticity. For example, Zynga’s automatic provisioning tools allow for an additional 1,000 servers in a 24‐hour period in
response to demand. Zynga operates at a scale that consistently delivers more than one petabyte of content per day.
9 SEE VERY IMPORTANT DISCLAIMERS AT END OF REPORT www.MidasLP.com
10.
SWO
OT Analysis
Stren
ngths Weakne
esses
• #1 market t share in the s
social gaming vertical • Untested lon ng‐term reven nue model
• Sophistica ated managem ment team wit th depth of • Rely on smal ll percentage oof players for nearly all of
knowledge e of the markeet the revenue
• Large and global community of players • Market appe ears to be plat
teauing. Zynga a needs
• Leading po ortfolio of high quality socia
al games additional/al
lternative reveenue sources. .
• Scalable te echnology infr rastructure annd game engin nes • Revenue con ncentration wi ith Facebook.
• Powerful n network effec cts
• Solid finan ncial model
• Partnerships with Faceb book and Google +
Oppoortunities s
Threats
• Launch ne ew games to re etain and further monetize • Revenue con ncentration wi ith Facebook.
players • Potential sec
curity breache es, computer v viruses and
• Integrating g with mobilee devices to inccrease user computer ha
acking
engageme ent • Industry growwth will attrac
ct new develo opers who will
• Capitalizin ng on existing revenue sourc ces through compete for the same pot tential users
effective u
use of data forr targeting adss at the right
audience
• Further integration with h social netwoorks in Asia and
Europe
Competitive Anal
lysis
Bargaining Power of
Suppliers
Faceboo ok holds signficanaat
leverrage over Zynga .
Facebook has a large use er
base and established
platf
form but Zynga's
products provide Faceboo ok
with a solid revenue
stream. Zynga is currently y
develop ping its own gaminng
platform.
Intensitty of Competition Th
hreat of Entry
Compe etition within the Threeat of Substitute
Signficaant industry growth Prooducts/Services
broader industry is that wwill attract fiercer
intense. . Electronic Arts is Alternative gaming
commpetition. Viral platfo
orms and consoles s
a signific
cant player in this distrib
bution and direct‐
nichee. Existing and are available but Zynga a
responnse marketing with h offers the most
o
potentia al players may be inexxpensive game
attracted to competing develooped online gamin ng
develoopment costs may y plaatform for social
forms oof entertainment poteentially threaten networks
Zynga a's market share
Bargaining Power of
Buyeers Buyers do not
hold significant leverage
e
bec cause they are
fragme ented and Zynga iss
a free service
a
10 SEE VERY IMPORTANT DISCLAIMERS
S AT END OF REPORT LP.com
T www.MidasL
12.
Selec
cted Competi
itors
Electronic A
Arts, Inc. is a m
major America an developer r, marketer, p publisher and distributor o of
video games s. Founded in n 1982 by Trip p Hawkins, the company w was a pioneer of the early
home comp puter games in ndustry and w was notable f for promoting g the designers and
programmers responsible for its game es. EA is curre
ently the #1 p publisher in W
Western
markets wit th a 16% segm ment share an nd the second d largest socia al games commpany on
Facebook. E EA’s, The Sims s Social is currently the fasstest growing game on Fac cebook. The
company is publicly trade ed on the NA ASDAQ under the ticker sym mbol: ERTS.
Founded in 2007 by Krist tian Segerstra ale, Sebastienn de Halleux, S Sami Lababiddi, and Shukri
Shammas, P Playfish is the creator of so ocial games fo or users on so ocial platform
ms such as
Facebook, M MySpace, Beb bo, Google, iP Phone and Android. Playfis sh has seven ggames that
are top 10 hhits on Facebo ook, including g Pet Society which genera ates more tha an 11 million
people ever ry month. Play yfish was acq quired by Elec ctronic Arts inn November 2 2009 for $400 0
million.
Founded in 2008, Playdo om is a promin nent online games provide er that is popular on
Facebook an nd MySpace. As of July 201 11, Playdom has a total of f over 27 milli
ion players.
On July 27, 22010, The Wa alt Disney Com mpany acquir red Playdom for $763 million. At the
time of the acquisition, P Playdom was the No.3 soci ial gaming company with a about 42
million mon nthly players.
Founded in 2008 by Jeffr rey Tseng and d Suren Marko osian, CrowdStar is a globa al leader in
social gaminng attracting t tens of millions of users ev very month. T Their most poopular games s
include It Giirl, Mighty Pir
rates, Happy A Aquarium, Ha appy Pets, Ha appy Island annd Top Girl.
Founded in 2000, PopCap Games is a video game d developer and d publisher based in
Seattle, Was shington. Mo ost of PopCap games are av ree; however the full
vailable for fr
version requuires a fee. Po opCap’s most t famous gam me is Bejewele ed, which hass sold over 50 0
million unitss across all major platform ms. PopCap wa as acquired bby Electronic AArts in July
2011 for $1. .3 billion.
Vostu is a so
ocial gaming c company that t was foundeed in 2007. Th he company w was initially a
social netwoork for Latin AAmerica. Vost tu then launcched its first s
successful soccial game in
June 2009 called “Joga Craque”. As of f January 2010, Vostu’s far rming game c called “Mini
Frazenda” g generated 8 m million monthly active user rs and was rat ted #1 social game on the
Orkut platfoorm.
12 SEE VERY IMPORTANT DISCLAIMERS
S AT END OF REPORT LP.com
T www.MidasL
13.
Cursory, Long Term Valuation Thoughts And Valuation Comparables
A common stock comparison table is attached overleaf. Deep valuation thoughts/cash flow models and analysis are
available to MidasLP registered accredited investors. Please fill out our accredited investor form at investors.midaslp.com
to access deep insights and information.
Gaming Services Comparable Company Analysis
Price Shares Outstanding Market Valuation (In Millions) Earnings Per Share Forward P/E
Company Ticker (10.19.11) (In Millions) Equity Value Enterprise Value 2011 2012 2013 2011 2012 2013
Electronic Arts ERTS $24.51 329.94 $8,086.83 $6,913.83 $0.94 $1.20 $1.20 26.07x 20.43x 20.43x
Activision Blizzard, Inc. ATVI $13.04 1140 $14,865.60 $12,531.60 $0.79 $0.93 NA 16.51x 14.02x NA
Take‐Two Interactive TTWO $14.17 86.74 $1,229.11 $1,089.59 NA $0.18 $2.36 NA 78.72x 6.00x
THQ Inc. THQI $1.90 68.33 $129.83 $110.79 NA ($0.19) $0.26 NA NA 7.31x
Majesco Entertainment COOL $3.41 41.3 $140.83 $121.16 $0.40 $0.44 NA 8.53x 7.75x NA
Glu Mobile Inc. GLUU $3.15 63.16 $198.95 $172.55 ($0.27) ($0.24) NA NA NA NA
Mean $10.03 $288.25 $4,108.52 $3,489.92 $0.47 $0.39 $1.27 17.04x 30.23x 11.25x
Median $8.23 $77.54 $714.03 $631.07 $0.60 $0.31 $1.20 16.51x 17.22x 7.31x
Financial Statistics (In Millions)
Company LTM Sales LTM Gross Profit LTM Operating Income LTM Depreciation/Amortization LTM EBITDA LTM Net Income
Electronic Arts $3,773.00 $2,256.00 ($183.00) $55.00 ($128.00) ($151.00)
Activision Blizzard, Inc. $4,767.00 $2,744.00 $799.00 $0.00 $799.00 $656.00
Take‐Two Interactive $1,095.86 $439.31 $39.89 $14.48 $54.37 $13.44
THQ Inc. $711.03 $166.30 ($145.76) $0.00 ($145.76) ($144.44)
Majesco Entertainment $123.54 $45.02 $13.00 $0.26 $13.26 $9.20
Glu Mobile $65.22 $47.07 ($10.43) $0.09 ($10.34) ($11.47)
Mean $1,755.94 $949.62 $85.45 $11.64 $97.09 $61.96
Median $903.45 $302.81 $1.29 $0.18 $1.46 ($1.14)
Financial Statistics LTM Profitability Margins Enterprise Value
Company LTM EPS LTM PE Gross Profit EBITDA Net Income LTM Sales LTM EBITDA
Electronic Arts ($0.16) NA 59.79% ‐3.39% ‐4.00% 1.83x NA
Activision Blizzard, Inc. $0.74 17.62x 57.56% 16.76% 13.76% 2.63x 15.68x
Take‐Two Interactive $0.17 83.35x 40.09% 4.96% 1.23% 0.99x 20.04x
THQ Inc. ($1.96) NA 23.39% ‐20.50% ‐20.31% 0.16x NA
Majesco Entertainment $0.28 12.18x 36.44% 10.73% 7.45% 0.98x 9.14x
Glu Mobile ($0.20) NA 72.17% ‐15.85% ‐17.59% 2.65x NA
Mean ($0.19) 37.72x 48.24% ‐1.22% ‐3.24% 1.54x 14.95x
Median $0.00 17.62x 48.83% 0.78% ‐1.39% 1.41x 15.68x
13 SEE VERY IMPORTANT DISCLAIMERS AT END OF REPORT www.MidasLP.com
14.
Market Capitalization/Sales
Market Valuation (In Millions)
Company Ref. Market Capitalization LTM Sales Market Capitalization/Sales
Twitter 1 $8,000.00 $45.00 177.78x
Facebook 2 $50,000.00 $1,860.00 26.88x
Zynga 3 $10,000.00 $888.47 11.26x
Groupon 4 $4,750.00 $1,290 3.68x
eBay 5 $39,393.14 $13,312.60 2.96x
Amazon 6 $93,629.48 $43,594.00 2.15x
LinkedIn 7 $8,205.55 $413.36 19.85x
Mean $30,568.31 $8,771.92 34.94x
Median $10,000.00 $1,290.00 11.26x
Ref.
(1) Twitter's Enterprise Value is based off last direct financing round. Twitter's sales are based off eMarketer's revenue estimates for 2010
(2) Facebook's Enterprise Value is based off last direct financing round. Facebook's sales are based off eMarketer's revenue estimates for 2010
(3) Zynga's Enterprise Value is based off last direct financing round. Zynga's LTM Sales are based off its
(4) Groupon's Enterprise Value is based off last direct financing round. Groupon's LTM Sales are based off its S‐1 filing
(5) Source: eBay's 10‐Q filing on 10/21/2011
(6) Source: Amazon's 10‐Q filing on 10/26/2011
(7) Source: LinkedIn's 10‐Q filing on 8/9/2011
Profitability Margins
LTM Financial Statistics (In Millions) LTM Profitability Margins
Ref. LTM Gross Profit LTM Operating Profit LTM Net Income Gross Profit Operating Profit Net Income
Zynga 1 $641.22 $154.95 $88.36 72% 17% 10%
Groupon 2 $1,103.00 ($554.54) ($527.71) 86% ‐43% ‐41%
eBay 3 $9,455.40 $2,775.24 $2,284.83 71% 21% 17%
Amazon 4 $9,819.00 $1,076.00 $871.00 23% 2% 2%
LinkedIn 5 $341.65 $27.58 $20.16 83% 7% 5%
Mean $4,272.05 $695.85 $547.33 67% 1% ‐1%
Median $1,103.00 $154.95 $88.36 72% 7% 5%
Ref.
(1) Source: Zynga's Amended S‐1 filing on 10/13/2011
(2) Source: Groupon's Amended S‐1 filing on 11/1/2011
(3) Source: eBay's 10‐Q filing on 10/21/2011
(4) Source: Amazon's 10‐Q filing on 10/26/2011
(5) Source: LinkedIn's 10‐Q filing on 8/9/2011
Concerns
Zynga’s bookings dropped from $287 million in Q1 2011 to $275 million in Q2 2011. Bookings represent a measure of
the company’s sales in a period. They include all revenue generated in the given period through sales of virtual goods.
Revenue is represented by the sales of virtual goods amortized over the expected life of the virtual goods or as the
goods are consumed. Additionally, Zynga’s EBITDA decreased to $65 million in Q2 2011, from $112 million in Q1 2011.
Net income also decreased from $17 million in Q1 2011, to $1 million in Q2 2011.
According to Zynga’s October 13, 2011 S‐1 filing, Zynga’s monthly active users and daily active users witnessed a decline
in the most recent quarter. Zynga’s monthly active users declined from 236 million in Q1 2011 to 228 million in Q2 2011.
Additionally, Zynga’s daily active users declined from 62 million in Q1 2011 to 59 million in Q2 2011.
14 SEE VERY IMPORTANT DISCLAIMERS AT END OF REPORT www.MidasLP.com
15.
15 SEE VERY IMPORTANT DISCLAIMERS AT END OF REPORT www.MidasLP.com
S T L
16.
Financial Statements
Summary of Income Statement (In Thousands)
Year Ended December 31 Three Months Ended March 31
2008 2009 2010 2010 2011
Revenue $ 19,410 $ 121,467 $ 597,459 $ 100,927 $ 235,421
Total Costs and Expenses 41,993 174,245 471,987 94,612 206,688
Operating Income (22,583) (52,778) 125,472 6,315 28,733
Interest Income 319 177 1,222 81 518
Other Income (Expense) 187 (209) 365 430 (736)
Income (Loss) Before Income Tax Expense (22,077) (52,810) 127,059 6,826 28,515
Provision For Income Taxes (38) (12) (36,464) (391) (16,710)
Net Income (Loss) (22,115) (52,822) 90,595 6,435 11,805
Summary of Balance Sheet (In Thousands)
Year Ended December 31
2009 2010 31‐Mar‐11
Assets
Total Current Assets 222,140 906,214 1,179,775
Other Assets 36,708 206,358 248,574
Total Assets 258,848 1,112,572 1,428,349
Liabilities And Stockholder’s Equity
Total Current Liabilities 234,636 520,650 576,339
Other Liabilities 45,690 109,707 118,209
Total Stockholder’s Equity (21,478) 482,215 733,801
Total Liabilities And
Stockholder’s Equity 258,848 1,112,572 1,428,349
Summary of Cash Flow Statement (In Thousands)
Year Ended December 31 Three Months Ended March 31
2008 2009 2010 2010 2011
Cash Flow Operations $ 11,482 $ 190,995 $ 326,412 $ 89,896 $ 103,657
Cash Flow Investing (21,196) (103,392) (617,438) (103,329) (55,538)
Cash Flow Financing 29,547 14,169 351,437 159 225,249
Net Change in Cash 19,833 101,772 60,495 (13,267) 273,389
16 SEE VERY IMPORTANT DISCLAIMERS AT END OF REPORT www.MidasLP.com
17.
MidasLP Accredited Investor Form
PLEASE FILL OUT THE ATTACHED SUITABILITY FORM IF YOU ARE INTERESTED IN:
(1) More detailed access to our research offerings
(2) Current or future opportunities with our funds; or
(3) Gaining access to our public due diligence data room (this contains a sample of our detailed analysis including collected data from
third parties on companies that we may invest in or target as well as investment reports)
You can also fill out this form online at investors.midaslp.com. Otherwise you can email it to investors@midaslp.com. You may fax it to (202) 478‐
2809 attention "Midas Investor Relations." You may also mail this form to 2751 Hennepin Avenue South, Suite 30, Minneapolis, MN 55408.
Name____________________________________________________________________________________________________________
Address__________________________________________________________________________________________________________
City______________________________ State____________________ Zip_______________ Country_________________
Do one or more of the following apply to you? Please click the check box if applicable.
You are a natural person whose individual, net worth or joint net worth with your spouse exceeds $1,000,000.
You are a natural person who had an individual income in excess of $200,000 in each of the two most recent years or joint income with your
spouse in excess of $300,000 in each of those years and has a reasonable expectation of reaching the same level in the current year.
The investor is a bank as defined in Section 3(a)(2) of the Act or any savings and loan association or other institution as defined in Section
3(a)(5)(A) of the Act whether acting in its individual or fiduciary capacity; any broker or dealer registered pursuant to Section 15 of the
Securities Exchange Act of 1934; any insurance company as defined in Section 2(13) of the Act; any investment company registered under the
Investment Company Act of 1940 or a business development company as defined in Section 2(a)(48) of that act; Small Business Investment
Company licensed by the U.S. Small Business Administration under Section 301(c) or (d) of the Small Business Administration Act of 1958; any
plan established and maintained by a state, its political subdivisions or instrumentality of a state or its political subdivisions for the benefit of its
employees, if such plan has total assets in excess of $5,000,000; employee benefit plan within the meaning of the Employee Retirement
Security Act of 1974 if the investment decision is made by a plan fiduciary, as defined in Section 3(21) of such act, which is either a bank,
savings and loan association, insurance company, or registered investment advisor, or if the employee benefit plan has total assets in excess
of $5,000,000 or, if a self-directed plan, with decisions made solely by accredited investors.
The investor is a private business development company as defined in Section 202(a)(22) of the Investment Advisers Act of 1940.
The investor is an organization described in Section 501(c)(3) of the Internal Revenue Code or a corporation, a Massachusetts or similar
business trust, or partnership) not formed for the specific purpose of acquiring the securities offered, with total assets in excess of $5,000,000.
The investor is an entity in which all of the equity owners are Accredited Investors.
The investor is a trust with total assets in excess of $5,000,000, not formed the specific purpose of acquiring the securities offered, whose
purchase is directed by a sophisticated person as described in rule 506(b)(2)(ii) of the Act.
Signature_______________________________________________________________________________________________________________
Date____________________________________________________________________________________________________________________
You can also fill out this form online at investors.midaslp.com. Otherwise you can email it to investors@midaslp.com. You may fax it to (202) 478‐
2809 attention "Midas Investor Relations." You may also mail this form to 2751 Hennepin Avenue South, Suite 30, Minneapolis, MN 55408.
17 SEE VERY IMPORTANT DISCLAIMERS AT END OF REPORT www.MidasLP.com
18.
DISCLAIMER
Midas, LP (including its officers, employees, members and advisers) provides no warranty or representation whatsoever in connection with any data,
information or matters contained herein or arising from this document which may contain errors and inaccuracies. You are strongly encouraged to
consult an outside financial, legal or other separate adviser in connection with all matters referred to herein. The information herein does not contain any
financial or investment advice and under no circumstances should be construed as financial or investment advice. Midas, LP provides no representation
or warranty regarding the accuracy, completeness, timeliness or suitability for any purpose of this document. This document is not an offer and does not
constitute an offer for the sale of any securities whatsoever in any region whatsoever. By utilizing this report you agree that nothing arising out of this
report shall be cause for any legal action of any kind whatsoever and agree to indemnify MidasLP against any action that you or anyone acting on your
behalf may bring against MidasLP as a result of this report. Such indemnification shall cover all legal expenses incurred by MidasLP and any other costs
or judgments of any kind whatsoever. You also agree that the maximum amount of any liability asserted against MidasLP may not exceed the amounts
of any money that you have paid directly to MidasLP and if you have paid no monies to MidasLP, the maximum liability asserted against MidasLP may
not exceed $100.
DISCLOSURES
Midas, LP may from time to time take positions in securities issued by companies that are mentioned in its research or strategic reports including this
report.
CAUTION CONCERNING FORWARD LOOKING STATEMENTS
The information in this document contains "forward-looking statements" within the meaning of the Private Securities Litigation Reform Act of 1995. These
statements can be identified by the fact that they do not relate strictly to historical or current facts. Forward-looking statements often include words such
as "anticipates," "estimates," "expects," "projects," "intends," "plans," "believes" and words and terms of similar substance in connection with discussions
of future operating or financial performance. Examples of forward-looking statements include, but are not limited to statements regarding the investment
plans and expected performance of Midas.
Our forward-looking statements are based on our current expectations and assumptions regarding our business and performance, the economy and
other future conditions and forecasts of future events, circumstances and results. As with any projection or forecast, they are inherently susceptible to
uncertainty, error and changes in circumstances. Our actual results may vary materially from those expressed or implied in these forward-looking
statements. Important factors that could cause our actual results to differ materially from those in our forward-looking statements include but are not
limited to government regulation, economic, strategic, political and social conditions and the following factors: our ability to deal effectively with an
economic slowdown or other economic or market difficulty; decreased liquidity in the capital markets, changes in tax or monetary policy and changes in
stock and capital markets performance and outlook. It is not our intention now or at any other time to update or correct any errors or any other
information in this document.
MidasLP
MidasLP invests in the world’s best pre-IPO companies. For us, the best companies have high gross and/or net margins, an enormous number of
customers (often> 1 million customers or users), significant global growth prospects and limited competition. Some of the companies that we invest in
have more customers or users than the populations of countries like the United States, United Kingdom or Switzerland. In general, we target private
companies that are vastly superior to many public companies.
18 SEE VERY IMPORTANT DISCLAIMERS AT END OF REPORT www.MidasLP.com