University of New Haven Graduate School Quantitative Profile Sample
•
1 gostou•353 visualizações

Sample quantitative profile for program analysis developed by Marcus Hanscom.

Recomendados
Recomendados
Mais conteúdo relacionado
Último
Último (20)
Destaque
Destaque (20)
University of New Haven Graduate School Quantitative Profile Sample
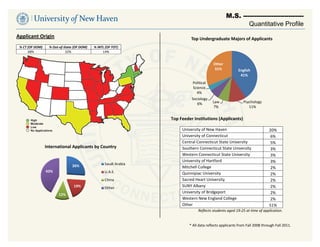
- 1. M.S. ---------------------------- Quantitative Profile Applicant Origin Top Undergraduate Majors of Applicants % CT (OF DOM) % Out‐of‐State (OF DOM) % INTL (OF TOT) 68% 32% 14% Other 31% English 41% Political Science 4% Sociology 6% Law Psychology 7% 11% Top Feeder Institutions (Applicants) University of New Haven 20% University of Connecticut 6% Central Connecticut State University 5% International Applicants by Country Southern Connecticut State University 3% Western Connecticut State University 3% University of Hartford 3% 26% Saudi Arabia Mitchell College 2% 43% U.A.E. Quinnipiac University 2% China Sacred Heart University 2% 19% Other SUNY Albany 2% University of Bridgeport 2% 12% Western New England College 2% Other 51% Reflects students aged 19‐25 at time of application. * All data reflects applicants from Fall 2008 through Fall 2011.
- 2. M.S. ---------------------------- Quantitative Profile Applicant Demographics Applicants by Gender Applicants by Ethnicity American Indian or Alaskan Native 37% 0% 3% Asian 63% Female 19% Black or African Male American 5% 58% Hispanic or Latino 14% No Response Two or more races 1% White, non‐Hispanic Admission Decisions % DOM % INTL % TOT % DOM % INTL % TOT ACC ACC ACC DEN DEN DEN Age at Application 92% 86% 91.0% 8% 14% 9% 70 60 Admitted Student Quality 50 40 AVG GRE DOM AVG GPA INTL AVG GPA 960 3.16 3.08 n 30 20 10 Yields 0 17 21 24 27 30 33 37 40 43 51 57 MS DOM ACC‐ENR UNH DOM ACC‐ENR MS INTL ACC‐ENR UNH INTL ACC‐ENR 63.8% 70.3% 30.8% 18.8% Age Reflects only fall terms from 2008 to 2011. * All data reflects applicants from Fall 2008 through Fall 2011.
- 3. M.S. ---------------------------- Quantitative Profile Enrollment Total Enrollment Fall 2007 Fall 2008 Fall 2009 Fall 2010 Fall 2011 M.S. 25 18 24 34 53 M.S. Concentration 1 6 4 2 3 M.S. Concentration 2 5 5 8 7 4 M.S. Concentration 3 12 4 3 7 10 M.S. Concentration 4 33 16 10 15 20 M.S. Concentration 5 10 8 11 15 16 Total 76 49 49 65 90 Fall New Enrollments Fall 2007 Fall 2008 Fall 2009 Fall 2010 Fall 2011 Domestic International Domestic International Domestic International Domestic International Domestic International M.S. 12 0 9 0 10 0 19 1 22 4 M.S. Concentration 0 0 6 0 1 1 0 0 1 0 M.S. Concentration 2 2 0 2 0 3 0 1 1 2 0 M.S. Concentration 3 4 0 2 0 2 0 4 0 5 0 M.S. Concentration 4 15 0 5 1 5 0 9 0 12 0 M.S. Concentration 5 3 0 3 0 2 0 8 0 8 0 Total 36 0 27 1 23 1 41 2 50 4 * All data reflects applicants from Fall 2008 through Fall 2011.