SlideShare uma empresa Scribd logo
1 de 27
Fill in the blanks:
8.1. The magnitude of the correlation is indicated by the
correlation _____ which can range from -1.00 to +1.00.
8.2. The most common and efficient way to present the
correlations of several variables with each other is by using a(n)
______ table.
8.3. The correlation between two variables can be shown
graphically
by a ________.
8.4.
The null hypothesis predicts that the correlation coefficient is
equal to _______.
8.5.
The Spearman rank order correlation is used when the variables
to be correlated are measured on a(n) ______ scale.
Circle the
correct
answer:
8.6. The hypothesis that states that
r
¹
0 is an example of a(n)
alternative
/
null
hypothesis.
8.7. When an
increase
in one variable is associated with a
decrease
in the other variable, the correlation between these two
variables is
positive/negative
.
8.8. In order to use the Pearson product-moment correlation,
the variables to be correlated should be measured on an
ordinal/interval
scale.
8.9. When the points on a scattergram go from the bottom
left to the top right they represent a
positive/negative
correlation.
8.10.
The true correlation between two variables may be
underestimated
when the variance of one of the variables is
very high/very low
.
8.11.
When the null hypothesis is rejected at
p
<.001, it means that the chance that
r
=0 is
very small/very high
.
8.12.
The null hypothesis is rejected when the
obtained
correlation coefficient is
higher/lower
than the
critical
value.
Answer/compute the following questions:
8.13 Which correlation coefficient (
a
or
b
) shows a stronger relationship between the two variables being
correlated?
a. X
1
&Y
1
:
r
= .85
b. X
2
&Y
2
:
r
= -.94
8.14. Following are two scattergrams (in Figure A and in
Figure B). Four different correlation coefficients are listed
under each scattergram. Choose the coefficient that best
matches each scattergram.
Y Y
·
·
·
·
·
·
·
·
·
·
·
·
·
·
·
·
·
·
·
·
·
·
·
·
·
·
·
·
·
·
·
·
·
·
·
·
·
·
·
X
X
Figure A
Figure B
A1.
r
= .50 B1.
r
= -.57
A2.
r
= .78 B2.
r
= .92
A3.
r
= -.10 B3.
r
= .38
A4.
r
= -.89 B4.
r
= -.91
8.15 Following is a scattergram showing the scores of 8
statistics students on two tests,
X
and
Y
. Each of the first 7 students is represented by a dot and their
scores are listed in the table that follows. Use the scattergram to
find the scores of student #8 on test
X
and test
Y
. The location of this student on the scattergram is represented
by a large dot (•) next to number 8.
Y
1 4
4
·
·
5 2
3
·
·
6 8
2
·
·
7 3
1
·
·
X
1 2 3 4 5
Student #
X
Y
1 2 4
2 3 3
3 2 1
4 5 4
5 2 3
6 2 2
7 1 1
8
? ?
8.16 What do these two scattergrams have in common?
Y Y
·
·
·
··
·
··
·
·
·
·
·
··
·
··
·
·
·
·
·
··
·
··
·
·
··
·
·
·
·
·
·
·
·
·
·
·
·
·
·
·
·
··
·
··
·
·
··
·
·
·
··
·
··
·
·
·
·
·
··
·
··
·
·
··
·
·
··
·
··
·
·
··
8.17
Estimate
(
do not
calculate
!
) the correlation between the advertising spending and sales that
were obtained over a 5 year span. Indicate whether the
correlation is positive or negative, and whether it is high or
low. Explain your answer.
Year
Ad Spending
Sales
1 $21,000 $83
2 15,000 70
3 17,000 68
4 25,000 90
5 19,000 74
8.18
Estimate
(
do not
calculate!
) which of the two sets of consumer research studies (A&B or
X&Y) has a higher correlation. Explain your answer.
Set 1
Set 2
Study #
A
B
Study #
X
Y
1 41 50
1 66 47
2 41 47
2 53 36
3 38 43
3 50 45
4 30 39
4 48 38
5 28 37
5 45 39
8.19 Match the correlation coefficient and the diagram
illustrating this correlation.
a.
r
= .91
b.
r
= .28
c.
r
= .15
8.20. Study the following intercorrelation table. Two surveys
measure
consumer attitudes
and two surveys measure
marketers’ promotional spending
. Knowing that Test 1 measures consumer attitudes, speculate
which is the other consumer attitudes survey (2, 3, or 4) and
which two surveys measure marketers’ promotional spending. (
A hint: the two consumer attitudes surveys should correlate
higher with each other than with the two marketers’ promotional
spending surveys, and the two marketers’ promotional spending
surveys should correlate higher with each other than with the
two consumer attitudes surveys.
)
2
3
4
1
.35
.89
.23
2
.39
.92
3
.34
8.21. Following are results from a study correlating gross
domestic product (GDP) and the Consumer Price Index (CPI)
from a group of 16 Asian countries, a group of 15 European
countries, and the two groups combined.
Group
Correlation (
r
)/
Group Size (
n
)/
Significance (
p
value)
Asia
r
=.59
n
= 16
p
=.02
Europe
r
=.52
n
= 15
p
=.05
Combined
r
=.53
n
= 31
p
=.01
a. Which correlation coefficient is the highest?
b. Which correlation coefficient has the highest statistical
significance?
c. How can a correlation of
r
=.53 (from the combined group) be more statistically significant
(better
p
value) than a correlation of
r
=.59 (from the Asian countries)?
Chapter 9
PREDICTION AND REGRESSION
Fill in the blanks:
9.1. In
simple
regression, there is/are _____ predictor(s).
9.2. The regression line is also called
a line
__________.
9.3. The slope of the regression line is represented by the
letter ___.
9.4. When the regression equation is used to draw a line, the
point where that line intersects the vertical line (the
Y-
axis) is represented by the letter ___ which indicates the
intercept
.
9.5. When the correlation between two variables is
perfect
and
positive
, and we use one of these variables to predict the other one, the
standard error of estimate
(
S
E
) is _____.
9.6. The difference between an actual
Y
score and its corresponding predicted
Y
score (
Y’
) is called the _____ score.
9.7. In
multiple
regression with
two
predictors, there is/are _____ intercept(s), represented in the
equation by the letter
a.
Circle the
correct
answer:
9.8. In regression, the
predictor
is called the
independent/dependent
variable, and the
predicted
variable (or the
criterion
variable) is called the
independent/dependent
.
9.9. The
predicted
variable is represented by the letter
X/Y
and the
predictor
is represented by the letter
X/Y
.
9.10. In the regression equation, the letter
b
represents the
constant/coefficient
and the letter
a
represents the
constant/coefficient
.
9.11. The dependent variable can be predicted more
accurately as the correlation between the independent and
dependent variables
increases/decreases
.
9.12. As the correlation between the predictor and the
criterion variable
increases
, the standard error of estimate (
S
E
)
increases/decreases
.
9.13. The predicted
Y
scores are expected to be
on/around
the regression line.
9.14. The criterion is predicted more accurately when
S
E
is
larger/smaller
.
Answer/compute the following questions:
9.15. Study the following graph. If a company is able to
maintain a 25% gross margin (the predictor
X
), what is the company’s predicted Return on Investment (ROI)
(the criterion
Y
)?
9.16. Compute
S
E
(the standard error of estimate) when the standard deviation of
the
Y-
variable is 5 (
SD
Y
=5) and the correlation is 0.00 (
r
=0.00). Use the following equation to compute the
S
E
:
What is the relationship between the
S
E
(the standard error of estimate) and the
SD
of the dependent variable
Y
(
SD
Y
=5) when the correlation is zero (
r
=.00)? Explain.
9.17. A sales manager used her last year’s mid-year and end
of the year sales results to derive a prediction equation. This
year her sales force has the same 6 salespeople as last year and
the market conditions are very similar to last year. In the
middle of this year the manager wants to predict the year-end
sales results for each of her 6 salespeople. Following are the
mid-year sales results of the 6 salespeople, and the prediction
equation.
a. Calculate the salespeople’s' predicted end of the year
sales results (
Y’
scores). (
Note
: Use the prediction equation to compute the students’
Y’
scores.)
Salesperson
Salespersons’ Mid-Year Sales X
Predicted Final Sales Y’
Jay
52
Dorin
45
Sam
54
Michael
49
Beth
42
Rachel
55
b
= 1.5
a
= 13.2
9.18.
Study the following graph, and determine what is the value of
the slope of the regression line (i.e.,
b
). Explain your answer.
9.19.
Draw a regression line in the following graph, when the
intercept is 10 (
a
=10), the mean of the
X-
variable is 20 (
=20), and the mean of the
Y-
variable is 30 (
=30).
9.20. Figure A shows three predictors,
X
1
,
X
2
, and
X
3
, and their correlations with the criterion variable
Y
1
. Figure B shows three predictors,
Z
1
,
Z
2
, and
Z
3
, and their correlations with a criterion variable
Y
2
.
a. Which predictor variables, those depicted in
Figure A or those depicted in Figures B, correlate higher
with each other
?
b. Which set of three predictors, those shown in
Figure A (
X
1
,
X
2
, and
X
3
) or those shown in Figure B (
Z
1
,
Z
2
, and
Z
3
) is likely to predict the criterion variables (
Y
1
or
Y
2
) more accurately?
Figure A
Figure B

Mais conteúdo relacionado

Semelhante a Fill in the blanks8.1.      The magnitude of the correlation .docx

Correlation and regression
Correlation and regressionCorrelation and regression
Correlation and regressionOmi Shah
 
Exercise 29Calculating Simple Linear RegressionSimple linear reg.docx
Exercise 29Calculating Simple Linear RegressionSimple linear reg.docxExercise 29Calculating Simple Linear RegressionSimple linear reg.docx
Exercise 29Calculating Simple Linear RegressionSimple linear reg.docxAlleneMcclendon878
 
Statistics with Computer Applications
Statistics with Computer ApplicationsStatistics with Computer Applications
Statistics with Computer ApplicationsDrMateoMacalaguingJr
 
161783709 chapter-04-answers
161783709 chapter-04-answers161783709 chapter-04-answers
161783709 chapter-04-answersBookStoreLib
 
161783709 chapter-04-answers
161783709 chapter-04-answers161783709 chapter-04-answers
161783709 chapter-04-answersFiras Husseini
 
marketing research & applications on SPSS
marketing research & applications on SPSSmarketing research & applications on SPSS
marketing research & applications on SPSSANSHU TIWARI
 
Chapter III.pptx
Chapter III.pptxChapter III.pptx
Chapter III.pptxBeamlak5
 
ECO 578 Final Exam There are 4 parts
ECO 578 Final Exam There are 4 partsECO 578 Final Exam There are 4 parts
ECO 578 Final Exam There are 4 partsAlexHunetr
 
Page 1 of 18Part A Multiple Choice (1–11)______1. Using.docx
Page 1 of 18Part A Multiple Choice (1–11)______1. Using.docxPage 1 of 18Part A Multiple Choice (1–11)______1. Using.docx
Page 1 of 18Part A Multiple Choice (1–11)______1. Using.docxalfred4lewis58146
 
Applications of regression analysis - Measurement of validity of relationship
Applications of regression analysis - Measurement of validity of relationshipApplications of regression analysis - Measurement of validity of relationship
Applications of regression analysis - Measurement of validity of relationshipRithish Kumar
 
linear_regression_notes.pdf
linear_regression_notes.pdflinear_regression_notes.pdf
linear_regression_notes.pdfTamilarasiP13
 
Covariance and correlation
Covariance and correlationCovariance and correlation
Covariance and correlationRashid Hussain
 

Semelhante a Fill in the blanks8.1.      The magnitude of the correlation .docx (20)

Demand Estimation
Demand EstimationDemand Estimation
Demand Estimation
 
Correlation and regression
Correlation and regressionCorrelation and regression
Correlation and regression
 
Rsh qam11 ch04 ge
Rsh qam11 ch04 geRsh qam11 ch04 ge
Rsh qam11 ch04 ge
 
Exercise 29Calculating Simple Linear RegressionSimple linear reg.docx
Exercise 29Calculating Simple Linear RegressionSimple linear reg.docxExercise 29Calculating Simple Linear RegressionSimple linear reg.docx
Exercise 29Calculating Simple Linear RegressionSimple linear reg.docx
 
SPSS
SPSSSPSS
SPSS
 
Statistics with Computer Applications
Statistics with Computer ApplicationsStatistics with Computer Applications
Statistics with Computer Applications
 
Chapter 12
Chapter 12Chapter 12
Chapter 12
 
Regression
RegressionRegression
Regression
 
Ch14 multiple regression
Ch14 multiple regressionCh14 multiple regression
Ch14 multiple regression
 
161783709 chapter-04-answers
161783709 chapter-04-answers161783709 chapter-04-answers
161783709 chapter-04-answers
 
161783709 chapter-04-answers
161783709 chapter-04-answers161783709 chapter-04-answers
161783709 chapter-04-answers
 
marketing research & applications on SPSS
marketing research & applications on SPSSmarketing research & applications on SPSS
marketing research & applications on SPSS
 
Chapter III.pptx
Chapter III.pptxChapter III.pptx
Chapter III.pptx
 
ECO 578 Final Exam There are 4 parts
ECO 578 Final Exam There are 4 partsECO 578 Final Exam There are 4 parts
ECO 578 Final Exam There are 4 parts
 
Page 1 of 18Part A Multiple Choice (1–11)______1. Using.docx
Page 1 of 18Part A Multiple Choice (1–11)______1. Using.docxPage 1 of 18Part A Multiple Choice (1–11)______1. Using.docx
Page 1 of 18Part A Multiple Choice (1–11)______1. Using.docx
 
Applications of regression analysis - Measurement of validity of relationship
Applications of regression analysis - Measurement of validity of relationshipApplications of regression analysis - Measurement of validity of relationship
Applications of regression analysis - Measurement of validity of relationship
 
linear_regression_notes.pdf
linear_regression_notes.pdflinear_regression_notes.pdf
linear_regression_notes.pdf
 
IPPTCh013.pptx
IPPTCh013.pptxIPPTCh013.pptx
IPPTCh013.pptx
 
Covariance and correlation
Covariance and correlationCovariance and correlation
Covariance and correlation
 
Measure of Association
Measure of AssociationMeasure of Association
Measure of Association
 

Mais de mglenn3

Feedback Assignment Set 4Great job on this assignment. I know yo.docx
Feedback Assignment Set 4Great job on this assignment. I know yo.docxFeedback Assignment Set 4Great job on this assignment. I know yo.docx
Feedback Assignment Set 4Great job on this assignment. I know yo.docxmglenn3
 
Feedback Financial Research Report Part 1Thank you for redoing a.docx
Feedback Financial Research Report Part 1Thank you for redoing a.docxFeedback Financial Research Report Part 1Thank you for redoing a.docx
Feedback Financial Research Report Part 1Thank you for redoing a.docxmglenn3
 
Feedback analysis, limitations of project approach, and conclusions .docx
Feedback analysis, limitations of project approach, and conclusions .docxFeedback analysis, limitations of project approach, and conclusions .docx
Feedback analysis, limitations of project approach, and conclusions .docxmglenn3
 
Federated Mutual InsuranceCompany121 East Park Square, O.docx
Federated Mutual InsuranceCompany121 East Park Square, O.docxFederated Mutual InsuranceCompany121 East Park Square, O.docx
Federated Mutual InsuranceCompany121 East Park Square, O.docxmglenn3
 
Federalist 51To the People of the State of New YorkHow shall .docx
Federalist 51To the People of the State of New YorkHow shall .docxFederalist 51To the People of the State of New YorkHow shall .docx
Federalist 51To the People of the State of New YorkHow shall .docxmglenn3
 
Federalism Comparing Government Response in Hurricane Katrina v.docx
Federalism Comparing Government Response in Hurricane Katrina v.docxFederalism Comparing Government Response in Hurricane Katrina v.docx
Federalism Comparing Government Response in Hurricane Katrina v.docxmglenn3
 
Federalism is the structure where two or more levels of government.docx
Federalism is the structure where two or more levels of government.docxFederalism is the structure where two or more levels of government.docx
Federalism is the structure where two or more levels of government.docxmglenn3
 
Federalism is the sharing of powers between the federal and state go.docx
Federalism is the sharing of powers between the federal and state go.docxFederalism is the sharing of powers between the federal and state go.docx
Federalism is the sharing of powers between the federal and state go.docxmglenn3
 
Federal judges do not have a mandatory retirement age, yet Arizona a.docx
Federal judges do not have a mandatory retirement age, yet Arizona a.docxFederal judges do not have a mandatory retirement age, yet Arizona a.docx
Federal judges do not have a mandatory retirement age, yet Arizona a.docxmglenn3
 
Federal Budget SpeechDo you want to know who you are Dont.docx
Federal Budget SpeechDo you want to know who you are Dont.docxFederal Budget SpeechDo you want to know who you are Dont.docx
Federal Budget SpeechDo you want to know who you are Dont.docxmglenn3
 
Federal Budget SpeechDo you want to know who you are Don.docx
Federal Budget SpeechDo you want to know who you are Don.docxFederal Budget SpeechDo you want to know who you are Don.docx
Federal Budget SpeechDo you want to know who you are Don.docxmglenn3
 
February is known as Black History Month. For 30 extra credit points.docx
February is known as Black History Month. For 30 extra credit points.docxFebruary is known as Black History Month. For 30 extra credit points.docx
February is known as Black History Month. For 30 extra credit points.docxmglenn3
 
FEATURE ARTICLE Creating and Capturing Value Through Susta.docx
FEATURE ARTICLE Creating and Capturing Value Through Susta.docxFEATURE ARTICLE Creating and Capturing Value Through Susta.docx
FEATURE ARTICLE Creating and Capturing Value Through Susta.docxmglenn3
 
FEATUREASSOCIATION FORUMHiring tiie Very BestHow to in.docx
FEATUREASSOCIATION FORUMHiring tiie Very BestHow to in.docxFEATUREASSOCIATION FORUMHiring tiie Very BestHow to in.docx
FEATUREASSOCIATION FORUMHiring tiie Very BestHow to in.docxmglenn3
 
FEATURED ESSAYThe Ecstatic Edge of Politics Sociology and.docx
FEATURED ESSAYThe Ecstatic Edge of Politics Sociology and.docxFEATURED ESSAYThe Ecstatic Edge of Politics Sociology and.docx
FEATURED ESSAYThe Ecstatic Edge of Politics Sociology and.docxmglenn3
 
Fears and Health Needs of Patients with Diabetes A Qualitative Re.docx
Fears and Health Needs of Patients with Diabetes A Qualitative Re.docxFears and Health Needs of Patients with Diabetes A Qualitative Re.docx
Fears and Health Needs of Patients with Diabetes A Qualitative Re.docxmglenn3
 
Featherfall has recently violated several government regulations.docx
Featherfall has recently violated several government regulations.docxFeatherfall has recently violated several government regulations.docx
Featherfall has recently violated several government regulations.docxmglenn3
 
Feasibility of International Trade Global Value Chain .docx
Feasibility of International Trade Global Value Chain     .docxFeasibility of International Trade Global Value Chain     .docx
Feasibility of International Trade Global Value Chain .docxmglenn3
 
FEATURE - ‘Overtourism’ Worries Europe. How Much Did Technol.docx
FEATURE - ‘Overtourism’ Worries Europe. How Much Did Technol.docxFEATURE - ‘Overtourism’ Worries Europe. How Much Did Technol.docx
FEATURE - ‘Overtourism’ Worries Europe. How Much Did Technol.docxmglenn3
 
FEASIBILITY REPORT1FEASIBILITY REPORT6Fe.docx
FEASIBILITY REPORT1FEASIBILITY REPORT6Fe.docxFEASIBILITY REPORT1FEASIBILITY REPORT6Fe.docx
FEASIBILITY REPORT1FEASIBILITY REPORT6Fe.docxmglenn3
 

Mais de mglenn3 (20)

Feedback Assignment Set 4Great job on this assignment. I know yo.docx
Feedback Assignment Set 4Great job on this assignment. I know yo.docxFeedback Assignment Set 4Great job on this assignment. I know yo.docx
Feedback Assignment Set 4Great job on this assignment. I know yo.docx
 
Feedback Financial Research Report Part 1Thank you for redoing a.docx
Feedback Financial Research Report Part 1Thank you for redoing a.docxFeedback Financial Research Report Part 1Thank you for redoing a.docx
Feedback Financial Research Report Part 1Thank you for redoing a.docx
 
Feedback analysis, limitations of project approach, and conclusions .docx
Feedback analysis, limitations of project approach, and conclusions .docxFeedback analysis, limitations of project approach, and conclusions .docx
Feedback analysis, limitations of project approach, and conclusions .docx
 
Federated Mutual InsuranceCompany121 East Park Square, O.docx
Federated Mutual InsuranceCompany121 East Park Square, O.docxFederated Mutual InsuranceCompany121 East Park Square, O.docx
Federated Mutual InsuranceCompany121 East Park Square, O.docx
 
Federalist 51To the People of the State of New YorkHow shall .docx
Federalist 51To the People of the State of New YorkHow shall .docxFederalist 51To the People of the State of New YorkHow shall .docx
Federalist 51To the People of the State of New YorkHow shall .docx
 
Federalism Comparing Government Response in Hurricane Katrina v.docx
Federalism Comparing Government Response in Hurricane Katrina v.docxFederalism Comparing Government Response in Hurricane Katrina v.docx
Federalism Comparing Government Response in Hurricane Katrina v.docx
 
Federalism is the structure where two or more levels of government.docx
Federalism is the structure where two or more levels of government.docxFederalism is the structure where two or more levels of government.docx
Federalism is the structure where two or more levels of government.docx
 
Federalism is the sharing of powers between the federal and state go.docx
Federalism is the sharing of powers between the federal and state go.docxFederalism is the sharing of powers between the federal and state go.docx
Federalism is the sharing of powers between the federal and state go.docx
 
Federal judges do not have a mandatory retirement age, yet Arizona a.docx
Federal judges do not have a mandatory retirement age, yet Arizona a.docxFederal judges do not have a mandatory retirement age, yet Arizona a.docx
Federal judges do not have a mandatory retirement age, yet Arizona a.docx
 
Federal Budget SpeechDo you want to know who you are Dont.docx
Federal Budget SpeechDo you want to know who you are Dont.docxFederal Budget SpeechDo you want to know who you are Dont.docx
Federal Budget SpeechDo you want to know who you are Dont.docx
 
Federal Budget SpeechDo you want to know who you are Don.docx
Federal Budget SpeechDo you want to know who you are Don.docxFederal Budget SpeechDo you want to know who you are Don.docx
Federal Budget SpeechDo you want to know who you are Don.docx
 
February is known as Black History Month. For 30 extra credit points.docx
February is known as Black History Month. For 30 extra credit points.docxFebruary is known as Black History Month. For 30 extra credit points.docx
February is known as Black History Month. For 30 extra credit points.docx
 
FEATURE ARTICLE Creating and Capturing Value Through Susta.docx
FEATURE ARTICLE Creating and Capturing Value Through Susta.docxFEATURE ARTICLE Creating and Capturing Value Through Susta.docx
FEATURE ARTICLE Creating and Capturing Value Through Susta.docx
 
FEATUREASSOCIATION FORUMHiring tiie Very BestHow to in.docx
FEATUREASSOCIATION FORUMHiring tiie Very BestHow to in.docxFEATUREASSOCIATION FORUMHiring tiie Very BestHow to in.docx
FEATUREASSOCIATION FORUMHiring tiie Very BestHow to in.docx
 
FEATURED ESSAYThe Ecstatic Edge of Politics Sociology and.docx
FEATURED ESSAYThe Ecstatic Edge of Politics Sociology and.docxFEATURED ESSAYThe Ecstatic Edge of Politics Sociology and.docx
FEATURED ESSAYThe Ecstatic Edge of Politics Sociology and.docx
 
Fears and Health Needs of Patients with Diabetes A Qualitative Re.docx
Fears and Health Needs of Patients with Diabetes A Qualitative Re.docxFears and Health Needs of Patients with Diabetes A Qualitative Re.docx
Fears and Health Needs of Patients with Diabetes A Qualitative Re.docx
 
Featherfall has recently violated several government regulations.docx
Featherfall has recently violated several government regulations.docxFeatherfall has recently violated several government regulations.docx
Featherfall has recently violated several government regulations.docx
 
Feasibility of International Trade Global Value Chain .docx
Feasibility of International Trade Global Value Chain     .docxFeasibility of International Trade Global Value Chain     .docx
Feasibility of International Trade Global Value Chain .docx
 
FEATURE - ‘Overtourism’ Worries Europe. How Much Did Technol.docx
FEATURE - ‘Overtourism’ Worries Europe. How Much Did Technol.docxFEATURE - ‘Overtourism’ Worries Europe. How Much Did Technol.docx
FEATURE - ‘Overtourism’ Worries Europe. How Much Did Technol.docx
 
FEASIBILITY REPORT1FEASIBILITY REPORT6Fe.docx
FEASIBILITY REPORT1FEASIBILITY REPORT6Fe.docxFEASIBILITY REPORT1FEASIBILITY REPORT6Fe.docx
FEASIBILITY REPORT1FEASIBILITY REPORT6Fe.docx
 

Último

HMCS Max Bernays Pre-Deployment Brief (May 2024).pptx
HMCS Max Bernays Pre-Deployment Brief (May 2024).pptxHMCS Max Bernays Pre-Deployment Brief (May 2024).pptx
HMCS Max Bernays Pre-Deployment Brief (May 2024).pptxEsquimalt MFRC
 
Accessible Digital Futures project (20/03/2024)
Accessible Digital Futures project (20/03/2024)Accessible Digital Futures project (20/03/2024)
Accessible Digital Futures project (20/03/2024)Jisc
 
Interdisciplinary_Insights_Data_Collection_Methods.pptx
Interdisciplinary_Insights_Data_Collection_Methods.pptxInterdisciplinary_Insights_Data_Collection_Methods.pptx
Interdisciplinary_Insights_Data_Collection_Methods.pptxPooja Bhuva
 
COMMUNICATING NEGATIVE NEWS - APPROACHES .pptx
COMMUNICATING NEGATIVE NEWS - APPROACHES .pptxCOMMUNICATING NEGATIVE NEWS - APPROACHES .pptx
COMMUNICATING NEGATIVE NEWS - APPROACHES .pptxannathomasp01
 
How to Manage Global Discount in Odoo 17 POS
How to Manage Global Discount in Odoo 17 POSHow to Manage Global Discount in Odoo 17 POS
How to Manage Global Discount in Odoo 17 POSCeline George
 
How to Add New Custom Addons Path in Odoo 17
How to Add New Custom Addons Path in Odoo 17How to Add New Custom Addons Path in Odoo 17
How to Add New Custom Addons Path in Odoo 17Celine George
 
Micro-Scholarship, What it is, How can it help me.pdf
Micro-Scholarship, What it is, How can it help me.pdfMicro-Scholarship, What it is, How can it help me.pdf
Micro-Scholarship, What it is, How can it help me.pdfPoh-Sun Goh
 
SOC 101 Demonstration of Learning Presentation
SOC 101 Demonstration of Learning PresentationSOC 101 Demonstration of Learning Presentation
SOC 101 Demonstration of Learning Presentationcamerronhm
 
Understanding Accommodations and Modifications
Understanding  Accommodations and ModificationsUnderstanding  Accommodations and Modifications
Understanding Accommodations and ModificationsMJDuyan
 
General Principles of Intellectual Property: Concepts of Intellectual Proper...
General Principles of Intellectual Property: Concepts of Intellectual  Proper...General Principles of Intellectual Property: Concepts of Intellectual  Proper...
General Principles of Intellectual Property: Concepts of Intellectual Proper...Poonam Aher Patil
 
Towards a code of practice for AI in AT.pptx
Towards a code of practice for AI in AT.pptxTowards a code of practice for AI in AT.pptx
Towards a code of practice for AI in AT.pptxJisc
 
Jamworks pilot and AI at Jisc (20/03/2024)
Jamworks pilot and AI at Jisc (20/03/2024)Jamworks pilot and AI at Jisc (20/03/2024)
Jamworks pilot and AI at Jisc (20/03/2024)Jisc
 
Python Notes for mca i year students osmania university.docx
Python Notes for mca i year students osmania university.docxPython Notes for mca i year students osmania university.docx
Python Notes for mca i year students osmania university.docxRamakrishna Reddy Bijjam
 
Sociology 101 Demonstration of Learning Exhibit
Sociology 101 Demonstration of Learning ExhibitSociology 101 Demonstration of Learning Exhibit
Sociology 101 Demonstration of Learning Exhibitjbellavia9
 
HMCS Vancouver Pre-Deployment Brief - May 2024 (Web Version).pptx
HMCS Vancouver Pre-Deployment Brief - May 2024 (Web Version).pptxHMCS Vancouver Pre-Deployment Brief - May 2024 (Web Version).pptx
HMCS Vancouver Pre-Deployment Brief - May 2024 (Web Version).pptxmarlenawright1
 
REMIFENTANIL: An Ultra short acting opioid.pptx
REMIFENTANIL: An Ultra short acting opioid.pptxREMIFENTANIL: An Ultra short acting opioid.pptx
REMIFENTANIL: An Ultra short acting opioid.pptxDr. Ravikiran H M Gowda
 
Unit 3 Emotional Intelligence and Spiritual Intelligence.pdf
Unit 3 Emotional Intelligence and Spiritual Intelligence.pdfUnit 3 Emotional Intelligence and Spiritual Intelligence.pdf
Unit 3 Emotional Intelligence and Spiritual Intelligence.pdfDr Vijay Vishwakarma
 
Exploring_the_Narrative_Style_of_Amitav_Ghoshs_Gun_Island.pptx
Exploring_the_Narrative_Style_of_Amitav_Ghoshs_Gun_Island.pptxExploring_the_Narrative_Style_of_Amitav_Ghoshs_Gun_Island.pptx
Exploring_the_Narrative_Style_of_Amitav_Ghoshs_Gun_Island.pptxPooja Bhuva
 
Fostering Friendships - Enhancing Social Bonds in the Classroom
Fostering Friendships - Enhancing Social Bonds  in the ClassroomFostering Friendships - Enhancing Social Bonds  in the Classroom
Fostering Friendships - Enhancing Social Bonds in the ClassroomPooky Knightsmith
 

Último (20)

HMCS Max Bernays Pre-Deployment Brief (May 2024).pptx
HMCS Max Bernays Pre-Deployment Brief (May 2024).pptxHMCS Max Bernays Pre-Deployment Brief (May 2024).pptx
HMCS Max Bernays Pre-Deployment Brief (May 2024).pptx
 
Accessible Digital Futures project (20/03/2024)
Accessible Digital Futures project (20/03/2024)Accessible Digital Futures project (20/03/2024)
Accessible Digital Futures project (20/03/2024)
 
Interdisciplinary_Insights_Data_Collection_Methods.pptx
Interdisciplinary_Insights_Data_Collection_Methods.pptxInterdisciplinary_Insights_Data_Collection_Methods.pptx
Interdisciplinary_Insights_Data_Collection_Methods.pptx
 
COMMUNICATING NEGATIVE NEWS - APPROACHES .pptx
COMMUNICATING NEGATIVE NEWS - APPROACHES .pptxCOMMUNICATING NEGATIVE NEWS - APPROACHES .pptx
COMMUNICATING NEGATIVE NEWS - APPROACHES .pptx
 
How to Manage Global Discount in Odoo 17 POS
How to Manage Global Discount in Odoo 17 POSHow to Manage Global Discount in Odoo 17 POS
How to Manage Global Discount in Odoo 17 POS
 
How to Add New Custom Addons Path in Odoo 17
How to Add New Custom Addons Path in Odoo 17How to Add New Custom Addons Path in Odoo 17
How to Add New Custom Addons Path in Odoo 17
 
Micro-Scholarship, What it is, How can it help me.pdf
Micro-Scholarship, What it is, How can it help me.pdfMicro-Scholarship, What it is, How can it help me.pdf
Micro-Scholarship, What it is, How can it help me.pdf
 
Mehran University Newsletter Vol-X, Issue-I, 2024
Mehran University Newsletter Vol-X, Issue-I, 2024Mehran University Newsletter Vol-X, Issue-I, 2024
Mehran University Newsletter Vol-X, Issue-I, 2024
 
SOC 101 Demonstration of Learning Presentation
SOC 101 Demonstration of Learning PresentationSOC 101 Demonstration of Learning Presentation
SOC 101 Demonstration of Learning Presentation
 
Understanding Accommodations and Modifications
Understanding  Accommodations and ModificationsUnderstanding  Accommodations and Modifications
Understanding Accommodations and Modifications
 
General Principles of Intellectual Property: Concepts of Intellectual Proper...
General Principles of Intellectual Property: Concepts of Intellectual  Proper...General Principles of Intellectual Property: Concepts of Intellectual  Proper...
General Principles of Intellectual Property: Concepts of Intellectual Proper...
 
Towards a code of practice for AI in AT.pptx
Towards a code of practice for AI in AT.pptxTowards a code of practice for AI in AT.pptx
Towards a code of practice for AI in AT.pptx
 
Jamworks pilot and AI at Jisc (20/03/2024)
Jamworks pilot and AI at Jisc (20/03/2024)Jamworks pilot and AI at Jisc (20/03/2024)
Jamworks pilot and AI at Jisc (20/03/2024)
 
Python Notes for mca i year students osmania university.docx
Python Notes for mca i year students osmania university.docxPython Notes for mca i year students osmania university.docx
Python Notes for mca i year students osmania university.docx
 
Sociology 101 Demonstration of Learning Exhibit
Sociology 101 Demonstration of Learning ExhibitSociology 101 Demonstration of Learning Exhibit
Sociology 101 Demonstration of Learning Exhibit
 
HMCS Vancouver Pre-Deployment Brief - May 2024 (Web Version).pptx
HMCS Vancouver Pre-Deployment Brief - May 2024 (Web Version).pptxHMCS Vancouver Pre-Deployment Brief - May 2024 (Web Version).pptx
HMCS Vancouver Pre-Deployment Brief - May 2024 (Web Version).pptx
 
REMIFENTANIL: An Ultra short acting opioid.pptx
REMIFENTANIL: An Ultra short acting opioid.pptxREMIFENTANIL: An Ultra short acting opioid.pptx
REMIFENTANIL: An Ultra short acting opioid.pptx
 
Unit 3 Emotional Intelligence and Spiritual Intelligence.pdf
Unit 3 Emotional Intelligence and Spiritual Intelligence.pdfUnit 3 Emotional Intelligence and Spiritual Intelligence.pdf
Unit 3 Emotional Intelligence and Spiritual Intelligence.pdf
 
Exploring_the_Narrative_Style_of_Amitav_Ghoshs_Gun_Island.pptx
Exploring_the_Narrative_Style_of_Amitav_Ghoshs_Gun_Island.pptxExploring_the_Narrative_Style_of_Amitav_Ghoshs_Gun_Island.pptx
Exploring_the_Narrative_Style_of_Amitav_Ghoshs_Gun_Island.pptx
 
Fostering Friendships - Enhancing Social Bonds in the Classroom
Fostering Friendships - Enhancing Social Bonds  in the ClassroomFostering Friendships - Enhancing Social Bonds  in the Classroom
Fostering Friendships - Enhancing Social Bonds in the Classroom
 

Fill in the blanks8.1.      The magnitude of the correlation .docx

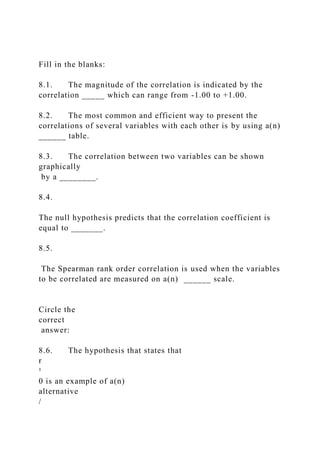
  • 1. Fill in the blanks: 8.1. The magnitude of the correlation is indicated by the correlation _____ which can range from -1.00 to +1.00. 8.2. The most common and efficient way to present the correlations of several variables with each other is by using a(n) ______ table. 8.3. The correlation between two variables can be shown graphically by a ________. 8.4. The null hypothesis predicts that the correlation coefficient is equal to _______. 8.5. The Spearman rank order correlation is used when the variables to be correlated are measured on a(n) ______ scale. Circle the correct answer: 8.6. The hypothesis that states that r ¹ 0 is an example of a(n) alternative /
  • 2. null hypothesis. 8.7. When an increase in one variable is associated with a decrease in the other variable, the correlation between these two variables is positive/negative . 8.8. In order to use the Pearson product-moment correlation, the variables to be correlated should be measured on an ordinal/interval scale. 8.9. When the points on a scattergram go from the bottom left to the top right they represent a positive/negative correlation. 8.10. The true correlation between two variables may be underestimated when the variance of one of the variables is very high/very low . 8.11. When the null hypothesis is rejected at p <.001, it means that the chance that r
  • 3. =0 is very small/very high . 8.12. The null hypothesis is rejected when the obtained correlation coefficient is higher/lower than the critical value. Answer/compute the following questions: 8.13 Which correlation coefficient ( a or b ) shows a stronger relationship between the two variables being correlated? a. X 1 &Y 1 : r = .85 b. X 2 &Y 2
  • 4. : r = -.94 8.14. Following are two scattergrams (in Figure A and in Figure B). Four different correlation coefficients are listed under each scattergram. Choose the coefficient that best matches each scattergram. Y Y · · · · · · · · · · ·
  • 7. A1. r = .50 B1. r = -.57 A2. r = .78 B2. r = .92 A3. r = -.10 B3. r = .38 A4. r = -.89 B4. r = -.91 8.15 Following is a scattergram showing the scores of 8 statistics students on two tests, X and Y . Each of the first 7 students is represented by a dot and their scores are listed in the table that follows. Use the scattergram to find the scores of student #8 on test X and test Y . The location of this student on the scattergram is represented by a large dot (•) next to number 8.
  • 8. Y 1 4 4 · · 5 2 3 · · 6 8 2 · · 7 3 1 · · X 1 2 3 4 5 Student # X Y
  • 9. 1 2 4 2 3 3 3 2 1 4 5 4 5 2 3 6 2 2 7 1 1 8 ? ? 8.16 What do these two scattergrams have in common? Y Y · · · ··
  • 14. ) the correlation between the advertising spending and sales that were obtained over a 5 year span. Indicate whether the correlation is positive or negative, and whether it is high or low. Explain your answer. Year Ad Spending Sales 1 $21,000 $83 2 15,000 70 3 17,000 68 4 25,000 90 5 19,000 74 8.18 Estimate ( do not calculate! ) which of the two sets of consumer research studies (A&B or X&Y) has a higher correlation. Explain your answer. Set 1 Set 2 Study # A
  • 15. B Study # X Y 1 41 50 1 66 47 2 41 47 2 53 36 3 38 43 3 50 45 4 30 39 4 48 38 5 28 37 5 45 39 8.19 Match the correlation coefficient and the diagram illustrating this correlation. a. r = .91 b. r = .28 c.
  • 16. r = .15 8.20. Study the following intercorrelation table. Two surveys measure consumer attitudes and two surveys measure marketers’ promotional spending . Knowing that Test 1 measures consumer attitudes, speculate which is the other consumer attitudes survey (2, 3, or 4) and which two surveys measure marketers’ promotional spending. ( A hint: the two consumer attitudes surveys should correlate higher with each other than with the two marketers’ promotional spending surveys, and the two marketers’ promotional spending surveys should correlate higher with each other than with the two consumer attitudes surveys. ) 2 3 4 1 .35 .89 .23
  • 17. 2 .39 .92 3 .34 8.21. Following are results from a study correlating gross domestic product (GDP) and the Consumer Price Index (CPI) from a group of 16 Asian countries, a group of 15 European countries, and the two groups combined. Group Correlation ( r )/ Group Size (
  • 18. n )/ Significance ( p value) Asia r =.59 n = 16 p =.02 Europe r =.52 n = 15 p =.05 Combined r =.53 n = 31 p =.01 a. Which correlation coefficient is the highest? b. Which correlation coefficient has the highest statistical
  • 19. significance? c. How can a correlation of r =.53 (from the combined group) be more statistically significant (better p value) than a correlation of r =.59 (from the Asian countries)? Chapter 9 PREDICTION AND REGRESSION Fill in the blanks: 9.1. In simple regression, there is/are _____ predictor(s). 9.2. The regression line is also called a line __________. 9.3. The slope of the regression line is represented by the
  • 20. letter ___. 9.4. When the regression equation is used to draw a line, the point where that line intersects the vertical line (the Y- axis) is represented by the letter ___ which indicates the intercept . 9.5. When the correlation between two variables is perfect and positive , and we use one of these variables to predict the other one, the standard error of estimate ( S E ) is _____. 9.6. The difference between an actual Y score and its corresponding predicted Y score ( Y’ ) is called the _____ score. 9.7. In multiple regression with two predictors, there is/are _____ intercept(s), represented in the equation by the letter a.
  • 21. Circle the correct answer: 9.8. In regression, the predictor is called the independent/dependent variable, and the predicted variable (or the criterion variable) is called the independent/dependent . 9.9. The predicted variable is represented by the letter X/Y and the predictor is represented by the letter X/Y . 9.10. In the regression equation, the letter b represents the constant/coefficient and the letter a represents the constant/coefficient .
  • 22. 9.11. The dependent variable can be predicted more accurately as the correlation between the independent and dependent variables increases/decreases . 9.12. As the correlation between the predictor and the criterion variable increases , the standard error of estimate ( S E ) increases/decreases . 9.13. The predicted Y scores are expected to be on/around the regression line. 9.14. The criterion is predicted more accurately when S E is larger/smaller . Answer/compute the following questions: 9.15. Study the following graph. If a company is able to maintain a 25% gross margin (the predictor X
  • 23. ), what is the company’s predicted Return on Investment (ROI) (the criterion Y )? 9.16. Compute S E (the standard error of estimate) when the standard deviation of the Y- variable is 5 ( SD Y =5) and the correlation is 0.00 ( r =0.00). Use the following equation to compute the S E : What is the relationship between the S E (the standard error of estimate) and the SD of the dependent variable Y ( SD Y =5) when the correlation is zero ( r
  • 24. =.00)? Explain. 9.17. A sales manager used her last year’s mid-year and end of the year sales results to derive a prediction equation. This year her sales force has the same 6 salespeople as last year and the market conditions are very similar to last year. In the middle of this year the manager wants to predict the year-end sales results for each of her 6 salespeople. Following are the mid-year sales results of the 6 salespeople, and the prediction equation. a. Calculate the salespeople’s' predicted end of the year sales results ( Y’ scores). ( Note : Use the prediction equation to compute the students’ Y’ scores.) Salesperson Salespersons’ Mid-Year Sales X Predicted Final Sales Y’ Jay 52 Dorin 45 Sam 54 Michael 49
  • 25. Beth 42 Rachel 55 b = 1.5 a = 13.2 9.18. Study the following graph, and determine what is the value of the slope of the regression line (i.e., b ). Explain your answer. 9.19. Draw a regression line in the following graph, when the intercept is 10 ( a =10), the mean of the X- variable is 20 ( =20), and the mean of the Y- variable is 30 ( =30).
  • 26. 9.20. Figure A shows three predictors, X 1 , X 2 , and X 3 , and their correlations with the criterion variable Y 1 . Figure B shows three predictors, Z 1 , Z 2 , and Z 3 , and their correlations with a criterion variable Y 2 . a. Which predictor variables, those depicted in Figure A or those depicted in Figures B, correlate higher with each other ? b. Which set of three predictors, those shown in Figure A (
  • 27. X 1 , X 2 , and X 3 ) or those shown in Figure B ( Z 1 , Z 2 , and Z 3 ) is likely to predict the criterion variables ( Y 1 or Y 2 ) more accurately? Figure A Figure B