
Recomendados
Mais conteúdo relacionado
Destaque
Semelhante a Q3 '05 venture backed IPOs & M&As
Semelhante a Q3 '05 venture backed IPOs & M&As (20)
Mais de mensa25
Mais de mensa25 (20)
Último
Último (20)
Q3 '05 venture backed IPOs & M&As
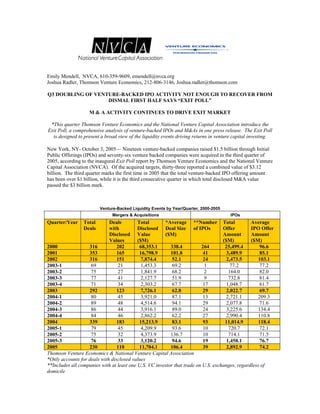
- 1. Emily Mendell, NVCA, 610-359-9609, emendell@nvca.org Joshua Radler, Thomson Venture Economics, 212-806-3146, Joshua.radler@thomson.com Q3 DOUBLING OF VENTURE-BACKED IPO ACTIVITY NOT ENOUGH TO RECOVER FROM DISMAL FIRST HALF SAYS “EXIT POLL” M & A ACTIVITY CONTINUES TO DRIVE EXIT MARKET *This quarter Thomson Venture Economics and the National Venture Capital Association introduce the Exit Poll, a comprehensive analysis of venture-backed IPOs and M&As in one press release. The Exit Poll is designed to present a broad view of the liquidity events driving returns in venture capital investing. New York, NY- October 3, 2005— Nineteen venture-backed companies raised $1.5 billion through Initial Public Offerings (IPOs) and seventy-six venture backed companies were acquired in the third quarter of 2005, according to the inaugural Exit Poll report by Thomson Venture Economics and the National Venture Capital Association (NVCA). Of the acquired targets, thirty-three reported a combined value of $3.12 billion. The third quarter marks the first time in 2005 that the total venture-backed IPO offering amount has been over $1 billion, while it is the third consecutive quarter in which total disclosed M&A value passed the $3 billion mark. Venture-Backed Liquidity Events by Year/Quarter, 2000-2005 Mergers & Acquisitions IPOs Quarter/Year Total Deals Total *Average **Number Total Average Deals with Disclosed Deal Size of IPOs Offer IPO Offer Disclosed Value ($M) Amount Amount Values ($M) ($M) ($M) 2000 316 202 68,353.1 338.4 264 25,499.4 96.6 2001 353 165 16,798.9 101.8 41 3,489.9 85.1 2002 316 151 7,874.4 52.1 24 2,473.5 103.1 69 21 1,453.3 69.2 1 77.2 77.2 2003-1 75 27 1,841.9 68.2 2 164.0 82.0 2003-2 77 41 2,127.7 51.9 9 732.8 81.4 2003-3 71 34 2,303.2 67.7 17 1,048.7 61.7 2003-4 2003 292 123 7,726.1 62.8 29 2,022.7 69.7 80 45 3,921.0 87.1 13 2,721.1 209.3 2004-1 89 48 4,514.6 94.1 29 2,077.8 71.6 2004-2 86 44 3,916.1 89.0 24 3,225.6 134.4 2004-3 84 46 2,862.2 62.2 27 2,990.4 110.8 2004-4 2004 339 183 15,213.9 83.1 93 11,014.9 118.4 79 45 4,209.9 93.6 10 720.7 72.1 2005-1 75 32 4,373.9 136.7 10 714.1 71.5 2005-2 2005-3 76 33 3,120.2 94.6 19 1,458.1 76.7 2005 230 110 11,704.1 106.4 39 2,892.9 74.2 Thomson Venture Economics & National Venture Capital Association *Only accounts for deals with disclosed values **Includes all companies with at least one U.S. VC investor that trade on U.S. exchanges, regardless of domicile
- 2. “The near doubling of IPO volume this quarter is welcome but frankly isn’t enough and we fully anticipate that 2005 will fall well short of 2004 in this area,” said Mark Heesen, President of the NVCA. “This quarter’s Exit Poll demonstrates a continued preference by venture-backed companies for the M&A market as the path to liquidity. Until the regulatory and market hurdles of going public are lowered, we expect to see lackluster IPO activity, which makes the ongoing stability and strong valuations in the M&A market that much more critical to venture returns.” IPO Activity Highlights The third quarter’s largest IPO was Focus Media’s $171.7 million offering. Focus Media was backed by 3i Group, Draper Fisher Jurvetson ePlanet, Goldman, Sachs & Co., United Capital Investment Group (UCI), and CDH FM. The second largest IPO of the quarter was Adams Respiratory Therapeutics’ $135.2 million offering. Adams Respiratory Therapeutics was backed by the Perseus-Soros Biopharmaceutical Fund, Tullis-Dickerson, Talon Equity Partners, Marquette Venture Partners, and Merrill Lynch Capital Partners. The company was the largest Life Sciences IPO of the quarter. Overall, seven Life Sciences companies raised a total of $451.0 million in the U.S public markets in Q3. The Technology sector led the quarter, with nine venture-backed IPOs raising a total $759.1 million. The largest Technology IPO, and third largest overall, was Heartland Payment Systems $121.5 million offering. Heartland Payment Systems was backed by LLR Partners and Greenhill Capital Partners. Q3 IPO Industry Breakdown *Number Total of Venture Venture Backed Backed Offering IPO's in Size Industry the U.S. ($M) Internet Specific 3 323.1 Semiconductors 3 259.3 Technology Computer Hardware 2 55.2 Computer Software 1 121.5 TOTAL 9 759.1 Biotechnology 4 227.1 Life Medical/Health 3 224.0 Sciences TOTAL 7 451.0 Non-high Technology 3 248.0 Other TOTAL 3 248.0 Thomson Venture Economics & National Venture Capital Association *Includes all companies with at least one U.S. VC investor that trade on U.S. exchanges, regardless of domicile In addition to the IPOs completed this quarter, there are currently 30 venture-backed companies “in registration” with the Securities and Exchange Commission. These companies have filed with the SEC in 2004 or 2005 and are now preparing for their initial public offerings. This figure is down from the 38 venture-backed companies that were in registration at the end of Q2 2005. For the rolling 12 month period ending September 30, 2005, 56% of the companies that went public are currently trading above their offering price.
- 3. Merger and Acquisition Highlights The third quarter M&A disclosed valuations represent a 28% decrease from last quarter’s $4.37 billion among thirty-two disclosed value deals, and a 20% decrease from the $3.92 billion disclosed in the third quarter of 2004. However, the third quarter average ($94.6 million) and median ($65 million) remained above the $89 million average and $35.2 million median of Q3 2004. A survey of M&A activity by industry sector shows that Software targets rebounded in the third quarter, with fifteen out of thirty-one reporting a combined value of $1.2 billion and an average deal size of $80.2 million. This is a marked improvement from the second quarter when ten targets disclosed a total of $510 million and an average of $51 million. Three Software companies made it into the top ten deals with a combined value of $678.5 million, slightly more than half of the sector’s entire total. These three targets were DeCru at $260 million; WildCard Systems with $228.5 million; and ArborText for $190 million. The largest deal of the quarter was the acquisition of Networking and Communications company Peribit Networks by Juniper Networks for $337 million in July. The second largest was Citrix Systems’ purchase of Internet infrastructure company NetScaler for $300 million. These were the only two deals at or above the $300 million mark. Regarding M&A activity, Daniel Benkert, Senior Analyst at Thomson Financial says, “The third quarter’s decline in average disclosed deal size from both the previous quarter and the third quarter of 2004 does not herald a souring of the market or an extended downturn. There are no broader economic factors indicating that this is anything other than the function of normal quarter-to-quarter fluctuations in what is an otherwise very healthy environment and year for M&A activity.” Analysis of Transaction Values versus Amount Invested Relationship between transaction 2004 2005 value and investment (Q1-Q3) (Q1-Q3) Deals where transaction value is less 45 30 than total venture investment Deals where transaction value is 1- 44 40 4x total venture investment Deals where transaction value is 4- 26 24 10x total venture investment Deals where transaction value is 19 13 greater than 10x venture investment Total Disclosed Deals 134* 107** Thomson Venture Economics & National Venture Capital Association * In 2004 (Q1-Q3), 137 deals had disclosed values, but three of these targets did not have a disclosed total investment amount. ** In 2005 (Q1-Q3), 110 deals had disclosed values, but three of these targets did not have a disclosed total investment amount. A ratio analysis of company acquisition price to the total venture investment shows an improvement in successful exits for the first three quarters of 2005 compared to the same time period in 2004. During the first three quarters of this year, 35% of the disclosed transactions returned more than 4X the original venture investment compared to 34% in 2004. A lower percentage of transactions lost money as well with 28% of disclosed acquisitions returning less than the original investment in 2005 vs. 33% in 2004.
- 4. Thomson Venture Economics, a Thomson Financial company, is the foremost information provider for equity professionals worldwide. Venture Economics offers an unparalleled range of products from directories to conferences, journals, newsletters, research reports, and the VentureXpert™ database. For over 40 years, Venture Economics has been tracking the venture capital and buyouts industry. Since 1961, it has been a recognized source for comprehensive analysis of investment activity and performance of the private equity industry. Venture Economics maintains a long-standing relationship within the private equity investment community, in-depth industry knowledge, and proprietary research techniques. Private equity managers and institutional investors alike consider Venture Economics information to be the industry standard. For more information about Venture Economics, please visit www.ventureeconomics.com. Thomson Financial Thomson Financial is a US$1.73 billion provider of information and technology solutions to the worldwide financial community. Through the widest range of products and services in the industry, Thomson Financial helps clients in more than 70 countries make better decisions, be more productive and achieve superior results. Thomson Financial is part of The Thomson Corporation (www.thomson.com), a global leader in providing integrated information solutions to more than 20 million business and professional customers in the fields of law, tax, accounting, financial services, higher education, reference information, corporate e-learning and assessment, scientific research and healthcare. With revenues of US$8.10 billion, The Thomson Corporation lists its common shares on the New York and Toronto stock exchanges (NYSE: TOC; TSX: TOC). The National Venture Capital Association (NVCA) represents approximately 460 venture capital and private equity firms. NVCA's mission is to foster greater understanding of the importance of venture capital to the U.S. economy, and support entrepreneurial activity and innovation. According to a 2004 Global Insight study, venture-backed companies accounted for 10.1 million jobs and $1.8 trillion in revenue in the United States in 2003. The NVCA represents the public policy interests of the venture capital community, strives to maintain high professional standards, provides reliable industry data, sponsors professional development, and facilitates interaction among its members. For more information about the NVCA, please visit www.nvca.org.