Retso worksheets dollinger presentation
•Transferir como XLSX, PDF•
0 gostou•241 visualizações

These are the worksheets discussed in my RETSO presentation from Atlanta 2011. These are free to use with your agents (or yourself) please share any thoughts, successes or changes you have made with me.

Recomendados
Mais conteúdo relacionado
Mais procurados
Mais procurados (19)
Semelhante a Retso worksheets dollinger presentation
Semelhante a Retso worksheets dollinger presentation (20)
Mais de Matt Dollinger
Mais de Matt Dollinger (6)
Último
Último (20)
Retso worksheets dollinger presentation
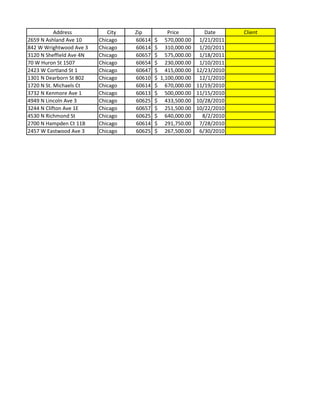
- 1. Address City Zip Price Date Client 2659 N Ashland Ave 10 Chicago 60614 $ 570,000.00 1/21/2011 842 W Wrightwood Ave 3 Chicago 60614 $ 310,000.00 1/20/2011 3120 N Sheffield Ave 4N Chicago 60657 $ 575,000.00 1/18/2011 70 W Huron St 1507 Chicago 60654 $ 230,000.00 1/10/2011 2423 W Cortland St 1 Chicago 60647 $ 415,000.00 12/23/2010 1301 N Dearborn St 802 Chicago 60610 $ 1,100,000.00 12/1/2010 1720 N St. Michaels Ct Chicago 60614 $ 670,000.00 11/19/2010 3732 N Kenmore Ave 1 Chicago 60613 $ 500,000.00 11/15/2010 4949 N Lincoln Ave 3 Chicago 60625 $ 433,500.00 10/28/2010 3244 N Clifton Ave 1E Chicago 60657 $ 251,500.00 10/22/2010 4530 N Richmond St Chicago 60625 $ 640,000.00 8/2/2010 2700 N Hampden Ct 11B Chicago 60614 $ 291,750.00 7/28/2010 2457 W Eastwood Ave 3 Chicago 60625 $ 267,500.00 6/30/2010
- 2. Source?
- 3. Year Volume Goal $ 10,000,000.00 <-- This is your projected goal for your next year in Real Estate. Your Commission Split 80% <-- This is the commission split that you have Your Estimated Earnings $ 200,000.00 <-- This is your projected income (Volume * 2.5%) x (Commission Split) Ave. Sales Price $350,000 <-- This is your projected average sales price for next year Transactions to hit Goal 29 <-- This is the number of transactions as the determined price point to hi Buyer Ratio (estimate) 70% <-- This is your estimated Buyer Ratio (based on past performance) Seller Ratio (estimate) 30% <-- This is your estimated Seller Ratio (based on past performance) Seller Closing Ratio 80% <-- This is your estimated closing ratio of listings you take Buyers Needed for Goal 20 <-- This is the total number of buyers needed to hit goal. Listings Needed for Goal 14 <-- This is the total number of sellers needed to hit goal (based on Seller C
- 4. ar in Real Estate. 5%) x (Commission Split) or next year etermined price point to hit your goal on past performance) n past performance) gs you take to hit goal. o hit goal (based on Seller Closing Ratio)
- 5. Name Age Occupation Rent/Own House Time Live Where Status Jim Jones 33 Law Own 1 bd 7 Buck Engaged Ozzie 28 Dr. Rent 3 G.Coast Single Janet 56 Cashier Own 4 bd/2 bth 14 Lakeview Married
- 6. Kids Ages Interests Tech Referral? Rank Why 0 Temple FB, Linked R+ a B/S/R 0 0 U of I Alum LinkedIn, Blogs R a B 2 22, 25 Quilting None R- b B/S
- 7. Year Volume Goal <-- This is your projected goal for your next year in Real Estate. % Dedicated to Marketing <-- 10% is usually recommended of your total income for marketing each year. Your Commission Split <-- This is the commission split that you have with @properties Your Estimated Earnings $ - <-- This is your projected income (Volume * 2.5%) x (Commission Split) Investment in Marketing/Yr $ - <-- This is the annual dollar amount by taking (X)% of your total income Marketing Budget/Mo. $ - <-- This is the monthly dollar amount by taking (X)% of your total income / 12 months Ave. Sales Price <-- This is your projected average sales price for next year Transactions to hit Goal #DIV/0! <-- This is the number of transactions as the determined price point to hit your goal Monthly Programs Cost/Mo. Start Qnty. Added/Mo. Mo. Commit. Monthly Invest. Increase/Mo Email $ - $ - $ - Database Mailing $ 0.74 $ - $ - CAP Program $ 25.00 $ - $ - Farm $ 0.74 $ - $ - Just Listed/Sold $ 0.74 $ - $ - Website Upkeep $ - $ - Other? $ - $ - Your @properties Program Totals MONTHLY $ - YEARLY Other Programs Cost Quantity #/Year Monthly Invest. Closing Gift 1 $ - Referral Gifts 1 $ - Holiday Card 1 $ - Chicago Magazine Subscpt. 1 $ - Client Outings 1 $ - CAP Party 1 $ - Total Mo/Investment: $ - Total Yr/Invesment: % to Monthly Budget: #DIV/0! % to Yearly Budget: Marketing $ Spent in 2007 2007 Gross Production Ratio $spent/$produced $ 2,000,000.00 $ -
- 8. Estimated '08 Marketing $ Ratio from 2007 Estimated '08 Production $ - #DIV/0!
- 9. ach year. t) e me / 12 months hit your goal Year Invest. $ - $ - $ - $ - $ - $ - $ - $ - Year Invest. $ - $ - $ - $ - $ - $ - $ - #DIV/0!