SlideShare uma empresa Scribd logo
1 de 8
Baixar para ler offline
Check the
Economic Forecast.
A“perfect storm”of factors—our economy’s need
for more college graduates, projected declines
in the number of high school graduates, and the
cumulative impact of historic underfunding of
public higher education—threatens our ability to
attract and retain knowledge-based industries that
drive economic prosperity.
MEMOto
Massachusetts:
DEGREES OF URGENCY  2014 Vision Project Annual Report4
It’s time to heed the forecast and do what
we can to grow the Commonwealth’s
single best asset in the global competition
for jobs, investment and talent: our
pool of high-skilled college graduates.
Degrees of Urgency documents the
potential impact of a newly projected
shortfall of college graduates fueled
by the three factors identified at left.
This report also details our plan to ramp
up college completion numbers by 2025
in order to meet the Commonwealth’s
workforce needs and the Vision Project
goal of producing “the best-educated
citizenry and workforce in the nation.”
It's a tall order, but one
that we must fill—with
economic consequences
for Massachusetts if we do not. 

5Memo to Massachusetts
RisingNeedfor
College-EducatedWorkers
Throughout his two terms in office, Governor Deval
Patrick has focused relentlessly on the growing impor-
tance of the state’s public higher education system in
meeting the “skills gap.” With capital investments at
every campus, budget increases that bucked national
trends, and repeated reminders of the talent demands of
our innovation sectors, he has raised expectations for a
public system that now educates 70 percent of residents
who remain in Massachusetts to attend college1
.
Business leaders are also looking to public colleges
and universities to fill the talent pipeline—and are
making no secret of the challenges they face in finding
high-skilled job applicants. In a 2013 survey by the
Massachusetts Business Alliance for Education, 69
percent of business leaders in the state said they found
it difficult to find people with the right skills for the
positions they need to fill. Meanwhile, other leading
technology states—New York, Pennsylvania, Ohio,
Illinois, Minnesota, and in some industry sectors, Texas
and California—outperform Massachusetts when it
comes to producing enough high-skilled graduates to
fill jobs2
.
In Massachusetts today there are an estimated six job
openings for every college graduate holding an
associate’s degree or certificate in computer science
or IT—and over 17 such openings for every graduate
While Massachusetts public higher education
enrollments have recently been at historic highs,
enrollment declines are expected to spread across
the system in the next few years. Producing
more graduates with degrees and competencies
needed for high-demand jobs in knowledge-based
industries will require public campuses to:
„„ Intensify and focus efforts to support a
rapidly changing population of students who
face significant barriers to success.
„„ Mount aggressive recruitment strategies to
enroll more students from underserved groups
and communities within our state’s population.
„„ Provide a top-quality education while
working collaboratively to reduce costs and
maximize operational efficiencies.
And will require the state’s political leaders to:
„„ Sustain and grow investments in public
higher education so that public campuses
have sufficient resources to help students
succeed and meet industry demand for
high-skilled talent.
„„ Significantly expand state financial aid
programs so that an affordable college
education is within reach of every citizen
willing to work toward a post-secondary
degree or certificate.
Memo to Massachusetts:
We are on the case.
P.S. @MassDHE and the campuses
are using social media to send a
“Memo to Massachusetts.” Please join
the conversation on Twitter and
other social networks with #Memo2MA.
#Memo2MA
In Brief 
 from page 5
5:1Current ratio of Massachusetts
health care job openings
to recent graduates holding
related associate’s and
bachelor’s degrees2
DEGREES OF URGENCY  2014 Vision Project Annual Report6
Current ratio of Massachusetts
information technology &
computer science job openings
to recent graduates holding
related bachelor’s degrees2
Percentage of
Massachusetts jobs
that will require some
college education by 20204
with a bachelor’s degree2
. Put another way: Massachu-
setts needs more than 5,000 computer science and
information technology graduates right now.
“A major roadblock to expansion of the high-tech sector
in Massachusetts is the talent shortage,” says Tom Hop-
croft, member of the Massachusetts Board of Higher
Education and president & CEO of the Massachusetts
Technology Leadership Council. “We have the jobs to
fill, but not the people to fill them. We need to align our
public higher education curriculum with the needs of
the innovation economy by fostering more graduates in
the computing and information technology fields.”
PublicHigherEd’s
HeightenedImportance
In every major business and industry sector that drives
economic growth, Massachusetts will need to expand
our talent pipeline or risk losing our competitive edge.
But the dominant role that Massachusetts public
colleges and universities will play in educating the
Commonwealth’s future entrepreneurs, IT managers,
medical researchers and preschool teachers is not
yet fully understood. With many private college and
university graduates leaving Massachusetts to make
their lives elsewhere, nine of every ten public college
and university students remain in state, working or
furthering their studies, one year after graduation3
. 
Current ratio of Massachusetts
information technology &
computer science job openings
to recent graduates holding related
associate’s degrees and certificates2
6:1
17:1
72%
Seepage31formoredatafromourlabormarket
analysismadepossiblebyHelpWantedOnline,a
real-timelabormarketinformationtool.
If we hope to reap the economic
dividends that come from
being an educational leader,
Massachusetts must make
academic excellence for its
public colleges and universities
an even
higher
priority
than it is right now.”
—Charles F. Desmond, Chairman,
Massachusetts Board of Higher Education
7Memo to Massachusetts
70%
They deserve—and Massachusetts needs them to have—
an education that is not just affordable but also
truly outstanding.
“If we hope to reap the economic dividends that come
from being an educational leader,” says Charles F.
Desmond, chair of the Massachusetts Board of Higher
Education, “Massachusetts must make academic
excellence for its public colleges and universities an
even higher priority than it is right now.”
Through the Vision Project, the Commonwealth’s public
campuses have been engaged in a multi-year, multi-
pronged effort to improve performance with the goal
of becoming a national leader among state systems
of higher education. Our work to reach the ranks of
the nation’s Top 10 systems—and our no-holds-barred
reporting of data on how much progress still needs
to be made to reach that goal—were included in the first
two Vision Project annual reports.
These reports—as well as this year’s analysis—highlight
progress but also make clear that, when it comes to
graduation rates, Massachusetts’ system of public higher
education remains at or slightly above average in com-
parison with other state systems. Recent demographic
and workforce analyses reviewed or conducted by the
Department of Higher Education (DHE) show that
the system is currently not on track to produce enough
degree-holders to fill jobs in technology, health care,
and other high-demand fields within the next decade.
Based on current degree production rates and future
enrollment projections, we believe that, by 2025,
Massachusetts’public higher education system will
fall short of meeting the state’s need for new
associate’s and bachelor’s degrees by a minimum of
55,000 to 65,0008
. Without a course correction, those
missing degrees will translate into thousands of lost
opportunities, as employers struggle to find talent for
high-skilled, good-paying jobs and students attempting
to compete for jobs in the best-paying and most rapidly
growing sectors of the economy discover that they lack
the credentials to compete.
Helping tens of thousands of additional college students
reach graduation day with diplomas and certificates in
hand won’t be easy and might even be dismissed as an
impossible task. The challenge we have set for ourselves—
as academic policy experts and labor economists can
attest—is HUGE. To reach our goals within the next
decade, Massachusetts public colleges and universities
will need to graduate more students who have greater
academic and economic challenges, and must do so in
less time and with more efficient use of state dollars
than ever before.
30%
52%
 from page 7
Mass. public higher ed
share of all Mass.
undergrads in 19675
Mass. public higher ed
share of Mass. high
school graduates
enrolled in Mass. colleges
as first-time, degree-
seeking students in 20131
Mass. public higher ed
share of all Mass.
undergrads in 20136
WestfieldStatestudents,1967.Photocourtesy
ofWestfieldStateUniversityLibrary.
MassasoitCommunityCollegestudents,2014.
PhotocourtesyofJamesLynch/Massasoit.
DEGREES OF URGENCY  2014 Vision Project Annual Report8
Understandingthe
DegreeShortfall
Within six years, Massachusetts will see its total pool
of high school graduates shrink by 9 percent7
. This
represents a big turnaround from the previous decade.
Between 1996–97 and 2007–08, the state saw a 31
percent increase in high school graduates7
; college
application numbers soared, and admissions standards
tightened. Although enrollments at a number of
campuses remain robust, this fall overall enrollment
for the entire system declined slightly for the first
time in a decade. This trend is forecasted to continue,
accelerate and spread across the system, which will
compromise efforts to produce enough graduates to
fill jobs in the Commonwealth’s flagship industries,
including technology and health care.
Further, by 2020, the number of White high school grad-
uates (whose overall college participation and comple-
tion rates are significantly higher than those for students
of color) will decline by 15 percent7
. While the ranks of
Asian/Pacific-Islander and Latino/a students continue
to grow, their numbers aren’t increasing fast enough to
offset this decline.
Getting more students into college and through to
graduation—particularly African-American and Latino/a
students—isn’t just a matter of social justice. It’s also
an economic imperative for the state. Consider this: If
African-American and Latino/a adults possessed
college degrees at the same rate as White adults (60%),
the state would easily meet its need for more college
graduates by 20259
. 
+31%
–9%
55–
65K
A major roadblock to expansion
of the high-tech sector in
Massachusetts is the
talent
shortage.
We have the jobs to fill, but
not the people to fill them.”
—Tom Hopcroft, President & CEO,
Massachusetts Technology Leadership Council,
and Member, Massachusetts Board of
Higher Education
Projected drop in
Massachusetts high school
students graduating
annually between
2009 and 20207
Increase in Massachusetts
high school students
graduating annually
between 1997 and 20087
Projected shortfall of
associate’s and bachelor’s
degrees to be awarded by
Massachusetts public
colleges and universities
2015–2025, compared
with projected need8
Consider this: If African-American
and Latino/a adults possessed college
degrees at the same rate as White adults
(60%), Massachusetts would easily meet its
need for more college graduates by 20259
.
9Memo to Massachusetts
TheImpactof
HistoricUnderfunding
For the past two years under the leadership of Governor
Patrick, Massachusetts has been among the vanguard
of states that have bucked national trends and increased
funding for public colleges and universities.
The Governor was a strong proponent of strategic
investments in the state’s higher education system,
advocating for substantial increases in appropriations
in FY14 and FY15. But the relatively good budgets
still leave Massachusetts trailing other states in
appropriation per full-time enrolled student (FTE).
From FY08 to FY14, during the recession and
recovery, Massachusetts cut funding for its public
higher education system at twice the rate of the
ten best-funded state systems in the country10
.
The neediest students are hardest hit; their financial
struggles only lengthen the time it takes to complete
certificates and degrees. While the value of the state’s
MASSGrant financial aid program has dropped to less
than 10 percent of the average cost of attending a public
college or university, the average loan debt carried by
public college and university students has risen sharply,
up 27 percent in just the last three years11
. “Being
average with regard to overall system performance and
below average in state support per student and state
investment in financial aid is unacceptable in the
Commonwealth where the brainpower of our citizens
Massachusetts must build
one of the
Top 10 public
systems
in the nation with regard to both
overall performance and state
investments in order to provide an
affordable as well as high-quality
education for all students.”
—Higher Education Finance Commission
More information at
www.mass.edu/hefc
Alaska
North
Dakota
Wyoming
California
Nebraska
Texas
New
Mexico
Tennessee
NewYork
Mississippi
North
Carolina
Illinois
Connecticut
Hawaii
In FY2013
In FY2014
In both years
 from page 9
–14%Decline in Massachusetts’
appropriations for public higher
ed per FTE between FY2008 and
FY2014—double the top 10
states’ average decline10
Top 10 States in Public Higher Ed
Appropriations per FTE in FY2013 & 201410
DEGREES OF URGENCY  2014 Vision Project Annual Report10
$10.8K
$6.5K
is our primary economic resource,” members of a
Higher Education Finance Commission created by
the Legislature concluded recently.
“Massachusetts must build one of the top 10 public
systems in the country with regard to both overall
performance and state investments in order to provide
an affordable as well as high-quality education for all
students,” the Commission concluded in its final report
accepted by Governor Patrick, noting the cost shift from
state to student and the impact on college completion
rates as a result of “historic underinvestment.”
An aggressive effort to help more students earn degrees
and certificates costs money. Yet in most states,
the disconnect between the need to produce more
graduates and the additional state investment needed
to meet these attainment goals is striking. “While policy
makers at all levels are jumping on the (college degree)
attainment bandwagon, they are not attending to a
key corresponding issue: how the successful pursuit
of these goals is to be funded,” wrote Dennis Jones,
president of the non-profit National Center for Higher
Education Management Systems in a recent issue of
Change Magazine. “What combination of financial strate-
gies can be implemented to provide sufficient resources
to accommodate more (and harder-to-serve) students
while maintaining affordability for both families and
taxpayers? Failure to provide a credible response to this
question has the potential to derail the bandwagon.”
At the same time, Jones stated that public colleges and
universities must be willing to have funding tied
to the number of graduates they deliver, not just to
the number of students they enroll. (Massachusetts
community colleges are at present the only segment
of public higher education to embrace a performance-
based funding model. Read more about the formula’s
impact on page 24.)
Top 10 states’average
funding per FTE
in FY201410
Massachusetts’funding
per FTE in FY201410
“MEMO TO MASSACHUSETTS” SOURCES
1
U.S. Department of Education (IPEDS),
Fall 2012. Calculations by Massachusetts
Department of Higher Education (MDHE).
2
Wanted Analytics, May–July 2014;
U.S. Department of Education (IPEDS),
2010–2012 (three-year average).
Calculations by MDHE.
3
MDHE; Massachusetts Department of
Career Services; National Student
Clearinghouse. Calculations by MDHE.
4
Georgetown University: Center on
Education and the Workforce, Recovery:
Job Growth and Education Requirements
Through 2020, June 2013.
5
U.S. Department of Education (IPEDS/
HEGIS), Fall 1967.
6
U.S. Department of Education (IPEDS),
Fall 2013.
7
Western Interstate Commission for Higher
Education, Knocking at the College Door:
Projections of High School Graduates,
December 2012.
8
MDHE; University of Massachusetts
Donahue Institute Demographic Projections;
Georgetown University: Center on Education
and the Workforce, Recovery: Job Growth
and Education Requirements Through 2020,
June 2013; New England Economic
Partnership: Massachusetts Forecast.
Calculations by MDHE.
9
U.S. Census Bureau, American Community
Survey, 2010–2012. IPUMS-USA, University
of Minnesota, www.ipums.org.
10
Primary Data Source: State Higher Educa-
tion Executive Officers (SHEEO), State Higher
Education Finance (SHEF)—FY2013 (http://
www.sheeo.org/resources/publications/
shef-%E2%80%94-state-higher-education-
finance-fy13). Note: FY2014 figures on state
support for higher education represent
initial allocations and estimates reported by
states from September through December
2013 and are subject to change (see SHEF
FY2013 report for additional explanation).
FY2014 FTE is estimated for non-MA states
based on Current Term Enrollment Report
data from the National Student Clearing-
house and FY2013 FTE data reported in
the SHEF FY2013 report. Both FY2008 and
FY2013 total state support per FTE calcula-
tions include cost of living and enrollment
mix adjustments provided in the SHEF
FY2013 report.
11
MDHE.
11Memo to Massachusetts

Mais conteúdo relacionado

Mais procurados

The Undereducated American
The Undereducated AmericanThe Undereducated American
The Undereducated AmericanEcon Matters
 
Education in costa rican society
Education in costa rican societyEducation in costa rican society
Education in costa rican societytati2487
 
Education and Workforce Development in the Early 21st Century
Education and Workforce Development in the Early 21st CenturyEducation and Workforce Development in the Early 21st Century
Education and Workforce Development in the Early 21st Centuryheldrichcenter
 
The Red Balloon Project Re-Imagining Undergraduate Education
The Red Balloon Project Re-Imagining Undergraduate EducationThe Red Balloon Project Re-Imagining Undergraduate Education
The Red Balloon Project Re-Imagining Undergraduate Educationleadchangeagent
 
ConnectingTalentandOpportunity2010
ConnectingTalentandOpportunity2010ConnectingTalentandOpportunity2010
ConnectingTalentandOpportunity2010Phillip Jarvis
 
Higher education in Punjab [www.writekraft.com]
Higher education in Punjab [www.writekraft.com]Higher education in Punjab [www.writekraft.com]
Higher education in Punjab [www.writekraft.com]WriteKraft Dissertations
 
Social Mobility Evidence - Lords Select Committee
Social Mobility Evidence - Lords Select CommitteeSocial Mobility Evidence - Lords Select Committee
Social Mobility Evidence - Lords Select CommitteeKen Uché
 
Massachusetts STEM Talent Pool
Massachusetts STEM Talent PoolMassachusetts STEM Talent Pool
Massachusetts STEM Talent PoolMassEHealth
 
WBEA Presentation 2/16/2013
WBEA Presentation 2/16/2013WBEA Presentation 2/16/2013
WBEA Presentation 2/16/2013aaronbredenkamp
 
Strenghening Tertiary Educaiton Africa
Strenghening Tertiary Educaiton AfricaStrenghening Tertiary Educaiton Africa
Strenghening Tertiary Educaiton AfricaHimdat Bayusuf
 
Massachusetts Cyber Security Ecosystem
Massachusetts Cyber Security EcosystemMassachusetts Cyber Security Ecosystem
Massachusetts Cyber Security EcosystemBrett Campbell
 

Mais procurados (14)

The Undereducated American
The Undereducated AmericanThe Undereducated American
The Undereducated American
 
Education in costa rican society
Education in costa rican societyEducation in costa rican society
Education in costa rican society
 
Education and Workforce Development in the Early 21st Century
Education and Workforce Development in the Early 21st CenturyEducation and Workforce Development in the Early 21st Century
Education and Workforce Development in the Early 21st Century
 
The Red Balloon Project Re-Imagining Undergraduate Education
The Red Balloon Project Re-Imagining Undergraduate EducationThe Red Balloon Project Re-Imagining Undergraduate Education
The Red Balloon Project Re-Imagining Undergraduate Education
 
ConnectingTalentandOpportunity2010
ConnectingTalentandOpportunity2010ConnectingTalentandOpportunity2010
ConnectingTalentandOpportunity2010
 
Higher education in Punjab [www.writekraft.com]
Higher education in Punjab [www.writekraft.com]Higher education in Punjab [www.writekraft.com]
Higher education in Punjab [www.writekraft.com]
 
Sp ws1 richard braddock
Sp ws1 richard braddockSp ws1 richard braddock
Sp ws1 richard braddock
 
Social Mobility Evidence - Lords Select Committee
Social Mobility Evidence - Lords Select CommitteeSocial Mobility Evidence - Lords Select Committee
Social Mobility Evidence - Lords Select Committee
 
18-19
18-1918-19
18-19
 
Massachusetts STEM Talent Pool
Massachusetts STEM Talent PoolMassachusetts STEM Talent Pool
Massachusetts STEM Talent Pool
 
WBEA Presentation 2/16/2013
WBEA Presentation 2/16/2013WBEA Presentation 2/16/2013
WBEA Presentation 2/16/2013
 
Strenghening Tertiary Educaiton Africa
Strenghening Tertiary Educaiton AfricaStrenghening Tertiary Educaiton Africa
Strenghening Tertiary Educaiton Africa
 
2015ISMagazine
2015ISMagazine2015ISMagazine
2015ISMagazine
 
Massachusetts Cyber Security Ecosystem
Massachusetts Cyber Security EcosystemMassachusetts Cyber Security Ecosystem
Massachusetts Cyber Security Ecosystem
 

Destaque

What to Upload to SlideShare
What to Upload to SlideShareWhat to Upload to SlideShare
What to Upload to SlideShareSlideShare
 

Destaque (17)

Allied Health Workforce: Introduction to Industry Analysis
Allied Health Workforce: Introduction to Industry AnalysisAllied Health Workforce: Introduction to Industry Analysis
Allied Health Workforce: Introduction to Industry Analysis
 
UMass Lowell Vision Project Performance Incentive Fund Grant
UMass Lowell Vision Project Performance Incentive Fund GrantUMass Lowell Vision Project Performance Incentive Fund Grant
UMass Lowell Vision Project Performance Incentive Fund Grant
 
What Is the PARCC Assessment? How Will It Work, and Who Will Benefit?
What Is the PARCC Assessment? How Will It Work, and Who Will Benefit?What Is the PARCC Assessment? How Will It Work, and Who Will Benefit?
What Is the PARCC Assessment? How Will It Work, and Who Will Benefit?
 
The "Big Three" Completion Plan
The "Big Three" Completion PlanThe "Big Three" Completion Plan
The "Big Three" Completion Plan
 
Science Standards Alignment
Science Standards AlignmentScience Standards Alignment
Science Standards Alignment
 
Vision Project "Big Three" Conference Program
Vision Project "Big Three" Conference ProgramVision Project "Big Three" Conference Program
Vision Project "Big Three" Conference Program
 
How Can Higher Education Impact the Development and Implementation of the PAR...
How Can Higher Education Impact the Development and Implementation of the PAR...How Can Higher Education Impact the Development and Implementation of the PAR...
How Can Higher Education Impact the Development and Implementation of the PAR...
 
The Vision Project and the Pathway to PARCC
The Vision Project and the Pathway to PARCCThe Vision Project and the Pathway to PARCC
The Vision Project and the Pathway to PARCC
 
Bunker Hill Community College Vision Project Performance Incentive Fund Grant
Bunker Hill Community College Vision Project Performance Incentive Fund GrantBunker Hill Community College Vision Project Performance Incentive Fund Grant
Bunker Hill Community College Vision Project Performance Incentive Fund Grant
 
Building Naming Rights Policy
Building Naming Rights PolicyBuilding Naming Rights Policy
Building Naming Rights Policy
 
Transforming Developmental Education
Transforming Developmental EducationTransforming Developmental Education
Transforming Developmental Education
 
Early College Programming in Massachusetts
Early College Programming in MassachusettsEarly College Programming in Massachusetts
Early College Programming in Massachusetts
 
FY18 Budget Recommendation
FY18 Budget RecommendationFY18 Budget Recommendation
FY18 Budget Recommendation
 
Vision Project Preview: Research and Economic Activity
Vision Project Preview: Research and Economic ActivityVision Project Preview: Research and Economic Activity
Vision Project Preview: Research and Economic Activity
 
Highlights: 2016 Enrollment Estimates
Highlights: 2016 Enrollment EstimatesHighlights: 2016 Enrollment Estimates
Highlights: 2016 Enrollment Estimates
 
Nursing Strategic Plan Update and Transfer Block Discussion
Nursing Strategic Plan Update and Transfer Block Discussion Nursing Strategic Plan Update and Transfer Block Discussion
Nursing Strategic Plan Update and Transfer Block Discussion
 
What to Upload to SlideShare
What to Upload to SlideShareWhat to Upload to SlideShare
What to Upload to SlideShare
 

Semelhante a Memo to Massachusetts

Business Leaders’ Insights: How Higher Education Can Help Michigan Become a ...
Business Leaders’ Insights: How Higher Education Can Help  Michigan Become a ...Business Leaders’ Insights: How Higher Education Can Help  Michigan Become a ...
Business Leaders’ Insights: How Higher Education Can Help Michigan Become a ...Business Leaders for Michigan
 
MI STEM Partnership - 2016 Annual Report
MI STEM Partnership -  2016 Annual ReportMI STEM Partnership -  2016 Annual Report
MI STEM Partnership - 2016 Annual ReportSTEM-MI2017
 
Survey Results and Report- Hawaii State High School College Counselors
Survey Results and Report- Hawaii State High School College CounselorsSurvey Results and Report- Hawaii State High School College Counselors
Survey Results and Report- Hawaii State High School College CounselorsMichael Weddington
 
What the Research Says
What the Research SaysWhat the Research Says
What the Research Saysjacieames
 
Career and Tech Educaiton
Career and Tech EducaitonCareer and Tech Educaiton
Career and Tech EducaitonMicah Smith
 
TAWB-EducationBookletv6 2014
TAWB-EducationBookletv6 2014TAWB-EducationBookletv6 2014
TAWB-EducationBookletv6 2014Lori Berman
 
What the Research Says 2017
What the Research Says 2017What the Research Says 2017
What the Research Says 2017azcteleads
 
The Economic Case for Liberal Education
The Economic Case for Liberal EducationThe Economic Case for Liberal Education
The Economic Case for Liberal EducationRobert Kelly
 
California's Educational System: A Failing Grade?
California's Educational System: A Failing Grade?California's Educational System: A Failing Grade?
California's Educational System: A Failing Grade?Geneva Mae Lewis
 
texonomics_final_spreads
texonomics_final_spreadstexonomics_final_spreads
texonomics_final_spreadsKristi Shuey
 
The Equity Equation - White Paper
The Equity Equation - White PaperThe Equity Equation - White Paper
The Equity Equation - White Paperlalanyc212
 
Three Reasons to Attend College
Three Reasons to Attend CollegeThree Reasons to Attend College
Three Reasons to Attend CollegeVickie Sax
 
Innovative Strategies to Increase STEM achievement in Higher Education
Innovative Strategies to Increase STEM achievement in Higher EducationInnovative Strategies to Increase STEM achievement in Higher Education
Innovative Strategies to Increase STEM achievement in Higher EducationThe McGraw-Hill Research Foundation
 
Research Update - November 2016
Research Update - November 2016Research Update - November 2016
Research Update - November 2016azcteleads
 
Economic development deck nov summit 2012
Economic development deck nov summit 2012Economic development deck nov summit 2012
Economic development deck nov summit 2012AllianceBL
 
Literacy Technology Community_The Importance of Smart Technology in Workforce...
Literacy Technology Community_The Importance of Smart Technology in Workforce...Literacy Technology Community_The Importance of Smart Technology in Workforce...
Literacy Technology Community_The Importance of Smart Technology in Workforce...Jan Stephens PhD
 

Semelhante a Memo to Massachusetts (20)

Business Leaders’ Insights: How Higher Education Can Help Michigan Become a ...
Business Leaders’ Insights: How Higher Education Can Help  Michigan Become a ...Business Leaders’ Insights: How Higher Education Can Help  Michigan Become a ...
Business Leaders’ Insights: How Higher Education Can Help Michigan Become a ...
 
MI STEM Partnership - 2016 Annual Report
MI STEM Partnership -  2016 Annual ReportMI STEM Partnership -  2016 Annual Report
MI STEM Partnership - 2016 Annual Report
 
Survey Results and Report- Hawaii State High School College Counselors
Survey Results and Report- Hawaii State High School College CounselorsSurvey Results and Report- Hawaii State High School College Counselors
Survey Results and Report- Hawaii State High School College Counselors
 
What the Research Says
What the Research SaysWhat the Research Says
What the Research Says
 
Career and Tech Educaiton
Career and Tech EducaitonCareer and Tech Educaiton
Career and Tech Educaiton
 
TAWB-EducationBookletv6 2014
TAWB-EducationBookletv6 2014TAWB-EducationBookletv6 2014
TAWB-EducationBookletv6 2014
 
What the Research Says 2017
What the Research Says 2017What the Research Says 2017
What the Research Says 2017
 
The Economic Case for Liberal Education
The Economic Case for Liberal EducationThe Economic Case for Liberal Education
The Economic Case for Liberal Education
 
127 Final
127 Final127 Final
127 Final
 
California's Educational System: A Failing Grade?
California's Educational System: A Failing Grade?California's Educational System: A Failing Grade?
California's Educational System: A Failing Grade?
 
texonomics_final_spreads
texonomics_final_spreadstexonomics_final_spreads
texonomics_final_spreads
 
The Equity Equation - White Paper
The Equity Equation - White PaperThe Equity Equation - White Paper
The Equity Equation - White Paper
 
Three Reasons to Attend College
Three Reasons to Attend CollegeThree Reasons to Attend College
Three Reasons to Attend College
 
Innovative Strategies to Increase STEM achievement in Higher Education
Innovative Strategies to Increase STEM achievement in Higher EducationInnovative Strategies to Increase STEM achievement in Higher Education
Innovative Strategies to Increase STEM achievement in Higher Education
 
Vision Project Preview: Workforce Alignment
Vision Project Preview: Workforce AlignmentVision Project Preview: Workforce Alignment
Vision Project Preview: Workforce Alignment
 
Research Update - November 2016
Research Update - November 2016Research Update - November 2016
Research Update - November 2016
 
Economic development deck nov summit 2012
Economic development deck nov summit 2012Economic development deck nov summit 2012
Economic development deck nov summit 2012
 
Dennis Pruitt, CBMI 2016 - Enrollment Management
Dennis Pruitt, CBMI 2016 - Enrollment ManagementDennis Pruitt, CBMI 2016 - Enrollment Management
Dennis Pruitt, CBMI 2016 - Enrollment Management
 
Literacy Technology Community_The Importance of Smart Technology in Workforce...
Literacy Technology Community_The Importance of Smart Technology in Workforce...Literacy Technology Community_The Importance of Smart Technology in Workforce...
Literacy Technology Community_The Importance of Smart Technology in Workforce...
 
Index of the Massachusetts Innovation Economy 2013: Full Report
Index of the Massachusetts Innovation Economy 2013: Full Report Index of the Massachusetts Innovation Economy 2013: Full Report
Index of the Massachusetts Innovation Economy 2013: Full Report
 

Mais de Massachusetts Department of Higher Education

Mais de Massachusetts Department of Higher Education (20)

FY19 Budget Recommendation
FY19 Budget RecommendationFY19 Budget Recommendation
FY19 Budget Recommendation
 
Massachusetts Early College Designation
Massachusetts Early College DesignationMassachusetts Early College Designation
Massachusetts Early College Designation
 
Commissioner's Year-End Report
Commissioner's Year-End ReportCommissioner's Year-End Report
Commissioner's Year-End Report
 
Massachusetts Early College Initiative Launch
Massachusetts Early College Initiative LaunchMassachusetts Early College Initiative Launch
Massachusetts Early College Initiative Launch
 
Revised Program Approval for Public Institutions and Timeline
Revised Program Approval for Public Institutions and TimelineRevised Program Approval for Public Institutions and Timeline
Revised Program Approval for Public Institutions and Timeline
 
Student Learning Outcomes Assessment: An Update
Student Learning Outcomes Assessment: An UpdateStudent Learning Outcomes Assessment: An Update
Student Learning Outcomes Assessment: An Update
 
Assessing Food and Housing Insecurity on Campus
Assessing  Food and Housing Insecurity on CampusAssessing  Food and Housing Insecurity on Campus
Assessing Food and Housing Insecurity on Campus
 
Massachusetts Early College Initiative
Massachusetts Early College InitiativeMassachusetts Early College Initiative
Massachusetts Early College Initiative
 
Performance Measurement: Ensuring Accuracy, Transparency and Relevance
Performance Measurement: Ensuring Accuracy, Transparency and RelevancePerformance Measurement: Ensuring Accuracy, Transparency and Relevance
Performance Measurement: Ensuring Accuracy, Transparency and Relevance
 
The Degree Gap
The Degree GapThe Degree Gap
The Degree Gap
 
State Authorization Reciprocity Agreement (SARA) Briefing
State Authorization Reciprocity Agreement (SARA) BriefingState Authorization Reciprocity Agreement (SARA) Briefing
State Authorization Reciprocity Agreement (SARA) Briefing
 
Campus Safety and Violence Prevention Task Force
Campus Safety and Violence Prevention Task ForceCampus Safety and Violence Prevention Task Force
Campus Safety and Violence Prevention Task Force
 
STEM Starter Academy Briefing & Year 2 Report
STEM Starter Academy Briefing & Year 2 ReportSTEM Starter Academy Briefing & Year 2 Report
STEM Starter Academy Briefing & Year 2 Report
 
Statewide Workforce Planning Update
Statewide Workforce Planning UpdateStatewide Workforce Planning Update
Statewide Workforce Planning Update
 
The Commonwealth Commitment
The Commonwealth CommitmentThe Commonwealth Commitment
The Commonwealth Commitment
 
Definition of College and Career Readiness Incorporating Civic Learning and E...
Definition of College and Career Readiness Incorporating Civic Learning and E...Definition of College and Career Readiness Incorporating Civic Learning and E...
Definition of College and Career Readiness Incorporating Civic Learning and E...
 
Higher Education & Massachusetts' Next-Generation Assessment
Higher Education & Massachusetts' Next-Generation AssessmentHigher Education & Massachusetts' Next-Generation Assessment
Higher Education & Massachusetts' Next-Generation Assessment
 
FY2017 Budget Recommendation
FY2017 Budget RecommendationFY2017 Budget Recommendation
FY2017 Budget Recommendation
 
GEAR UP Massachusetts
GEAR UP MassachusettsGEAR UP Massachusetts
GEAR UP Massachusetts
 
Highlights: 2015 Fall Enrollment Estimates
Highlights: 2015 Fall Enrollment EstimatesHighlights: 2015 Fall Enrollment Estimates
Highlights: 2015 Fall Enrollment Estimates
 

Último

1029 - Danh muc Sach Giao Khoa 10 . pdf
1029 -  Danh muc Sach Giao Khoa 10 . pdf1029 -  Danh muc Sach Giao Khoa 10 . pdf
1029 - Danh muc Sach Giao Khoa 10 . pdfQucHHunhnh
 
Introduction to Nonprofit Accounting: The Basics
Introduction to Nonprofit Accounting: The BasicsIntroduction to Nonprofit Accounting: The Basics
Introduction to Nonprofit Accounting: The BasicsTechSoup
 
Advanced Views - Calendar View in Odoo 17
Advanced Views - Calendar View in Odoo 17Advanced Views - Calendar View in Odoo 17
Advanced Views - Calendar View in Odoo 17Celine George
 
SOCIAL AND HISTORICAL CONTEXT - LFTVD.pptx
SOCIAL AND HISTORICAL CONTEXT - LFTVD.pptxSOCIAL AND HISTORICAL CONTEXT - LFTVD.pptx
SOCIAL AND HISTORICAL CONTEXT - LFTVD.pptxiammrhaywood
 
Measures of Dispersion and Variability: Range, QD, AD and SD
Measures of Dispersion and Variability: Range, QD, AD and SDMeasures of Dispersion and Variability: Range, QD, AD and SD
Measures of Dispersion and Variability: Range, QD, AD and SDThiyagu K
 
Russian Call Girls in Andheri Airport Mumbai WhatsApp 9167673311 💞 Full Nigh...
Russian Call Girls in Andheri Airport Mumbai WhatsApp  9167673311 💞 Full Nigh...Russian Call Girls in Andheri Airport Mumbai WhatsApp  9167673311 💞 Full Nigh...
Russian Call Girls in Andheri Airport Mumbai WhatsApp 9167673311 💞 Full Nigh...Pooja Nehwal
 
Presentation by Andreas Schleicher Tackling the School Absenteeism Crisis 30 ...
Presentation by Andreas Schleicher Tackling the School Absenteeism Crisis 30 ...Presentation by Andreas Schleicher Tackling the School Absenteeism Crisis 30 ...
Presentation by Andreas Schleicher Tackling the School Absenteeism Crisis 30 ...EduSkills OECD
 
Arihant handbook biology for class 11 .pdf
Arihant handbook biology for class 11 .pdfArihant handbook biology for class 11 .pdf
Arihant handbook biology for class 11 .pdfchloefrazer622
 
Ecosystem Interactions Class Discussion Presentation in Blue Green Lined Styl...
Ecosystem Interactions Class Discussion Presentation in Blue Green Lined Styl...Ecosystem Interactions Class Discussion Presentation in Blue Green Lined Styl...
Ecosystem Interactions Class Discussion Presentation in Blue Green Lined Styl...fonyou31
 
Activity 01 - Artificial Culture (1).pdf
Activity 01 - Artificial Culture (1).pdfActivity 01 - Artificial Culture (1).pdf
Activity 01 - Artificial Culture (1).pdfciinovamais
 
Nutritional Needs Presentation - HLTH 104
Nutritional Needs Presentation - HLTH 104Nutritional Needs Presentation - HLTH 104
Nutritional Needs Presentation - HLTH 104misteraugie
 
Paris 2024 Olympic Geographies - an activity
Paris 2024 Olympic Geographies - an activityParis 2024 Olympic Geographies - an activity
Paris 2024 Olympic Geographies - an activityGeoBlogs
 
social pharmacy d-pharm 1st year by Pragati K. Mahajan
social pharmacy d-pharm 1st year by Pragati K. Mahajansocial pharmacy d-pharm 1st year by Pragati K. Mahajan
social pharmacy d-pharm 1st year by Pragati K. Mahajanpragatimahajan3
 
Beyond the EU: DORA and NIS 2 Directive's Global Impact
Beyond the EU: DORA and NIS 2 Directive's Global ImpactBeyond the EU: DORA and NIS 2 Directive's Global Impact
Beyond the EU: DORA and NIS 2 Directive's Global ImpactPECB
 
Disha NEET Physics Guide for classes 11 and 12.pdf
Disha NEET Physics Guide for classes 11 and 12.pdfDisha NEET Physics Guide for classes 11 and 12.pdf
Disha NEET Physics Guide for classes 11 and 12.pdfchloefrazer622
 
JAPAN: ORGANISATION OF PMDA, PHARMACEUTICAL LAWS & REGULATIONS, TYPES OF REGI...
JAPAN: ORGANISATION OF PMDA, PHARMACEUTICAL LAWS & REGULATIONS, TYPES OF REGI...JAPAN: ORGANISATION OF PMDA, PHARMACEUTICAL LAWS & REGULATIONS, TYPES OF REGI...
JAPAN: ORGANISATION OF PMDA, PHARMACEUTICAL LAWS & REGULATIONS, TYPES OF REGI...anjaliyadav012327
 
Call Girls in Dwarka Mor Delhi Contact Us 9654467111
Call Girls in Dwarka Mor Delhi Contact Us 9654467111Call Girls in Dwarka Mor Delhi Contact Us 9654467111
Call Girls in Dwarka Mor Delhi Contact Us 9654467111Sapana Sha
 
Grant Readiness 101 TechSoup and Remy Consulting
Grant Readiness 101 TechSoup and Remy ConsultingGrant Readiness 101 TechSoup and Remy Consulting
Grant Readiness 101 TechSoup and Remy ConsultingTechSoup
 

Último (20)

1029 - Danh muc Sach Giao Khoa 10 . pdf
1029 -  Danh muc Sach Giao Khoa 10 . pdf1029 -  Danh muc Sach Giao Khoa 10 . pdf
1029 - Danh muc Sach Giao Khoa 10 . pdf
 
Introduction to Nonprofit Accounting: The Basics
Introduction to Nonprofit Accounting: The BasicsIntroduction to Nonprofit Accounting: The Basics
Introduction to Nonprofit Accounting: The Basics
 
Advanced Views - Calendar View in Odoo 17
Advanced Views - Calendar View in Odoo 17Advanced Views - Calendar View in Odoo 17
Advanced Views - Calendar View in Odoo 17
 
SOCIAL AND HISTORICAL CONTEXT - LFTVD.pptx
SOCIAL AND HISTORICAL CONTEXT - LFTVD.pptxSOCIAL AND HISTORICAL CONTEXT - LFTVD.pptx
SOCIAL AND HISTORICAL CONTEXT - LFTVD.pptx
 
Measures of Dispersion and Variability: Range, QD, AD and SD
Measures of Dispersion and Variability: Range, QD, AD and SDMeasures of Dispersion and Variability: Range, QD, AD and SD
Measures of Dispersion and Variability: Range, QD, AD and SD
 
Russian Call Girls in Andheri Airport Mumbai WhatsApp 9167673311 💞 Full Nigh...
Russian Call Girls in Andheri Airport Mumbai WhatsApp  9167673311 💞 Full Nigh...Russian Call Girls in Andheri Airport Mumbai WhatsApp  9167673311 💞 Full Nigh...
Russian Call Girls in Andheri Airport Mumbai WhatsApp 9167673311 💞 Full Nigh...
 
Presentation by Andreas Schleicher Tackling the School Absenteeism Crisis 30 ...
Presentation by Andreas Schleicher Tackling the School Absenteeism Crisis 30 ...Presentation by Andreas Schleicher Tackling the School Absenteeism Crisis 30 ...
Presentation by Andreas Schleicher Tackling the School Absenteeism Crisis 30 ...
 
Arihant handbook biology for class 11 .pdf
Arihant handbook biology for class 11 .pdfArihant handbook biology for class 11 .pdf
Arihant handbook biology for class 11 .pdf
 
Ecosystem Interactions Class Discussion Presentation in Blue Green Lined Styl...
Ecosystem Interactions Class Discussion Presentation in Blue Green Lined Styl...Ecosystem Interactions Class Discussion Presentation in Blue Green Lined Styl...
Ecosystem Interactions Class Discussion Presentation in Blue Green Lined Styl...
 
Activity 01 - Artificial Culture (1).pdf
Activity 01 - Artificial Culture (1).pdfActivity 01 - Artificial Culture (1).pdf
Activity 01 - Artificial Culture (1).pdf
 
Nutritional Needs Presentation - HLTH 104
Nutritional Needs Presentation - HLTH 104Nutritional Needs Presentation - HLTH 104
Nutritional Needs Presentation - HLTH 104
 
Paris 2024 Olympic Geographies - an activity
Paris 2024 Olympic Geographies - an activityParis 2024 Olympic Geographies - an activity
Paris 2024 Olympic Geographies - an activity
 
social pharmacy d-pharm 1st year by Pragati K. Mahajan
social pharmacy d-pharm 1st year by Pragati K. Mahajansocial pharmacy d-pharm 1st year by Pragati K. Mahajan
social pharmacy d-pharm 1st year by Pragati K. Mahajan
 
Beyond the EU: DORA and NIS 2 Directive's Global Impact
Beyond the EU: DORA and NIS 2 Directive's Global ImpactBeyond the EU: DORA and NIS 2 Directive's Global Impact
Beyond the EU: DORA and NIS 2 Directive's Global Impact
 
Disha NEET Physics Guide for classes 11 and 12.pdf
Disha NEET Physics Guide for classes 11 and 12.pdfDisha NEET Physics Guide for classes 11 and 12.pdf
Disha NEET Physics Guide for classes 11 and 12.pdf
 
Mattingly "AI & Prompt Design: The Basics of Prompt Design"
Mattingly "AI & Prompt Design: The Basics of Prompt Design"Mattingly "AI & Prompt Design: The Basics of Prompt Design"
Mattingly "AI & Prompt Design: The Basics of Prompt Design"
 
JAPAN: ORGANISATION OF PMDA, PHARMACEUTICAL LAWS & REGULATIONS, TYPES OF REGI...
JAPAN: ORGANISATION OF PMDA, PHARMACEUTICAL LAWS & REGULATIONS, TYPES OF REGI...JAPAN: ORGANISATION OF PMDA, PHARMACEUTICAL LAWS & REGULATIONS, TYPES OF REGI...
JAPAN: ORGANISATION OF PMDA, PHARMACEUTICAL LAWS & REGULATIONS, TYPES OF REGI...
 
Call Girls in Dwarka Mor Delhi Contact Us 9654467111
Call Girls in Dwarka Mor Delhi Contact Us 9654467111Call Girls in Dwarka Mor Delhi Contact Us 9654467111
Call Girls in Dwarka Mor Delhi Contact Us 9654467111
 
Grant Readiness 101 TechSoup and Remy Consulting
Grant Readiness 101 TechSoup and Remy ConsultingGrant Readiness 101 TechSoup and Remy Consulting
Grant Readiness 101 TechSoup and Remy Consulting
 
Código Creativo y Arte de Software | Unidad 1
Código Creativo y Arte de Software | Unidad 1Código Creativo y Arte de Software | Unidad 1
Código Creativo y Arte de Software | Unidad 1
 

Memo to Massachusetts

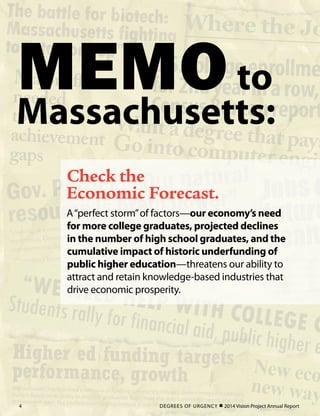
  • 1. Check the Economic Forecast. A“perfect storm”of factors—our economy’s need for more college graduates, projected declines in the number of high school graduates, and the cumulative impact of historic underfunding of public higher education—threatens our ability to attract and retain knowledge-based industries that drive economic prosperity. MEMOto Massachusetts: DEGREES OF URGENCY  2014 Vision Project Annual Report4
  • 2. It’s time to heed the forecast and do what we can to grow the Commonwealth’s single best asset in the global competition for jobs, investment and talent: our pool of high-skilled college graduates. Degrees of Urgency documents the potential impact of a newly projected shortfall of college graduates fueled by the three factors identified at left. This report also details our plan to ramp up college completion numbers by 2025 in order to meet the Commonwealth’s workforce needs and the Vision Project goal of producing “the best-educated citizenry and workforce in the nation.” It's a tall order, but one that we must fill—with economic consequences for Massachusetts if we do not.   5Memo to Massachusetts
  • 3. RisingNeedfor College-EducatedWorkers Throughout his two terms in office, Governor Deval Patrick has focused relentlessly on the growing impor- tance of the state’s public higher education system in meeting the “skills gap.” With capital investments at every campus, budget increases that bucked national trends, and repeated reminders of the talent demands of our innovation sectors, he has raised expectations for a public system that now educates 70 percent of residents who remain in Massachusetts to attend college1 . Business leaders are also looking to public colleges and universities to fill the talent pipeline—and are making no secret of the challenges they face in finding high-skilled job applicants. In a 2013 survey by the Massachusetts Business Alliance for Education, 69 percent of business leaders in the state said they found it difficult to find people with the right skills for the positions they need to fill. Meanwhile, other leading technology states—New York, Pennsylvania, Ohio, Illinois, Minnesota, and in some industry sectors, Texas and California—outperform Massachusetts when it comes to producing enough high-skilled graduates to fill jobs2 . In Massachusetts today there are an estimated six job openings for every college graduate holding an associate’s degree or certificate in computer science or IT—and over 17 such openings for every graduate While Massachusetts public higher education enrollments have recently been at historic highs, enrollment declines are expected to spread across the system in the next few years. Producing more graduates with degrees and competencies needed for high-demand jobs in knowledge-based industries will require public campuses to: „„ Intensify and focus efforts to support a rapidly changing population of students who face significant barriers to success. „„ Mount aggressive recruitment strategies to enroll more students from underserved groups and communities within our state’s population. „„ Provide a top-quality education while working collaboratively to reduce costs and maximize operational efficiencies. And will require the state’s political leaders to: „„ Sustain and grow investments in public higher education so that public campuses have sufficient resources to help students succeed and meet industry demand for high-skilled talent. „„ Significantly expand state financial aid programs so that an affordable college education is within reach of every citizen willing to work toward a post-secondary degree or certificate. Memo to Massachusetts: We are on the case. P.S. @MassDHE and the campuses are using social media to send a “Memo to Massachusetts.” Please join the conversation on Twitter and other social networks with #Memo2MA. #Memo2MA In Brief   from page 5 5:1Current ratio of Massachusetts health care job openings to recent graduates holding related associate’s and bachelor’s degrees2 DEGREES OF URGENCY  2014 Vision Project Annual Report6
  • 4. Current ratio of Massachusetts information technology & computer science job openings to recent graduates holding related bachelor’s degrees2 Percentage of Massachusetts jobs that will require some college education by 20204 with a bachelor’s degree2 . Put another way: Massachu- setts needs more than 5,000 computer science and information technology graduates right now. “A major roadblock to expansion of the high-tech sector in Massachusetts is the talent shortage,” says Tom Hop- croft, member of the Massachusetts Board of Higher Education and president & CEO of the Massachusetts Technology Leadership Council. “We have the jobs to fill, but not the people to fill them. We need to align our public higher education curriculum with the needs of the innovation economy by fostering more graduates in the computing and information technology fields.” PublicHigherEd’s HeightenedImportance In every major business and industry sector that drives economic growth, Massachusetts will need to expand our talent pipeline or risk losing our competitive edge. But the dominant role that Massachusetts public colleges and universities will play in educating the Commonwealth’s future entrepreneurs, IT managers, medical researchers and preschool teachers is not yet fully understood. With many private college and university graduates leaving Massachusetts to make their lives elsewhere, nine of every ten public college and university students remain in state, working or furthering their studies, one year after graduation3 .  Current ratio of Massachusetts information technology & computer science job openings to recent graduates holding related associate’s degrees and certificates2 6:1 17:1 72% Seepage31formoredatafromourlabormarket analysismadepossiblebyHelpWantedOnline,a real-timelabormarketinformationtool. If we hope to reap the economic dividends that come from being an educational leader, Massachusetts must make academic excellence for its public colleges and universities an even higher priority than it is right now.” —Charles F. Desmond, Chairman, Massachusetts Board of Higher Education 7Memo to Massachusetts
  • 5. 70% They deserve—and Massachusetts needs them to have— an education that is not just affordable but also truly outstanding. “If we hope to reap the economic dividends that come from being an educational leader,” says Charles F. Desmond, chair of the Massachusetts Board of Higher Education, “Massachusetts must make academic excellence for its public colleges and universities an even higher priority than it is right now.” Through the Vision Project, the Commonwealth’s public campuses have been engaged in a multi-year, multi- pronged effort to improve performance with the goal of becoming a national leader among state systems of higher education. Our work to reach the ranks of the nation’s Top 10 systems—and our no-holds-barred reporting of data on how much progress still needs to be made to reach that goal—were included in the first two Vision Project annual reports. These reports—as well as this year’s analysis—highlight progress but also make clear that, when it comes to graduation rates, Massachusetts’ system of public higher education remains at or slightly above average in com- parison with other state systems. Recent demographic and workforce analyses reviewed or conducted by the Department of Higher Education (DHE) show that the system is currently not on track to produce enough degree-holders to fill jobs in technology, health care, and other high-demand fields within the next decade. Based on current degree production rates and future enrollment projections, we believe that, by 2025, Massachusetts’public higher education system will fall short of meeting the state’s need for new associate’s and bachelor’s degrees by a minimum of 55,000 to 65,0008 . Without a course correction, those missing degrees will translate into thousands of lost opportunities, as employers struggle to find talent for high-skilled, good-paying jobs and students attempting to compete for jobs in the best-paying and most rapidly growing sectors of the economy discover that they lack the credentials to compete. Helping tens of thousands of additional college students reach graduation day with diplomas and certificates in hand won’t be easy and might even be dismissed as an impossible task. The challenge we have set for ourselves— as academic policy experts and labor economists can attest—is HUGE. To reach our goals within the next decade, Massachusetts public colleges and universities will need to graduate more students who have greater academic and economic challenges, and must do so in less time and with more efficient use of state dollars than ever before. 30% 52%  from page 7 Mass. public higher ed share of all Mass. undergrads in 19675 Mass. public higher ed share of Mass. high school graduates enrolled in Mass. colleges as first-time, degree- seeking students in 20131 Mass. public higher ed share of all Mass. undergrads in 20136 WestfieldStatestudents,1967.Photocourtesy ofWestfieldStateUniversityLibrary. MassasoitCommunityCollegestudents,2014. PhotocourtesyofJamesLynch/Massasoit. DEGREES OF URGENCY  2014 Vision Project Annual Report8
  • 6. Understandingthe DegreeShortfall Within six years, Massachusetts will see its total pool of high school graduates shrink by 9 percent7 . This represents a big turnaround from the previous decade. Between 1996–97 and 2007–08, the state saw a 31 percent increase in high school graduates7 ; college application numbers soared, and admissions standards tightened. Although enrollments at a number of campuses remain robust, this fall overall enrollment for the entire system declined slightly for the first time in a decade. This trend is forecasted to continue, accelerate and spread across the system, which will compromise efforts to produce enough graduates to fill jobs in the Commonwealth’s flagship industries, including technology and health care. Further, by 2020, the number of White high school grad- uates (whose overall college participation and comple- tion rates are significantly higher than those for students of color) will decline by 15 percent7 . While the ranks of Asian/Pacific-Islander and Latino/a students continue to grow, their numbers aren’t increasing fast enough to offset this decline. Getting more students into college and through to graduation—particularly African-American and Latino/a students—isn’t just a matter of social justice. It’s also an economic imperative for the state. Consider this: If African-American and Latino/a adults possessed college degrees at the same rate as White adults (60%), the state would easily meet its need for more college graduates by 20259 .  +31% –9% 55– 65K A major roadblock to expansion of the high-tech sector in Massachusetts is the talent shortage. We have the jobs to fill, but not the people to fill them.” —Tom Hopcroft, President & CEO, Massachusetts Technology Leadership Council, and Member, Massachusetts Board of Higher Education Projected drop in Massachusetts high school students graduating annually between 2009 and 20207 Increase in Massachusetts high school students graduating annually between 1997 and 20087 Projected shortfall of associate’s and bachelor’s degrees to be awarded by Massachusetts public colleges and universities 2015–2025, compared with projected need8 Consider this: If African-American and Latino/a adults possessed college degrees at the same rate as White adults (60%), Massachusetts would easily meet its need for more college graduates by 20259 . 9Memo to Massachusetts
  • 7. TheImpactof HistoricUnderfunding For the past two years under the leadership of Governor Patrick, Massachusetts has been among the vanguard of states that have bucked national trends and increased funding for public colleges and universities. The Governor was a strong proponent of strategic investments in the state’s higher education system, advocating for substantial increases in appropriations in FY14 and FY15. But the relatively good budgets still leave Massachusetts trailing other states in appropriation per full-time enrolled student (FTE). From FY08 to FY14, during the recession and recovery, Massachusetts cut funding for its public higher education system at twice the rate of the ten best-funded state systems in the country10 . The neediest students are hardest hit; their financial struggles only lengthen the time it takes to complete certificates and degrees. While the value of the state’s MASSGrant financial aid program has dropped to less than 10 percent of the average cost of attending a public college or university, the average loan debt carried by public college and university students has risen sharply, up 27 percent in just the last three years11 . “Being average with regard to overall system performance and below average in state support per student and state investment in financial aid is unacceptable in the Commonwealth where the brainpower of our citizens Massachusetts must build one of the Top 10 public systems in the nation with regard to both overall performance and state investments in order to provide an affordable as well as high-quality education for all students.” —Higher Education Finance Commission More information at www.mass.edu/hefc Alaska North Dakota Wyoming California Nebraska Texas New Mexico Tennessee NewYork Mississippi North Carolina Illinois Connecticut Hawaii In FY2013 In FY2014 In both years  from page 9 –14%Decline in Massachusetts’ appropriations for public higher ed per FTE between FY2008 and FY2014—double the top 10 states’ average decline10 Top 10 States in Public Higher Ed Appropriations per FTE in FY2013 & 201410 DEGREES OF URGENCY  2014 Vision Project Annual Report10
  • 8. $10.8K $6.5K is our primary economic resource,” members of a Higher Education Finance Commission created by the Legislature concluded recently. “Massachusetts must build one of the top 10 public systems in the country with regard to both overall performance and state investments in order to provide an affordable as well as high-quality education for all students,” the Commission concluded in its final report accepted by Governor Patrick, noting the cost shift from state to student and the impact on college completion rates as a result of “historic underinvestment.” An aggressive effort to help more students earn degrees and certificates costs money. Yet in most states, the disconnect between the need to produce more graduates and the additional state investment needed to meet these attainment goals is striking. “While policy makers at all levels are jumping on the (college degree) attainment bandwagon, they are not attending to a key corresponding issue: how the successful pursuit of these goals is to be funded,” wrote Dennis Jones, president of the non-profit National Center for Higher Education Management Systems in a recent issue of Change Magazine. “What combination of financial strate- gies can be implemented to provide sufficient resources to accommodate more (and harder-to-serve) students while maintaining affordability for both families and taxpayers? Failure to provide a credible response to this question has the potential to derail the bandwagon.” At the same time, Jones stated that public colleges and universities must be willing to have funding tied to the number of graduates they deliver, not just to the number of students they enroll. (Massachusetts community colleges are at present the only segment of public higher education to embrace a performance- based funding model. Read more about the formula’s impact on page 24.) Top 10 states’average funding per FTE in FY201410 Massachusetts’funding per FTE in FY201410 “MEMO TO MASSACHUSETTS” SOURCES 1 U.S. Department of Education (IPEDS), Fall 2012. Calculations by Massachusetts Department of Higher Education (MDHE). 2 Wanted Analytics, May–July 2014; U.S. Department of Education (IPEDS), 2010–2012 (three-year average). Calculations by MDHE. 3 MDHE; Massachusetts Department of Career Services; National Student Clearinghouse. Calculations by MDHE. 4 Georgetown University: Center on Education and the Workforce, Recovery: Job Growth and Education Requirements Through 2020, June 2013. 5 U.S. Department of Education (IPEDS/ HEGIS), Fall 1967. 6 U.S. Department of Education (IPEDS), Fall 2013. 7 Western Interstate Commission for Higher Education, Knocking at the College Door: Projections of High School Graduates, December 2012. 8 MDHE; University of Massachusetts Donahue Institute Demographic Projections; Georgetown University: Center on Education and the Workforce, Recovery: Job Growth and Education Requirements Through 2020, June 2013; New England Economic Partnership: Massachusetts Forecast. Calculations by MDHE. 9 U.S. Census Bureau, American Community Survey, 2010–2012. IPUMS-USA, University of Minnesota, www.ipums.org. 10 Primary Data Source: State Higher Educa- tion Executive Officers (SHEEO), State Higher Education Finance (SHEF)—FY2013 (http:// www.sheeo.org/resources/publications/ shef-%E2%80%94-state-higher-education- finance-fy13). Note: FY2014 figures on state support for higher education represent initial allocations and estimates reported by states from September through December 2013 and are subject to change (see SHEF FY2013 report for additional explanation). FY2014 FTE is estimated for non-MA states based on Current Term Enrollment Report data from the National Student Clearing- house and FY2013 FTE data reported in the SHEF FY2013 report. Both FY2008 and FY2013 total state support per FTE calcula- tions include cost of living and enrollment mix adjustments provided in the SHEF FY2013 report. 11 MDHE. 11Memo to Massachusetts