
Recomendados
Recomendados
Mais conteúdo relacionado
Semelhante a Visualising errors in animal pedigree genotype data
Semelhante a Visualising errors in animal pedigree genotype data (20)
Mais de martinjgraham
Mais de martinjgraham (9)
Último
Último (20)
Visualising errors in animal pedigree genotype data
- 1. VISUALISING ERRORS IN ANIMAL PEDIGREE GENOTYPE DATA Martin Graham, Jessie Kennedy, Trevor Paterson & Andy Law Edinburgh Napier University & The Roslin Institute, Univ of Edinburgh, UK
- 2. Pedigrees Animal pedigrees are their family trees – who’s whose father, mother etc In animal breeding these pedigrees are strictly controlled to maximise traits of value or suppress unwanted ones
- 3. Pedigree Genotypes A genotype is the genetic make-up of an animal Example Pedigree + genotype = pedigree genotype Individual Marker Values M1 C|T M2 A|A M3 A|G ... ... Not the whole genotype, use sets of markers Marker type: SNP (Single Nucleotide Polymorphism)
- 4. But... However, most large datasets have errors Errors when recording pedigree Technical errors e.g. wrongly detected marker Misassigned samples Also incomplete data These errors make the data genetically inconsistent Thismakes them unusable for most downstream analyses
- 5. Example Mum Dad ? A|A G || G G G C ? Junior A| C C Various possibilities here Dad is Juniors’ father but the genotyping is incorrect Dad isn’t Junior’s father and the genotypes are correct Need to find/isolate/clean such data
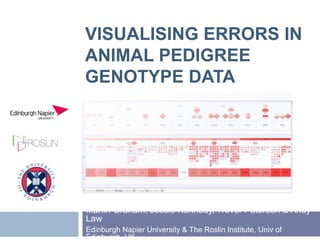
- 6. Table Viewer Current table-based viewer Grid of markers x individuals; genotype values in cells Universally ‘bad’ markers or individuals stand out
- 7. Table Viewer Expert biologists are needed to pinpoint the source of reported errors But without a pedigree context to anchor the errors in, it’s impossible to do this
- 8. Previous Work Multitude of pedigree viewers, but all have issues with scalability or handling extra (genotype) data
- 9. Voyage of Discovery Mainly discovering representations that didn’t work Iterated through a number of different representation styles that failed for various reasons
- 10. Node-Link View Can see that the pedigree clusters around a few males But hard to follow edges/directions, loss of generational context
- 11. Hierarchical Node-Link View Regain visual generation structure of pedigree But plagued with more edge crossings than before
- 12. Matrix View Matrices are the main alternative to drawing node- link diagrams for relational information We rejected having one overall matrix due to sparsity
- 13. Matrix View One matrix per generation ‘gap’ (parent offspring) Rather than sources v sinks - sires v dams; offspring in cells
- 14. Sandwich View Realised that in these matrices, either the rows or columns will only have one filled cell each if one of the parent genders is monogamous In animal experiments this tends to be the case, a female breeds with only one male per generation Each matrix can thus be replaced with a compressed view
- 15. Sandwich View The sandwich view is a specialised view of the bipartite graph between two generations With the top layer split into males/females and the females pushed beneath the bottom layer Parents Sires Offsprin Offsprin g g Dams Connectors to repeated node representations if necessary
- 16. Sandwich View Sandwich view of the relationships between two adjacent generations Sires (Male Parents) Offspring Dams (Female Parents) 1 male has children with multiple females All the other pedigree views of full generations involved tracing paths between parents/offspring
- 17. Sandwich View
- 18. Error Information Colour is used to convey an individual’s error status over all the markers in a data set More errors = higher saturation Parent – coloured by overall error count Offspring drawn as hexagonal glyphs ‘Up’ triangle – incompatibilities with sire ‘Down’ triangle – incompatibilities with dam Middle portion – markers exist that are not present in either parent
- 19. Error Information Aggregating offspring Groups of siblings who share the same parents can be aggregated under one glyph Colouringnow represents errors in all markers over a group of individuals Troublesome families & parents can be clearly
- 20. Filtering Error Filtering The table view ( ) clearly showed rogue markers and individuals, and these can be filtered by a user in that application To the sandwich view we add two complementary histograms that perform the same purpose
- 21. Filtering Error Filtering Each histogram shows number of errors along the X axis Number of individuals/markers with that number of errors on the Y axis Typical pattern: A few individuals / markers have lots of errors, and the majority have a few or no errors Mantra is to discard bad markers and look at bad individuals
- 22. Sandwich view Pic/Vid of full view (To Do)
- 23. Video
- 24. Conclusion Developed new style of pedigree visualisation Shows detailed errors at a family level Shows overview of errors in an entire pedigree Keeps offspring close to their parents for family- centric view
- 25. Future Work Single marker views of errors Making the sandwich into a club sandwich Split the middle layer into multiple layers i.e. By gender to spot sex-related marker errors
- 26. Acknowledgements Reviewers BBSRC funded project
Notas do Editor
- By controlled, i.e. Controlling which animal mates with which other animals
- This data is the basis for studying genetic inheritance and mapping genes of interestSNPs are places along chromosomes where there is variation in a population’s genotypesTypically 1000s of markers and 1000s of individualsA restricted graph with multivariate data at each nodeIn a perfect world this would be the end of the presentation
- Incomplete data isn’t bad or erroneous though – it’s just missing
- Good for spotting bad markers and bad individuals (i.e. Obviously wrong individuals)
- Is the father bad? Are groups of offspring from the same mating reported bad? Etc etc
- Issues with handling multivariate data (genotyping) or easily associating family groups (offspring drawn distant from parents, parents not shown together)Individual centric views not appropriateA lot of the issues we repeated with our prototypes...
- Traditional force-directed view, is rubbishHierarchical data needs a hierarchy-preserving representation
- More edge crossings as placement is more restricted. Are methods for alleviating edge crossings (our dag drawing)
- Matrices avoid edge crossings. Also allows sorting of parents by properties. Still very sparse
- Matrices avoid edge crossings. Also allows sorting of parents by properties. Still very sparse
- In no way general purpose, works only because offspring have 2 links, one to a female parent, one to a male parent
- Males span several columns at a time. Vis is just an adapted Jtable at heart
- Larger scale view of the sandwich
- Can go by average error metric across individuals or max error metric of any individual in a family