Beep bee app: overview presentation March 2018
•Transferir como PPTX, PDF•
3 gostaram•1,321 visualizações

An introduction to the history, development process, status and goals of Beep: bee health monitoring with digital tools.

Recomendados
Mais conteúdo relacionado
Mais de Marten Schoonman
Último
Último (20)
Beep bee app: overview presentation March 2018
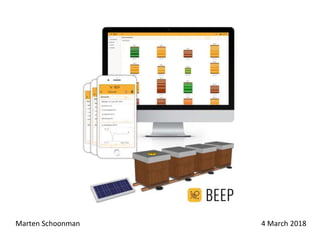
- 1. Marten Schoonman 4 March 2018
- 2. bijenstal breukelen This is where I keep bees. Five colonies currently. Link: https://www.facebook.com/bijenstalbreukelen/
- 3. How do I know if the bees are well? By inspecting the colony. But could I know this from a distance and be able to check this at all times? In short: I wondered what one can measure on a beehive and how..
- 4. I published a blog on the subject in March 2016. Link: http://martenschoonman.blogspot.nl/2016/03/digital- beehive-monitoring.html
- 5. While doing research I stumbled upon a presentation by Hivetool. This graph made me very enthusiastic. So it is possible! It is even possible to see from the weight change in the morning that a large number of bees left to forage! Link: http://hivetool.net/hive_reports/hivetool_2Apr14.ppt
- 6. I got in touch with various people interested in the same subject and dedicated in taking this forward together. Here some photos of meetings and brainstorms hosted by Beelease in Amsterdam mostly.
- 7. In the meeting discussing the biggest needs of the beekeepers and where they can be supported, we concluded a user-friendly free digitale record keeping app combined with an affordable measurement system makes most sense. Here a photo of my paper-based record keeping system. Not the most handy tool in this day and age of apps for everything.
- 8. Pim van Gennip of Iconize worked on the designs of the first version of the platform, which we called Beep.
- 9. Here an example of an early design which was reviewed and further improved.
- 10. With great contribution by Dirk Dekker of Beelease organising a crowdfunding campaign and finding corporate supporters and also sharing a wealth of beekeeping experience, and the design and technical development by Pim van Gennip and support by Bente Deenekamp, the development of version 1 was made possible. It was released in July 2017. See here several screenshots of the Beep app. You can try and use the app via http://beep.nl/ It is free of charge, made possible by sponsors. A manual with screenshots is available. It is a ‘webapp’ and works on both mobile phones, tablets and websites but is not (yet) available in the app stores.
- 11. Inspection log items An analysis was done of the items that belong in the record keeping app. In version 1 we choose to go for the ‘minimal viable product’; the key items to include. In two languages: English and Dutch.
- 12. Bee data taxonomy in Beep v2 However for version 2 (to become available spring 2018) of the Beep app we include a feature for a beekeepers to make their own list with items to include on the inspection log. To keep the data organised and (if needed) suitable for scientific analysis, we created a data structure, or: bee data taxonomy, that the beekeepers can choose from. Here above you see the subjects of the main branches of this taxonomy.
- 13. Bijen data taxonomie Every main branch has a range of data fields underneath. In this example some data for the queen bee is shown. The icons show the type of field. A taxonomy editor is built in the admin module of Beep. The taxonomy can easily be edited, e.g. adding an item to a list.
- 14. Hardware: Here you see the first concept of the hive weight scale underneath the hive. It was installed for the first time in December 2016.
- 15. Here the weight sensors are visible. An Arduino Autonomo is used of Sodaq and data is transmitted via GSM. Pim van Gennip built the concept. It worked beautifully for the whole of 2017. Some examples of the data...
- 16. This is an example of the weight data visible in the Beep app. A swarm left in the morning hours (around two kilos weight drop). Several hours later the swarm was found and placed in a hive. The peak in the afternoon is the colony in a bucket placed on the hive.
- 17. 4 April 2017 Here an example of the data from April 2017 measured with the concept weight scale. Bees leave in the morning to forage. The weight increases in the daytime with nectar (and water and pollen) and decreases again in the night because of ventilation (turning nectar into honey). Software used: Grafana.
- 18. 20 April 2017 2.5 kg Later in the month the colony collects net around 2.5 kgs in a day!
- 19. 28 Juni 2017 But in end of June ‘nectar dearth’ hits, hardly any flowers available but lots of mouths to feed in the hive. The weight rapidly decreases and I need to keep an eye on their stock.
- 20. Example: brood temperature (Arnia) Some example from the commercially available hive monitoring tool Arnia: two hives in which the temperature in the brood is monitored. When stable all is well. In one hive something is clearly off. For more reading see http://www.arnia.co.uk/watch-your-weight/
- 21. Example: swarm and brood temperature (Arnia) The captions on the graph explain what happens: swarms leave the colony shown as sudden weights drops. The fertilised queen has left with the swarm. The colony that stays behind needs the a fertilised queen to continue breeding. This takes time. When the temperature in the brood is stable mid July, the beekeepers knows all is well. For more reading: http://www.arnia.co.uk/after-the-swarm/
- 22. Example: robbery (Arnia) There is a sudden sharp decrease of weight of the hive over two days while the colony makes more noise then normally. A case of one colony robbing the stock from this monitored hive. The beekeeper is aware of this and can make sure the colony does not die of hunger. For more reading: http://www.arnia.co.uk/mind-the-gap/
- 23. Beecounter example The movement of bees in and out of the hives provided information on how active they are. This beecounter images is from a DIY site: http://www.instructables.com/id/Honey-Bee-Counter-II/
- 24. With great help of Marcel Horck of Stadsimkerij Tilburg for enabling the sponsoring, we are now (early 2018) developing a prototype version of the open source Beep hive scale with additional sensors as indicated above. Beep makes use of experience shared open source on Hiveeyes.org. 10 prototypes will be made and testing in the coming period. Data transmission will be via wifi and LoRa. It operates on batteries and is water resistant.
- 25. Team and supporters A overview of how Beep is organised and who plays which role.
- 26. Team and sponsors A list of the sponsors supporting the development of Beep
- 27. Collaboration Because of the involvement of various people and the open collaboration approach of Beep, various tools are used to ease the communication and collaboration which include Slack and Trello
- 28. Goals • Further enhance the platform – affordable, open source system for monitoring the health of bee colonies – Strong visual user interface (see example on the right) – data interpretation and alerting – integrate weather and other data • Usage by others – app in multiple languages – use of the taxonomy – open source co-development: see github