SlideShare uma empresa Scribd logo
1 de 12
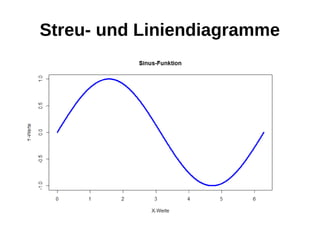
Streu- und Liniendiagramme
Devices
● Man plottet Grafiken in sogenannte Devices
● Ein Device kann ein extra Fenster sein
● Ein Device kann eine PDF-Datei sein
● Ein Device kann ein Bild sein
● .. [AUSGABEKANAL]
Man kann mehrere Devices erstellen, muss
aber immer zwischen ihnen wechseln
Devices erstellen
Befehl Beschreibung
dev.new()
In RStudio: dev.new(noRStudioGD=TRUE)
Erstellt neues „Fenster“-Device
windows() Erstellt neues „Fenster“-Device unter
Windows
X11() Erstellt ein neues „Fenster“-Device unter
Linux
macintosh() Erstellt ein neues „Fenster“-Device unter
Mac OS
pdf(file=“DATEINAME“, width=b height=h) Erstellt eine pdf-Datei DATEINAME mit der
Breite b und Höhe h
jpeg(filename=“DATEINAME,width=b,
height=h,
units=“px“, quality=“BILDQUALITÄT“)
Erstellt ein jpeg-File DATEINAME mit der
Breite b, Höhe h, den Maßeinheiten px und
der Qualität BILDQUALITÄT
*Wenn ein Device erstellt wird, wird es automatisch zum aktiven Device
Mit Devices arbeiten
Befehl Beschreibung
dev.cur() Gibt das aktuelle Device(Name und
Nummer) zurück
dev.list() Gibt eine Liste aller Devices(Namen und
Nummern) zurück
dev.next() Zeigt das nächste Device an
dev.prev() Zeigt das vorherige Device an
dev.set(which=DEVICENUMMER) Macht das Device mit der Devicenummer
DEVICENUMMER zum aktiven Device
Devices schließen
Befehl Beschreibung
dev.off() Schließt das aktuelle Device
dev.off(DEVICENUMMER) Schließt das Device mit der
DEVICENUMMER
Checkpoint
● Devices werden so benötigt, wie ein Papier
zum Zeichnen
=> Wir plotten unsere Grafiken auf/in Devices
High-/Low-Level Funktionen
● High-Level-Funktionen erstellen eigenständig
komplette Diagramme
● Low-Level-Funktionen fügen bestimmte
Elemente einem bestehenden Diagramm hinzu
(Legende, Texte, Linien, Polygone, ..)
plot()-Funktion
● Erstellt Streu- bzw. Liniendiagramme
plot(x=xVektor, y=yVektor type=“Optionen“, main=“Titel“, sub=“Untertitel“)
Wert für type Beschreibung
p Punkte
l Durchgehende Linien
b Punkte und Linien getrennt
o Punkte und Linien überlappend
h Senkrechte Linien zu jedem Datenpunkt
n Fügt dem Diagramm keine Datenpunkte
hinzu (No Plotting)
Weitere plot()-Argumente
Argumente Beschreibung
col=“Farbe“ Farbe(Angabe in Englisch) der
Datenpunkte
cex=WERT Vergrößerungsfaktor für die Datenpunkt-
Symbole, Standard ist 1
lwd=WERT Linienstärke, auch bei
Datenpunktsymbolen, Standard ist 1
pch=WERT Art der Datenpunk-Symbole, entweder
Buchstaben oder siehe ?points
lty=“Schlüsselwort“ Linientyp: solid, dashed, longdash,
twodash, dotdash, dotted,
ylim = c(minY, maxY) Länge der Y-Achse
yaxt = “n“ Y-Achse ausschalten
ylab='Labeltext' Y-Achse benennen
axes = FALSE Achsen ausschalten
*y-Argumente natürlich auch mit x-Argumenten
Elemente einem bestehenden
Diagramm hinzufügen
(Low-Level-Funktionen)
Befehl Beschreibung
points()
z.B. points(x=c(1,2),y=c(3,1))
Punkte hinzufügen
lines()
z.B. lines(x=c(1,2,3),y=c(2,3,1),col='red')
Linien hinzufügen
polygon()
z.B. polygon(x=c(1,2),y=c(4,1))
Polygone hinzufügen
title()
z.B. title(main=“Titel“,sub=“Untertitel“)
Titel hinzfügen
legend()
z.B. legend(x=10,y=11,legend=“text“)
z.B legend(x=“topleft“,legend=“bla“)
Legende hinzufügen
text()
z.B text(x=2.1,y=4,labels=“bli bla blub“)
Text hinzufügen
axis()
z.B. x-Achse: axis(side=1,at=seq(0,10,2))
z.B. y-Achse: axis(side=2,at=seq(0,10,2))
Achsen hinzufügen
Mehrere Diagramme in ein Device
● Man kann mit dem Befehl
par(mfrow=c(ZEILEN,SPALTEN)) ein Device
aufteilen und dann pro Zelle einmal plotten
Mehrere Datenreihen in ein
Diagramm
● So wie durch plot() ein Streudiagramm einer
einzelnen Datenreihe erstellt wird, erstellt
matplot() ein Streudiagramm für mehrere
Datenreihen gleichzeitig.
Xmat ← cbind(1:11,5:15) #Datenreihe1 in Spalte 1, Datenreihe 2 in Spalte 2..
yMat ← cbind(sin(1:11),cos(5:15)) #Datenreihe1 in Spalte1, Datenreihe 2 in..
matplot(x = Xmat, y = yMat, type='l')

Mais conteúdo relacionado

Destaque

How Race, Age and Gender Shape Attitudes Towards Mental Health
How Race, Age and Gender Shape Attitudes Towards Mental HealthHow Race, Age and Gender Shape Attitudes Towards Mental Health
How Race, Age and Gender Shape Attitudes Towards Mental HealthThinkNow
 
AI Trends in Creative Operations 2024 by Artwork Flow.pdf
AI Trends in Creative Operations 2024 by Artwork Flow.pdfAI Trends in Creative Operations 2024 by Artwork Flow.pdf
AI Trends in Creative Operations 2024 by Artwork Flow.pdfmarketingartwork
 
PEPSICO Presentation to CAGNY Conference Feb 2024
PEPSICO Presentation to CAGNY Conference Feb 2024PEPSICO Presentation to CAGNY Conference Feb 2024
PEPSICO Presentation to CAGNY Conference Feb 2024Neil Kimberley
 
Content Methodology: A Best Practices Report (Webinar)
Content Methodology: A Best Practices Report (Webinar)Content Methodology: A Best Practices Report (Webinar)
Content Methodology: A Best Practices Report (Webinar)contently
 
How to Prepare For a Successful Job Search for 2024
How to Prepare For a Successful Job Search for 2024How to Prepare For a Successful Job Search for 2024
How to Prepare For a Successful Job Search for 2024Albert Qian
 
Social Media Marketing Trends 2024 // The Global Indie Insights
Social Media Marketing Trends 2024 // The Global Indie InsightsSocial Media Marketing Trends 2024 // The Global Indie Insights
Social Media Marketing Trends 2024 // The Global Indie InsightsKurio // The Social Media Age(ncy)
 
Trends In Paid Search: Navigating The Digital Landscape In 2024
Trends In Paid Search: Navigating The Digital Landscape In 2024Trends In Paid Search: Navigating The Digital Landscape In 2024
Trends In Paid Search: Navigating The Digital Landscape In 2024Search Engine Journal
 
5 Public speaking tips from TED - Visualized summary
5 Public speaking tips from TED - Visualized summary5 Public speaking tips from TED - Visualized summary
5 Public speaking tips from TED - Visualized summarySpeakerHub
 
ChatGPT and the Future of Work - Clark Boyd
ChatGPT and the Future of Work - Clark Boyd ChatGPT and the Future of Work - Clark Boyd
ChatGPT and the Future of Work - Clark Boyd Clark Boyd
 
Getting into the tech field. what next
Getting into the tech field. what next Getting into the tech field. what next
Getting into the tech field. what next Tessa Mero
 
Google's Just Not That Into You: Understanding Core Updates & Search Intent
Google's Just Not That Into You: Understanding Core Updates & Search IntentGoogle's Just Not That Into You: Understanding Core Updates & Search Intent
Google's Just Not That Into You: Understanding Core Updates & Search IntentLily Ray
 
Time Management & Productivity - Best Practices
Time Management & Productivity -  Best PracticesTime Management & Productivity -  Best Practices
Time Management & Productivity - Best PracticesVit Horky
 
The six step guide to practical project management
The six step guide to practical project managementThe six step guide to practical project management
The six step guide to practical project managementMindGenius
 
Beginners Guide to TikTok for Search - Rachel Pearson - We are Tilt __ Bright...
Beginners Guide to TikTok for Search - Rachel Pearson - We are Tilt __ Bright...Beginners Guide to TikTok for Search - Rachel Pearson - We are Tilt __ Bright...
Beginners Guide to TikTok for Search - Rachel Pearson - We are Tilt __ Bright...RachelPearson36
 
Unlocking the Power of ChatGPT and AI in Testing - A Real-World Look, present...
Unlocking the Power of ChatGPT and AI in Testing - A Real-World Look, present...Unlocking the Power of ChatGPT and AI in Testing - A Real-World Look, present...
Unlocking the Power of ChatGPT and AI in Testing - A Real-World Look, present...Applitools
 
12 Ways to Increase Your Influence at Work
12 Ways to Increase Your Influence at Work12 Ways to Increase Your Influence at Work
12 Ways to Increase Your Influence at WorkGetSmarter
 

Destaque (20)

How Race, Age and Gender Shape Attitudes Towards Mental Health
How Race, Age and Gender Shape Attitudes Towards Mental HealthHow Race, Age and Gender Shape Attitudes Towards Mental Health
How Race, Age and Gender Shape Attitudes Towards Mental Health
 
AI Trends in Creative Operations 2024 by Artwork Flow.pdf
AI Trends in Creative Operations 2024 by Artwork Flow.pdfAI Trends in Creative Operations 2024 by Artwork Flow.pdf
AI Trends in Creative Operations 2024 by Artwork Flow.pdf
 
Skeleton Culture Code
Skeleton Culture CodeSkeleton Culture Code
Skeleton Culture Code
 
PEPSICO Presentation to CAGNY Conference Feb 2024
PEPSICO Presentation to CAGNY Conference Feb 2024PEPSICO Presentation to CAGNY Conference Feb 2024
PEPSICO Presentation to CAGNY Conference Feb 2024
 
Content Methodology: A Best Practices Report (Webinar)
Content Methodology: A Best Practices Report (Webinar)Content Methodology: A Best Practices Report (Webinar)
Content Methodology: A Best Practices Report (Webinar)
 
How to Prepare For a Successful Job Search for 2024
How to Prepare For a Successful Job Search for 2024How to Prepare For a Successful Job Search for 2024
How to Prepare For a Successful Job Search for 2024
 
Social Media Marketing Trends 2024 // The Global Indie Insights
Social Media Marketing Trends 2024 // The Global Indie InsightsSocial Media Marketing Trends 2024 // The Global Indie Insights
Social Media Marketing Trends 2024 // The Global Indie Insights
 
Trends In Paid Search: Navigating The Digital Landscape In 2024
Trends In Paid Search: Navigating The Digital Landscape In 2024Trends In Paid Search: Navigating The Digital Landscape In 2024
Trends In Paid Search: Navigating The Digital Landscape In 2024
 
5 Public speaking tips from TED - Visualized summary
5 Public speaking tips from TED - Visualized summary5 Public speaking tips from TED - Visualized summary
5 Public speaking tips from TED - Visualized summary
 
ChatGPT and the Future of Work - Clark Boyd
ChatGPT and the Future of Work - Clark Boyd ChatGPT and the Future of Work - Clark Boyd
ChatGPT and the Future of Work - Clark Boyd
 
Getting into the tech field. what next
Getting into the tech field. what next Getting into the tech field. what next
Getting into the tech field. what next
 
Google's Just Not That Into You: Understanding Core Updates & Search Intent
Google's Just Not That Into You: Understanding Core Updates & Search IntentGoogle's Just Not That Into You: Understanding Core Updates & Search Intent
Google's Just Not That Into You: Understanding Core Updates & Search Intent
 
How to have difficult conversations
How to have difficult conversations How to have difficult conversations
How to have difficult conversations
 
Introduction to Data Science
Introduction to Data ScienceIntroduction to Data Science
Introduction to Data Science
 
Time Management & Productivity - Best Practices
Time Management & Productivity -  Best PracticesTime Management & Productivity -  Best Practices
Time Management & Productivity - Best Practices
 
The six step guide to practical project management
The six step guide to practical project managementThe six step guide to practical project management
The six step guide to practical project management
 
Beginners Guide to TikTok for Search - Rachel Pearson - We are Tilt __ Bright...
Beginners Guide to TikTok for Search - Rachel Pearson - We are Tilt __ Bright...Beginners Guide to TikTok for Search - Rachel Pearson - We are Tilt __ Bright...
Beginners Guide to TikTok for Search - Rachel Pearson - We are Tilt __ Bright...
 
Unlocking the Power of ChatGPT and AI in Testing - A Real-World Look, present...
Unlocking the Power of ChatGPT and AI in Testing - A Real-World Look, present...Unlocking the Power of ChatGPT and AI in Testing - A Real-World Look, present...
Unlocking the Power of ChatGPT and AI in Testing - A Real-World Look, present...
 
12 Ways to Increase Your Influence at Work
12 Ways to Increase Your Influence at Work12 Ways to Increase Your Influence at Work
12 Ways to Increase Your Influence at Work
 
ChatGPT webinar slides
ChatGPT webinar slidesChatGPT webinar slides
ChatGPT webinar slides
 

R-Programmierung: Streu- und Liniendiagramme plotten

  • 2. Devices ● Man plottet Grafiken in sogenannte Devices ● Ein Device kann ein extra Fenster sein ● Ein Device kann eine PDF-Datei sein ● Ein Device kann ein Bild sein ● .. [AUSGABEKANAL] Man kann mehrere Devices erstellen, muss aber immer zwischen ihnen wechseln
  • 3. Devices erstellen Befehl Beschreibung dev.new() In RStudio: dev.new(noRStudioGD=TRUE) Erstellt neues „Fenster“-Device windows() Erstellt neues „Fenster“-Device unter Windows X11() Erstellt ein neues „Fenster“-Device unter Linux macintosh() Erstellt ein neues „Fenster“-Device unter Mac OS pdf(file=“DATEINAME“, width=b height=h) Erstellt eine pdf-Datei DATEINAME mit der Breite b und Höhe h jpeg(filename=“DATEINAME,width=b, height=h, units=“px“, quality=“BILDQUALITÄT“) Erstellt ein jpeg-File DATEINAME mit der Breite b, Höhe h, den Maßeinheiten px und der Qualität BILDQUALITÄT *Wenn ein Device erstellt wird, wird es automatisch zum aktiven Device
  • 4. Mit Devices arbeiten Befehl Beschreibung dev.cur() Gibt das aktuelle Device(Name und Nummer) zurück dev.list() Gibt eine Liste aller Devices(Namen und Nummern) zurück dev.next() Zeigt das nächste Device an dev.prev() Zeigt das vorherige Device an dev.set(which=DEVICENUMMER) Macht das Device mit der Devicenummer DEVICENUMMER zum aktiven Device
  • 5. Devices schließen Befehl Beschreibung dev.off() Schließt das aktuelle Device dev.off(DEVICENUMMER) Schließt das Device mit der DEVICENUMMER
  • 6. Checkpoint ● Devices werden so benötigt, wie ein Papier zum Zeichnen => Wir plotten unsere Grafiken auf/in Devices
  • 7. High-/Low-Level Funktionen ● High-Level-Funktionen erstellen eigenständig komplette Diagramme ● Low-Level-Funktionen fügen bestimmte Elemente einem bestehenden Diagramm hinzu (Legende, Texte, Linien, Polygone, ..)
  • 8. plot()-Funktion ● Erstellt Streu- bzw. Liniendiagramme plot(x=xVektor, y=yVektor type=“Optionen“, main=“Titel“, sub=“Untertitel“) Wert für type Beschreibung p Punkte l Durchgehende Linien b Punkte und Linien getrennt o Punkte und Linien überlappend h Senkrechte Linien zu jedem Datenpunkt n Fügt dem Diagramm keine Datenpunkte hinzu (No Plotting)
  • 9. Weitere plot()-Argumente Argumente Beschreibung col=“Farbe“ Farbe(Angabe in Englisch) der Datenpunkte cex=WERT Vergrößerungsfaktor für die Datenpunkt- Symbole, Standard ist 1 lwd=WERT Linienstärke, auch bei Datenpunktsymbolen, Standard ist 1 pch=WERT Art der Datenpunk-Symbole, entweder Buchstaben oder siehe ?points lty=“Schlüsselwort“ Linientyp: solid, dashed, longdash, twodash, dotdash, dotted, ylim = c(minY, maxY) Länge der Y-Achse yaxt = “n“ Y-Achse ausschalten ylab='Labeltext' Y-Achse benennen axes = FALSE Achsen ausschalten *y-Argumente natürlich auch mit x-Argumenten
  • 10. Elemente einem bestehenden Diagramm hinzufügen (Low-Level-Funktionen) Befehl Beschreibung points() z.B. points(x=c(1,2),y=c(3,1)) Punkte hinzufügen lines() z.B. lines(x=c(1,2,3),y=c(2,3,1),col='red') Linien hinzufügen polygon() z.B. polygon(x=c(1,2),y=c(4,1)) Polygone hinzufügen title() z.B. title(main=“Titel“,sub=“Untertitel“) Titel hinzfügen legend() z.B. legend(x=10,y=11,legend=“text“) z.B legend(x=“topleft“,legend=“bla“) Legende hinzufügen text() z.B text(x=2.1,y=4,labels=“bli bla blub“) Text hinzufügen axis() z.B. x-Achse: axis(side=1,at=seq(0,10,2)) z.B. y-Achse: axis(side=2,at=seq(0,10,2)) Achsen hinzufügen
  • 11. Mehrere Diagramme in ein Device ● Man kann mit dem Befehl par(mfrow=c(ZEILEN,SPALTEN)) ein Device aufteilen und dann pro Zelle einmal plotten
  • 12. Mehrere Datenreihen in ein Diagramm ● So wie durch plot() ein Streudiagramm einer einzelnen Datenreihe erstellt wird, erstellt matplot() ein Streudiagramm für mehrere Datenreihen gleichzeitig. Xmat ← cbind(1:11,5:15) #Datenreihe1 in Spalte 1, Datenreihe 2 in Spalte 2.. yMat ← cbind(sin(1:11),cos(5:15)) #Datenreihe1 in Spalte1, Datenreihe 2 in.. matplot(x = Xmat, y = yMat, type='l')