
Recomendados
Recomendados
Mais conteúdo relacionado
Mais de International Food Policy Research Institute
Mais de International Food Policy Research Institute (20)
Último
Último (20)
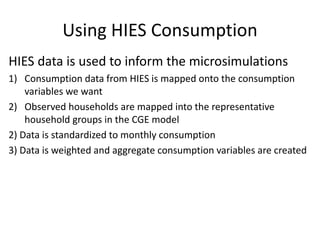
HIES Consumption Data Mapping for CGE Microsimulation Model
- 1. Using HIES Consumption HIES data is used to inform the microsimulations 1) Consumption data from HIES is mapped onto the consumption variables we want 2) Observed households are mapped into the representative household groups in the CGE model 2) Data is standardized to monthly consumption 3) Data is weighted and aggregate consumption variables are created
- 2. SAM HIES Consumption Items Wheat = Wheat and Wheat flour + Bread, Bun, Sheermal + Tandoori Roti, Nan, Kulcha, Puri, Paratha Fruit and Vegetables = Banana + Citrus fruits + Apple + Dates + Grapes + Mango + Other Fresh Fruits + Canned Fruits + Potato + Onion + Tomato + Cabbage, Cauliflower + Karaila, Lady finger, Brinjal, Cucumber + Tinda, Pumpkin, Bottle Gourd + Radish, Turnip, Carrot + Peas, Moongra + Other ( Green Chillies, Tural, Lettuce, Kulfa etc. ) + Canned vegetables Livestock = Milk (fresh & boiled) + Milk (packed by milk plants) + Milk, Powdered (for adults & children ) + Beef + Mutton Poultry = Chicken meat / Other poultry birds + Eggs Fishing = Fish / Prawns, Shrimps, Crabs Vegetable oil = Desi Ghee + Vegetable Ghee + Cooking oils, other oils and fats Sugar = Sugar (desi or milled) Cotton Cloth = Purchase of cloth(for pillow covers, bed sheets quilts etc.) & Purchase of cotton (for quilts, pillows, etc.) Knitware = New ready-made & second hand garments/under garments (for males, females & children), Sweaters, Garments = Woolen cloth (suits, trousers, coats, etc.), Cotton cloth ( shirts, shalwar, etc.), Mixed(nylon ) + Wool for sweaters, socks, shawls, gloves etc. + Burka, Chadar, Ajrak + Tailoring, embroidery, alterations etc. charges ,Clothing supplies(threads, needles, pins, buttons Textile = Readymade pillow covers, bed sheets, blankets, curtains, mosquito nets etc. + Carding and other stitching charges on household textile Leather = Footwear made of leather, synthetic or any other material (all types new or second hand) + Repair charges of footwear, Polishes, shoe shining and cleaning brushes etc. + Brief cases, hand bags, watch straps, belts etc. (leather or plastic) Petroleum = Petrol/ Diesel charges, lubricants & oils, punctures Rail = Expenses on travelling by train
- 3. Road Transport = Expenses on travelling by road (bus, taxi, rickshaw etc.) + Other travelling charges like tongas, camels, donkeys, ferries, bicycles, Garage + Other expenses on tyre, tube, spare parts, repairs of vehicle etc. and service charges + Transport and travelling vehicles (Bicycle, Motorcycle, Scooter, Car, horses, camels, tongas etc.) Construction = Minor repairs/maintenance & redecoration/addition/alteration Other Manufacturing = Personal durable effects (Wrist / pocket watches, sun glasses, etc. ) + Metal furniture/ cots etc + Plastic furniture/cots etc + Floor coverings ( hand / machine made ), carpets, rugs etc. + Electric/ oil fans (table, pedestal, ceiling, exhaust), Air conditioners, Air coolers, Refrigerators, Freezers etc. + Sewing machine, knitting machine (electric / hand) + Other(trunks, suitcase etc.), Wall / table clock, water pipes (rubber, nylon, plastic), thermos bottle etc. Air Transport = Expenditure on by Air Travel Rent Housing = House rent (Market value) + Subsidized house rent (Hiring, Self-hiring) (Market value) + Summer cottage rent Own Housing = Rent free accommodation (Market value) + Owner occupied accommodation(Market value) Education = School/college fees and private tuition fees + Books and exercise note books / copies, stationary etc. + Hostel expenses + Stationery supplies such as pen, pencils, stapling machine, pin etc. Health = Medical fees paid to doctors, specialists, hakeem / midwives outside hospital, including medicine etc. Hospitalization charges, including fee etc. for doctor / hakeem etc.and laboratory tests, x-Ray charges Dental care, teeth cleaning, extraction, charges, eye glasses and all others, not elsewhere.classified Chemicals = Purchase of medicines & vitamins, medical apparatus, and other equipment / supplies etc. Rice = Rice and rice flour Other Crops = Maize, Barley, Jawar and Millet (Whole and Flour ) + Suji, Maida, Besan + Gram Whole ( Black and White) + Dal chana + Mash + Moong + Masoor + Other ( Arhar, chick / pigeon /garden peas, sunflower, soybean )
- 4. Other Food = Other cereals products (Vermicellies, Corn flakes, Noodles, Macronis, Spageite) + Biscuits ( Sweet & Saltish ) + Other baked or fried products (Pakoras, Samosa, Qatlama, popcorn etc.) Cake + Jams, Marmalades/ Tomato Ketchup/pulp/ Pudding, Jelly, Pickles, Chatni, Vinegar + Food and Grain milling/grinding charges + Sugarcane juices, Other fresh juices, Fruit juices (packed), Mineral water etc Taxes = Fines, birth/marriage taxes and pet keeping taxes etc. Passport/Visa, Other cesses & taxes + House and property tax Wood = Fire wood Energy = Kerosene oil + Char coal + Coal hard & soft peat + Dung cake (dry) + Gas (pipe), (Gas (cylinder) + Electricity + Beggasses, Agricultural wastes for fuel purposes Personal Services = Hair cutting & dressing etc. for men(include shaving material), women and children + Beauty parlour services + Dry cleaning, washing, dying, darning Other Private Services = Wages & salaries paid to servants, gardeners, sweepers, chowkidars, aya + Legal expenses (not related to business) + Insurance premium such as fire, accident and travel insurance (exclude life / housing/vehicle insurance)
- 5. • The data is generated for every household of the HIES survey. Every household is a single row in the dataset, and variables are across the columns: hhcode RHG SIZE ADEQ WEIGHT C-WHTF C-CHEM … TOTAL-CONS TOTAL-INCOME 10011100101 H-UOQ 9 7.627234 82.58048 1900 166.6667 401022 816000 10011100102 H-UOQ 7 5.529362 82.58048 1840 166.6667 267352 888000 10011100103 H-UOQ 6 5.935319 82.58048 750 125 236528 300000 10011100104 H-UOQ 8 7.234043 82.58048 900 166.6667 228505 672000 10011100105 H-UQ2 6 5.16766 82.58048 50 66.66666 179624 384000 10011100106 H-UQ1 5 4.762553 82.58048 915 166.6667 157606 240000
- 6. Generating the Poverty Line • Official poverty line was estimated for year 2000-01 • Poverty line was ‘updated’ till year 2005-06 by adjusting the poverty line by the inflation rate • Poverty figures have not been published for 2007-08 and later years due to technical issues in estimation • One of the criticisms of the updated poverty lines is that they are based on inflation rates that underestimates the real inflation in Pakistan
- 7. • Our estimated poverty line for 2010-11 is based on the official poverty line estimated for 2000-01 (Rs748.565 per adult equivalent) • We find the government inflation rates from PBS for different consumption groups: 1) Food, beverages & tobacco, 2) Apparel, Textile & Footwear, 3) House Rent, 4) Energy, 5) Household Furniture, Equipment etc, 6) Transport & Communication, 7) Recreation, Entertainment, 8) Education, 9) Cleaning, Laundry & Personal Appearance, 10) Medicare
- 8. • We calculate the composition of expenditure for these 10 consumption groups for the quintile with lowest adult equivalent expenditure • We multiply the inflation of the consumption group with its share in expenditure, and add them for all consumption groups to calculate the inflation affecting the poor • This suggests that the inflation between 2000-01 and 2010-11 is 165.69%. The official government inflation rate 144.26% • We use our inflation measure to update the 2000-01 poverty line to year 2010-11. The poverty line for 2010-11 is Rs. 1988.86
- 9. Microsimulation of consumption values Update using the simulated percent changes in consumed quantities (from CGE model) at original prices of associated RHG: CSIMV(C,HO,SIMCUR) = *Original consumption value of the sampled household CSIMV(C,HO,'BASE') * *Simulated consumption value QHX(C,H,SIMCUR) / *Base consumption value QHX(C,H,'BASE') • H: representative household group to which observed household HO belongs.
- 10. Foster-Greer-Thorbecke poverty measures α α ∑= − = M i i z yz N P 1 )(1 P0 = Poverty Headcount Ratio (HCR) P1 = Poverty Gap Ratio P2 = Squared Poverty Gap Ratio where z is the poverty line yi is the income (or consumption) of person i N is the number of individuals in the population, M (k in the Lecture Note) is the number of poor people
- 11. Microsimulation of FGT poverty measures POVTAB(G,SIMCUR,FGT) = 100/NI(G) * SUM(HO$HPOOR(HO,SIMCUR), GOI(HO,G) *H0V0(HO,'SIZE') *H0V0(HO,'WEIGHT') *(( PLADEQ - WELFHO(HO,SIMCUR))/PLADEQ) **(FGTP(FGT))) , where G is group of interest (national, urban, rural), FGT and FGTP is α, NI nr of individuals, HPOOR poverty dummy, GOI identified sampled households belong to group G, size is household size, weight is nr of households represented by observed one, PLADEQ is poverty line per adult equivalent, WELFHO is consumption per adult equivalent.