Washington D.C. Area Market Conditions Report
•
0 gostou•185 visualizações

Washington D.C Metropolitan Area Market Conditions

Recomendados
Recomendados
Mais conteúdo relacionado
Último
Último (20)
Destaque
Destaque (20)
Washington D.C. Area Market Conditions Report
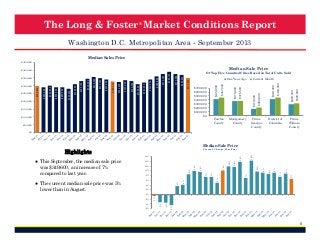
- 1. The Long & Foster ® Market Conditions Report Washington D.C. Metropolitan Area - September 2013 Median Sales Price $450,000 Median Sale Price $150,000 $100,000 Fairfax County $50,000 Montgomery County Prince George's County District of Columbia $309,900 $290,000 $460,000 $202,000 $419,000 Current Month $170,000 $375,500 $370,000 $700,000 $600,000 $500,000 $400,000 $300,000 $200,000 $100,000 $0 $457,500 One Year Ago $422,000 $349,600 $369,900 Of Top Five Counties/Cities Based on Total Units Sold $375,000 $389,135 $375,000 $360,000 $340,000 $320,000 $330,000 $310,000 $335,000 $324,200 $328,000 $340,000 $349,000 $345,000 $329,700 $310,000 $289,900 $290,000 $280,000 $200,000 $290,000 $250,000 $298,000 $300,000 $300,000 $350,000 $356,500 $400,000 Prince William County $0 Median Sale Price 4% 4% 9% 7% 7% 9% 9% 9% 10% 12% 12% 7% 7% 5% 6% 4% 8% 10% 8% 10% 7% 10% 12% 10% 14% 2% 0% -5% -6% -4% -4% -3% -2% -1% ● The current median sale price was 5% lower than in August. 14% 16% ● This September, the median sale price was $349,600, an increase of 7% compared to last year. 14% Percent Change Year/Year Highlights 6
- 2. The Long & Foster ® Market Conditions Report Washington D.C. Metropolitan Area - September 2013 Total Units Sold 9,000 515 515 600 569 523 800 639 767 5,731 5,743 1,000 Current Month 694 1,121 One Year Ago 877 6,503 1,200 1,037 7,396 7,879 7,884 Of Top Five Counties/Cities Based on Total Units Sold 400 4,355 4,200 5,390 5,862 5,338 5,357 6,657 6,609 5,901 5,329 4,230 5,087 3,821 3,000 4,683 4,000 4,614 5,000 5,114 6,000 7,380 6,968 7,000 8,235 Total Units Sold 8,000 200 0 Fairfax County 2,000 Montgomery County Prince George's County District of Columbia Prince William County 1,000 0 Total Units Sold Percent Change Year/Year 7% 11% 13% 10% 3% 8% 10% 6% 12% 19% 25% 16% 8% 5% 2% 10% 6% 13% 20% 4% ● This month's total units sold was higher than at this time last year, an increase of 7% versus September 2012. 30% 4% Highlights -5% -1% -1% -4% -10% -3% ● There was a decrease of 23% in total units sold in September compared to August. -4% 0% -20% -30% 7
- 3. The Long & Foster ® Market Conditions Report Washington D.C. Metropolitan Area - September 2013 Total Units Sold by Type Detached Attached Total Units Sold by Type Condo Current Month 9,000 Detached Attached Condo 8,000 7,000 887 15% 6,000 5,000 4,000 3,000 3,092 54% 1,752 31% 2,000 1,000 0 Total Units Sold by Price Range < 150K 2,500 150K to < 300K 300K to < 450K 450K to < 600K 600K and up Total Units Sold by Price Range Current Month < 150K 450K to < 600K 150K to < 300K 600K and up 300K to < 450K 2,000 1,025 18% 1,500 1,000 465 8% 1,783 31% 832 15% 500 0 1,626 28% 8
- 4. The Long & Foster ® Market Conditions Report Washington D.C. Metropolitan Area - September 2013 Total Active Inventory Total Active Inventory 30,000 10,000 Montgomery County 5,000 District of Columbia 1,421 1,296 1,678 Prince George's County 1,449 3,010 Current Month 2,005 2,712 Fairfax County 2,657 2,964 7,000 6,000 5,000 4,000 3,000 2,000 1,000 0 2,949 18,721 18,765 19,036 19,125 18,991 17,310 15,659 14,859 14,629 15,010 16,902 18,435 19,408 20,578 19,271 15,000 21,916 22,273 22,540 21,715 20,359 20,361 21,336 26,554 One Year Ago 24,342 20,000 27,972 25,000 Of Top Five Counties/Cities Based on Total Units Sold Prince William County 0 Total Active Inventory Percent Change Year/Year Highlights -3% -7% -13% -15% -23% -28% -27% -28% -30% -31% -31% -31% -25% -23% -22% -24% -27% -30% -35% -23% -30% -24% -25% -17% -20% -23% -15% -11% -10% -15% ● Versus September 2012, the total number of homes available was lower by 687 units or 4%. -5% -4% 0% ● This month's supply of available inventory remained relatively stable compared to last month. -40% -45% 9
- 5. The Long & Foster ® Market Conditions Report Washington D.C. Metropolitan Area - September 2013 Total Active Inventory by Type Total Active Inventory by Type Detached Attached Condo Current Month Detached 30,000 Attached Condo 25,000 2,213 12% 20,000 3,770 20% 15,000 10,000 12,738 68% 5,000 0 Total Active Inventory by Price Range < 150K 30,000 150K to < 300K 300K to < 450K 450K to < 600K 600K and up Total Active Inventory by Price Range Current Month < 150K 450K to < 600K 150K to < 300K 600K and up 300K to < 450K 25,000 20,000 15,000 5,012 27% 1,188 6% 4,993 27% 10,000 5,000 0 2,865 15% 4,663 25% 10
- 6. The Long & Foster ® Market Conditions Report Washington D.C. Metropolitan Area - September 2013 Sale Price as % of List Price Average Sale Price as a Percent of List Price Of Top Five Counties/Cities Based on Total Units Sold 99.0% 98.9% 98.7% 98.0% 99.8% 98.3% 98.2% 97.7% 97.7% 98.5% 98.0% 98.2% 98.9% 98.9% 98.2% 98.3% 99.0% Current Month 97.0% 97.8% 98.0% 98.0% 98.0% 98.0% 98.2% 98.1% 97.8% 97.6% 100.0% 96.0% Fairfax County 97.1% 97.1% 97.4% 97.5% 97.0% 97.5% 97.5% 97.6% 98.1% 98.0% 98.2% 98.5% One Year Ago 99.3% 99.0% 99.0% 99.1% 99.5% Montgomery County Prince George's County District of Columbia Prince William County 96.5% Days on Market Current One Year Month Ago 96.0% 95.5% 37 Avg Sale Price as % of List Price Current One Year Month Ago 53 Down -30% Vs. Year Ago Days on Market 75 70 65 60 55 50 64 63 65 35 30 Up 0.5% Vs. Year Ago by Price Range 65 101% < 150K 150K to < 300K 300K to < 450K 450K to < 600K 600K and up 100% 58 53 49 48 49 50 54 51 48 56 99% 53 98% 48 97% 45 40 98.0% Average Sale Price as a Percent of List Price 70 70 67 98.5% 96% 39 35 33 30 35 37 95% 94% 93% 11
- 7. The Long & Foster ® Market Conditions Report Washington D.C. Metropolitan Area - September 2013 Total Dollar Volume Sold In Thousands Highlights $4,500,000 ● Total volume sold this September was 15% greater than the same month one year ago. $2,441,131 $3,231,703 $3,811,505 $3,555,552 $2,764,204 $2,377,166 $1,668,094 $1,582,899 $2,239,550 $2,389,163 $2,042,982 $2,115,237 $2,717,039 $2,786,362 $2,314,433 $1,468,903 $500,000 $1,366,312 $1,859,161 $1,719,430 $1,000,000 $1,637,762 $1,500,000 $1,900,169 $2,000,000 $2,016,643 $2,500,000 $2,908,485 $3,000,000 $3,117,097 $3,500,000 $3,562,061 $4,000,000 ● In September, there was 3.3 months of supply available, compared to 3.6 in September 2012. That was a decrease of 10% versus a year ago. $0 Months of Supply Current Month's Active Inventory/Current Month's Unit Sales Total Dollar Volume Sold Current One Year Month Ago 7 5.3 5.8 $2,441,131,213 2.5 2.4 2.3 2.4 2.7 3.3 3.4 3.5 2.8 2.9 3.5 3.6 2.9 3.1 4.1 3.8 3.0 2.7 2 3.2 3 4.2 4 $2,115,237,390 Up 15% Vs. Year Ago 4.8 5.2 5 5.5 6 Months of Supply Current One Year Month Ago 3.3 3.6 1 Down -10% Vs. Year Ago 0 12
- 8. The Long & Foster ® Market Conditions Report Washington D.C. Metropolitan Area - September 2013 New Listings New Listings & New Contracts Montgomery County Prince George's County District of Columbia 742 605 1,094 982 930 Current Month 926 1,480 1,111 1,709 Fairfax County 9,174 One Year Ago Prince William County New Contracts 500 0 576 467 702 601 909 Current Month 653 1,000 813 1,500 1,091 2,000 950 One Year Ago 2,500 984 6,306 6,483 Of Top Five Counties/Cities Based on Total Units Sold 7,049 7,435 8,251 7,108 8,872 9,505 9,427 9,820 11,561 11,421 2,000 1,500 1,000 500 0 7,375 5,684 6,573 4,200 5,149 4,793 5,684 5,290 5,784 5,907 5,649 7,382 7,940 7,733 7,566 8,778 6,403 9,529 7,011 7,156 7,094 7,845 6,958 4,511 5,642 4,091 2,000 4,878 4,480 5,075 4,000 4,622 6,000 3,981 5,871 8,000 7,283 10,000 8,232 12,000 9,894 10,752 14,000 1,519 New Contracts (Under Active Contract Status) 7,928 New Listings Of Top Five Counties/Cities Based on Total Units Sold 0 Fairfax County New Listings Current One Year Month Ago 9,174 7,940 Up 16% Vs. Year Ago New Contracts Current One Year Month Ago 6,306 5,290 Up 19% Vs. Year Ago Highlights ● Based on this month's amount of new listings and new contracts, the ratio of home supply (new listings) to current home demand (new contracts) was 1.5, similar to the ratio from one year ago. Montgomery County Prince George's County District of Columbia Prince William County Supply/Demand Ratio Number of New Listings to New Contracts 2.0 1.8 1.6 1.4 1.2 1.8 1.4 1.4 1.4 1.3 1.1 1.5 1.5 1.4 1.4 1.4 1.3 1.3 1.3 1.3 1.3 1.3 1.2 1.4 1.5 1.3 1.3 1.4 1.5 1.0 1.0 0.8 0.6 0.4 0.2 0.0 13