SlideShare uma empresa Scribd logo
1 de 8
Baixar para ler offline
The Long & Foster ® Market Conditions Report
Baltimore Metropolitan Area - September 2013
Median Sales Price
$300,000

Current Month

$200,000

$229,000

$130,000

$299,550

$115,000

$300,000
$100,000

$289,950

$400,000

$215,000

$210,000

$500,000

$150,000

$370,000

$600,000

$226,500

One Year Ago

$375,000

$248,500

$250,501

$265,000

$260,000

$250,000

$240,000

$229,200

$215,000

$213,000

$235,000

$230,000

$230,000

$236,000

$240,000

$250,000

$240,000

$237,926

$217,900

$210,000

$210,000

$219,900

$225,000

$219,000

$200,000

$227,500

$250,000

$250,000

Median Sale Price
Of Top Five Counties/Cities Based on Total Units Sold

$100,000
$50,000

$0
Baltimore Anne Arundel Baltimore
County
County
City

$0

Howard
County

Harford
County

Median Sale Price
Percent Change Year/Year

-2%

-2%

5%

4%

6%
4%

1%

2%

4%

5%

7%

2%

5%

0%

0%

1%

0%

2%

-6%

11%
2%

4%

4%

6%

-4%

9%
6%

8%

10%

9%

10%

-2%

● The current median sale price was 5%
higher than the same month last year.

12%

-8%
-10%
-12%

-9%

● This September, the current median
sale price of $248,500 was similar to
the median sale price of last month.

14%

-3%

Highlights

-14%

14
The Long & Foster ® Market Conditions Report
Baltimore Metropolitan Area - September 2013
Total Units Sold

1,000

500

238

203

283

400

275

473

444

490

2,088

Current Month

588

One Year Ago

709

800

579

2,441

2,493

2,967

2,926

Total Units Sold
Of Top Five Counties/Cities Based on Total Units
Sold

1,565

1,642

2,066

2,237

2,071

2,551

2,465

2,195

2,134

2,028
1,561

1,426

1,856

1,769

1,712

0
Baltimore Anne Arundel Baltimore
County
County
City

0

Howard
County

Harford
County

Total Units Sold
26%

16%

3%

16%

14%

15%
9%

11%

0%

0%

1%
-1%

0%

7%

7%

12%
7%
4%

6%

10%

● There was a decrease of 16% in total
units sold in September compared to
August.

20%

21%
17%

20%

6%

● This month's total units sold was
higher than at this time last year, an
increase of 14% versus September 2012.

30%

-3%

Highlights

28%

Percent Change Year/Year

14%

1,500

2,005

2,000

2,516

2,500

2,718

3,000

3,156

3,266

3,500

-10%

15
The Long & Foster ® Market Conditions Report
Baltimore Metropolitan Area - September 2013
Total Units Sold by Type
Detached

Attached

Total Units Sold by Type
Current Month

Condo

3,500

Detached

Attached

Condo

3,000

177
7%

2,500
2,000
1,500

953
38%

1,000

1,363
55%

500
0

Total Units Sold by Price Range

Total Units Sold by Price Range
< 150K

1,400

150K to < 300K

300K to < 450K

450K to < 600K

Current Month
600K and up

< 150K
450K to < 600K

1,200

220
9%

1,000

150K to < 300K
600K and up

150
6%

300K to < 450K

539
22%

800
600

553
22%

400
200

1,031
41%

0

16
The Long & Foster ® Market Conditions Report
Baltimore Metropolitan Area - September 2013
Total Active Inventory
20,000

Total Active Inventory
Current Month

1,414

1,281

1,160

2,000

8,000

1,055

3,418

3,222

2,843

3,000

2,763

4,000

3,227

5,000

3,012

13,066

12,832

6,000

13,315

13,462

13,339

12,796

11,784

11,338

11,150

11,319

10,000

12,340

13,181

13,543

13,704

14,239

14,703

14,863

14,832

14,207

13,727

13,815

One Year Ago
14,414

12,000

16,029

14,000

Of Top Five Counties/Cities Based on Total Units Sold

17,320

16,000

17,942

18,000

1,000

6,000

0
Baltimore
County

4,000

Anne
Arundel
County

2,000

Baltimore
City

Howard
County

Harford
County

0

Total Active Inventory
Percent Change Year/Year

-5%

-5%

-6%

-8%

-10%

-14%

-17%

-17%

-19%

-21%

-23%

-24%

-25%

-24%

-23%

-21%

-22%

-25%

-30%

-22%

-25%

-23%

-20%

-23%

-15%

-15%

-10%

-23%

● Versus last September, the total
number of homes available was lower
by 711 units or 5%.

-5%

-18%

● September's total active inventory of
12,832 units was 2% lower than the
previous month's supply of inventory.

0%

-14%

Highlights

-35%

17
The Long & Foster ® Market Conditions Report
Baltimore Metropolitan Area - September 2013
Total Active Inventory by Type
Detached

Attached

Total Active Inventory by
Type

Condo

Current Month

20,000

Detached

Attached

Condo

18,000
16,000

833
7%

14,000
12,000
10,000

4,246
33%

8,000

7,753
60%

6,000
4,000

2,000
0

Total Active Inventory by Price Range
< 150K

20,000
18,000

150K to < 300K

300K to < 450K

450K to < 600K

600K and up

Total Active Inventory by
Price Range
Current Month

< 150K
450K to < 600K

150K to < 300K
600K and up

300K to < 450K

16,000

1,786
14%

14,000
12,000
10,000
8,000
6,000
4,000

2,000

1,434
11%
2,368
18%

3,176
25%

4,068
32%

0

18
The Long & Foster ® Market Conditions Report
Baltimore Metropolitan Area - September 2013
Sale Price as % of List Price

Average Sale Price as a Percent of List Price

Of Top Five Counties/Cities Based on Total Units
Sold

Baltimore
County

Days on Market
Current One Year
Month
Ago

94.0%

93.5%

58

Anne
Arundel
County

97
95

100%
98

77

97.6%

97.0%

98.0%

97.1%

97.3%

96.2%

Up 1.1% Vs. Year Ago

< 150K

150K to < 300K

300K to < 450K

450K to < 600K

600K and up

98%

94 94

96%

87

85
85

Harford
County

by Price Range

105
100 100 99

Howard
County

Average Sale Price as a Percent of List Price

Days on Market

105

Baltimore
City

Avg Sale Price as % of List Price
Current
One Year
Month
Ago

Down -25% Vs. Year
Ago

115

Current Month

97.1%

97.2%

96.3%

97.0%

100.0%
99.0%
98.0%
97.0%
96.0%
95.0%
94.0%
93.0%

95.5%

97.5%

97.8%

97.6%

97.3%

96.8%

96.9%

96.5%

96.7%

96.8%

96.8%

96.2%

96.7%

One Year Ago

95.5%

95.8%
95.1%

94.5%

95.5%

95.3%

95.6%

95.0%

95.6%

95.5%

95.6%

96.0%

96.4%

96.4%

96.5%

96.8%

97.0%

97.1%

97.5%

97.6%

98.0%

96.3%

98.5%

78 77 78 77 78 79

81 81

82

94%
75

92%

75

90%
65
55

60

58 57 58 58

88%
86%

19
The Long & Foster ® Market Conditions Report
Baltimore Metropolitan Area - September 2013
Highlights

Total Dollar Volume Sold
In Thousands
$1,200,000

● Total volume sold this September was
15% greater than the same month one
year ago.
$719,257

$868,644

$983,028

$986,686

$871,868

$692,507

$556,709

$391,588

$409,096

$579,587

$610,219

$554,957

$624,351

$724,948

$729,549

$702,631

$512,851

$380,189

$494,423

$464,704

$365,176

$200,000

$437,511

$400,000

$547,438

$600,000

$610,833

$800,000

$822,470

$1,000,000

● In September, there was 5.2 months of
supply available, compared to 6.2 in
September 2012. That was a decrease
of 17% versus a year ago.

$0

Months of Supply

Total Dollar Volume Sold
Current
One Year
Month
Ago

Current Month's Active Inventory/Current Month's Unit Sales
12

$719,256,938
9.7

2

4.4

4.2

4.1

5.2

5.2

5.6

6.8
5.5

5.5

6.4

6.2
5.4

5.8

7.2

4.6

4

5.4

5.9

7.0

7.0

7.8
6

$624,350,703

Up 15% Vs. Year Ago

8.8

9.1

9.0

8

10.1

10

Months of Supply
Current
One Year
Month
Ago
5.2

6.2

Down -17% Vs. Year Ago

0

20
The Long & Foster ® Market Conditions Report
Baltimore Metropolitan Area - September 2013
New Listings

New Listings & New Contracts

3,335

Up 21% Vs. Year Ago

New Contracts
Current One Year
Month
Ago
2,651

2,041

354

326

440

346

786

991

Harford
County

Anne
Arundel
County

Baltimore
City

Howard
County

244

169

285

227

591

Current Month

433

603

478

One Year Ago

720

1,200
1,000
800
600
400
200
0

542

2,651

2,787

2,894

2,937

3,200

Howard
County

Harford
County

Supply/Demand Ratio

Highlights
● Based on this month's amount of new
listings and new contracts, the ratio of
home supply (new listings) to current
home demand (new contracts) was 1.5,
a decrease of 7% from September 2012.

Baltimore
City

New Contracts

2,123

2,835

Anne
Arundel
County

Baltimore
County

4,046

Current Month

Of Top Five Counties/Cities Based on Total Units Sold

0

New Listings
Current One Year
Month
Ago

899

733

1,038

870

Baltimore
County

4,046

4,202

4,348

4,423

4,960

4,292

1,200
1,000
800
600
400
200
0

One Year Ago

3,291

3,137
1,980

1,536

1,864

2,202

1,905

2,627

3,290

3,335
2,041

3,610
2,376

3,594
2,417

3,892
2,456

4,129
2,614

2,550

3,361
2,090

1,776

1,889
1,434

1,754

1,895

1,723

2,000

2,652

2,562

3,000

1,000

2,950

3,355

3,351

5,000

4,323

4,425

5,123

6,000

4,000

Of Top Five Counties/Cities Based on Total Units Sold

New Contracts (Under Active Contract Status)

3,261

New Listings

Number of New Listings to New Contracts
2.5

2.0

1.5

1.9
1.8
1.5

1.7 1.6 1.7 1.7
1.6 1.6
1.3

1.5 1.5

1.6

1.5

1.6
1.6 1.6
1.5 1.5 1.5 1.5 1.5
1.5

1.4
1.2

1.0

0.5

Up 30% Vs. Year Ago
0.0

21

Mais conteúdo relacionado

Mais procurados

2014 Q3 Nest Report
2014 Q3 Nest Report2014 Q3 Nest Report
2014 Q3 Nest ReportJeremy Hart
 
Economic Report August 15 2015
Economic Report August 15 2015Economic Report August 15 2015
Economic Report August 15 2015Dale Koeller
 
2013 Real Estate Report for the New River Valley
2013 Real Estate Report for the New River Valley2013 Real Estate Report for the New River Valley
2013 Real Estate Report for the New River ValleyJeremy Hart
 
Q1 2015 New River Valley real estate Nest Report
Q1 2015 New River Valley real estate Nest ReportQ1 2015 New River Valley real estate Nest Report
Q1 2015 New River Valley real estate Nest ReportJeremy Hart
 
2014 Q2 New River Valley Real Estate Market
2014 Q2 New River Valley Real Estate Market2014 Q2 New River Valley Real Estate Market
2014 Q2 New River Valley Real Estate MarketJeremy Hart
 
Q2 2015 New River Valley Nest Report
Q2 2015 New River Valley Nest ReportQ2 2015 New River Valley Nest Report
Q2 2015 New River Valley Nest ReportJeremy Hart
 
Hexter Fair Economic Forecast 021909 Allen
Hexter Fair Economic Forecast 021909 AllenHexter Fair Economic Forecast 021909 Allen
Hexter Fair Economic Forecast 021909 AllenSheriStinson
 
Q2 2013 nest market report
Q2 2013 nest market reportQ2 2013 nest market report
Q2 2013 nest market reportJeremy Hart
 
River Oaks Subdivsion Baton Rouge Home Sales 2012 to 2015 Zip Code 70819
River Oaks Subdivsion Baton Rouge Home Sales 2012 to 2015 Zip Code 70819River Oaks Subdivsion Baton Rouge Home Sales 2012 to 2015 Zip Code 70819
River Oaks Subdivsion Baton Rouge Home Sales 2012 to 2015 Zip Code 70819Bill Cobb, Appraiser
 
Financial forecast diazcales-2
Financial forecast diazcales-2Financial forecast diazcales-2
Financial forecast diazcales-2GerardoDiaz90
 
Oak Hills Estates Subdivision Denham Springs Home Sales 2005 to 2015 YTD 70706
Oak Hills Estates Subdivision Denham Springs Home Sales 2005 to 2015 YTD 70706Oak Hills Estates Subdivision Denham Springs Home Sales 2005 to 2015 YTD 70706
Oak Hills Estates Subdivision Denham Springs Home Sales 2005 to 2015 YTD 70706Bill Cobb, Appraiser
 
2020 Feb Calgary Market Stats
2020 Feb Calgary Market Stats2020 Feb Calgary Market Stats
2020 Feb Calgary Market StatsJerry Charlton
 
Canada Beer Industry
Canada Beer IndustryCanada Beer Industry
Canada Beer IndustryAnkur Napa
 
Rothco By The Numbers - 2014
Rothco By The Numbers - 2014Rothco By The Numbers - 2014
Rothco By The Numbers - 2014Rothco Sales
 
gov revenue formsandresources forms WIT-2_rev_09-07
gov revenue formsandresources forms WIT-2_rev_09-07gov revenue formsandresources forms WIT-2_rev_09-07
gov revenue formsandresources forms WIT-2_rev_09-07taxman taxman
 
gov revenue formsandresources forms BET-2_rev_09-07
gov revenue formsandresources forms BET-2_rev_09-07gov revenue formsandresources forms BET-2_rev_09-07
gov revenue formsandresources forms BET-2_rev_09-07taxman taxman
 

Mais procurados (20)

2014 Q3 Nest Report
2014 Q3 Nest Report2014 Q3 Nest Report
2014 Q3 Nest Report
 
Metro Vancouver report
Metro Vancouver reportMetro Vancouver report
Metro Vancouver report
 
Q1 2013 market report
Q1 2013 market reportQ1 2013 market report
Q1 2013 market report
 
Economic Report August 15 2015
Economic Report August 15 2015Economic Report August 15 2015
Economic Report August 15 2015
 
2013 Real Estate Report for the New River Valley
2013 Real Estate Report for the New River Valley2013 Real Estate Report for the New River Valley
2013 Real Estate Report for the New River Valley
 
Q1 2015 New River Valley real estate Nest Report
Q1 2015 New River Valley real estate Nest ReportQ1 2015 New River Valley real estate Nest Report
Q1 2015 New River Valley real estate Nest Report
 
2014 Q2 New River Valley Real Estate Market
2014 Q2 New River Valley Real Estate Market2014 Q2 New River Valley Real Estate Market
2014 Q2 New River Valley Real Estate Market
 
Market summary october 2011 power point
Market summary october 2011 power pointMarket summary october 2011 power point
Market summary october 2011 power point
 
Q2 2015 New River Valley Nest Report
Q2 2015 New River Valley Nest ReportQ2 2015 New River Valley Nest Report
Q2 2015 New River Valley Nest Report
 
Hexter Fair Economic Forecast 021909 Allen
Hexter Fair Economic Forecast 021909 AllenHexter Fair Economic Forecast 021909 Allen
Hexter Fair Economic Forecast 021909 Allen
 
Q2 2013 nest market report
Q2 2013 nest market reportQ2 2013 nest market report
Q2 2013 nest market report
 
River Oaks Subdivsion Baton Rouge Home Sales 2012 to 2015 Zip Code 70819
River Oaks Subdivsion Baton Rouge Home Sales 2012 to 2015 Zip Code 70819River Oaks Subdivsion Baton Rouge Home Sales 2012 to 2015 Zip Code 70819
River Oaks Subdivsion Baton Rouge Home Sales 2012 to 2015 Zip Code 70819
 
Financial forecast diazcales-2
Financial forecast diazcales-2Financial forecast diazcales-2
Financial forecast diazcales-2
 
Oak Hills Estates Subdivision Denham Springs Home Sales 2005 to 2015 YTD 70706
Oak Hills Estates Subdivision Denham Springs Home Sales 2005 to 2015 YTD 70706Oak Hills Estates Subdivision Denham Springs Home Sales 2005 to 2015 YTD 70706
Oak Hills Estates Subdivision Denham Springs Home Sales 2005 to 2015 YTD 70706
 
2020 Feb Calgary Market Stats
2020 Feb Calgary Market Stats2020 Feb Calgary Market Stats
2020 Feb Calgary Market Stats
 
Marblehead Report
Marblehead ReportMarblehead Report
Marblehead Report
 
Canada Beer Industry
Canada Beer IndustryCanada Beer Industry
Canada Beer Industry
 
Rothco By The Numbers - 2014
Rothco By The Numbers - 2014Rothco By The Numbers - 2014
Rothco By The Numbers - 2014
 
gov revenue formsandresources forms WIT-2_rev_09-07
gov revenue formsandresources forms WIT-2_rev_09-07gov revenue formsandresources forms WIT-2_rev_09-07
gov revenue formsandresources forms WIT-2_rev_09-07
 
gov revenue formsandresources forms BET-2_rev_09-07
gov revenue formsandresources forms BET-2_rev_09-07gov revenue formsandresources forms BET-2_rev_09-07
gov revenue formsandresources forms BET-2_rev_09-07
 

Destaque

Mães diversas
Mães diversasMães diversas
Mães diversasmvaznunes
 
Projeto pais no jardim
Projeto pais no jardimProjeto pais no jardim
Projeto pais no jardimmvaznunes
 
Youth Ideas - Halloween Bible Studies or Sermons
Youth Ideas - Halloween Bible Studies or SermonsYouth Ideas - Halloween Bible Studies or Sermons
Youth Ideas - Halloween Bible Studies or SermonsKen Sapp
 
Power Point Presentation
Power Point PresentationPower Point Presentation
Power Point Presentationandrewtucker
 
Contes i valors - IIIJornada Espurna
Contes i valors - IIIJornada EspurnaContes i valors - IIIJornada Espurna
Contes i valors - IIIJornada Espurnanfont
 
Dans Computer Services Ace Canada 2009 Regional Exhibition Presentation
Dans Computer Services Ace Canada 2009 Regional Exhibition PresentationDans Computer Services Ace Canada 2009 Regional Exhibition Presentation
Dans Computer Services Ace Canada 2009 Regional Exhibition PresentationStarman80
 

Destaque (7)

Unit 7 jcs md
Unit 7 jcs mdUnit 7 jcs md
Unit 7 jcs md
 
Mães diversas
Mães diversasMães diversas
Mães diversas
 
Projeto pais no jardim
Projeto pais no jardimProjeto pais no jardim
Projeto pais no jardim
 
Youth Ideas - Halloween Bible Studies or Sermons
Youth Ideas - Halloween Bible Studies or SermonsYouth Ideas - Halloween Bible Studies or Sermons
Youth Ideas - Halloween Bible Studies or Sermons
 
Power Point Presentation
Power Point PresentationPower Point Presentation
Power Point Presentation
 
Contes i valors - IIIJornada Espurna
Contes i valors - IIIJornada EspurnaContes i valors - IIIJornada Espurna
Contes i valors - IIIJornada Espurna
 
Dans Computer Services Ace Canada 2009 Regional Exhibition Presentation
Dans Computer Services Ace Canada 2009 Regional Exhibition PresentationDans Computer Services Ace Canada 2009 Regional Exhibition Presentation
Dans Computer Services Ace Canada 2009 Regional Exhibition Presentation
 

Semelhante a Baltimore Metropolitan Area Market Conditions

Philadelphia Metropolitan Market Conditions Report
Philadelphia Metropolitan Market Conditions ReportPhiladelphia Metropolitan Market Conditions Report
Philadelphia Metropolitan Market Conditions ReportThe Long & Foster Companies
 
Market Watch TORONTO 2015 SEPTEMBER
Market Watch TORONTO 2015 SEPTEMBERMarket Watch TORONTO 2015 SEPTEMBER
Market Watch TORONTO 2015 SEPTEMBERChaba Tamasi
 
TREB Market Watch - August 2016
TREB Market Watch - August 2016TREB Market Watch - August 2016
TREB Market Watch - August 2016Michelle Makos
 
Toronto Market Watch AUGUST 2016
Toronto Market Watch AUGUST 2016Toronto Market Watch AUGUST 2016
Toronto Market Watch AUGUST 2016Chaba Tamasi
 
Greater Baton Rouge Foreclosure Home Sales Improvement Report Q3 2011 vs Q3 2014
Greater Baton Rouge Foreclosure Home Sales Improvement Report Q3 2011 vs Q3 2014Greater Baton Rouge Foreclosure Home Sales Improvement Report Q3 2011 vs Q3 2014
Greater Baton Rouge Foreclosure Home Sales Improvement Report Q3 2011 vs Q3 2014Bill Cobb, Appraiser
 
The Boulder Group | Q3 2014 Net Lease Research Report2014 q3-net-lease-resear...
The Boulder Group | Q3 2014 Net Lease Research Report2014 q3-net-lease-resear...The Boulder Group | Q3 2014 Net Lease Research Report2014 q3-net-lease-resear...
The Boulder Group | Q3 2014 Net Lease Research Report2014 q3-net-lease-resear...The Boulder Group
 
Financial Forecast
Financial ForecastFinancial Forecast
Financial ForecastMarc Tejeda
 
Market Report for August 2017 - Residential Resale
Market Report for August 2017 - Residential ResaleMarket Report for August 2017 - Residential Resale
Market Report for August 2017 - Residential ResaleMichelle Makos
 
April 2016 Home Sales in Toronto and GTA
April 2016 Home Sales in Toronto and GTAApril 2016 Home Sales in Toronto and GTA
April 2016 Home Sales in Toronto and GTAMichelle Makos
 
October Market Watch is Here !
October Market Watch is Here !October Market Watch is Here !
October Market Watch is Here !Michelle Makos
 
TREB MARKET WATCH 2017
TREB MARKET WATCH 2017TREB MARKET WATCH 2017
TREB MARKET WATCH 2017Michelle Makos
 
July 2015 Home Sales Report
July 2015 Home Sales ReportJuly 2015 Home Sales Report
July 2015 Home Sales ReportPhil Sveum
 
Market Watch - September 2019
Market Watch - September 2019Market Watch - September 2019
Market Watch - September 2019Michelle Makos
 
2015 RCA Industrial Report
2015 RCA Industrial Report2015 RCA Industrial Report
2015 RCA Industrial ReportJustin B. Smith
 
December 2014 Home Sales Report
December 2014 Home Sales ReportDecember 2014 Home Sales Report
December 2014 Home Sales ReportPhil Sveum
 
The Do Good Report - Wrightsville Beach 1st Quarter 2013
The Do Good Report - Wrightsville Beach 1st Quarter 2013The Do Good Report - Wrightsville Beach 1st Quarter 2013
The Do Good Report - Wrightsville Beach 1st Quarter 2013DoGoodRealEstate
 
September 2021 Market Watch Report
September 2021 Market Watch ReportSeptember 2021 Market Watch Report
September 2021 Market Watch ReportMichelle Makos
 
Housing forecast 2016 local stats presentation
Housing forecast 2016 local stats presentationHousing forecast 2016 local stats presentation
Housing forecast 2016 local stats presentationCristina Tomlinson
 
September 2020 - Market Report - Toronto & GTA Housing Sales
September 2020 - Market Report - Toronto & GTA Housing SalesSeptember 2020 - Market Report - Toronto & GTA Housing Sales
September 2020 - Market Report - Toronto & GTA Housing SalesMichelle Makos
 
Market Watch June 2013
Market Watch June 2013Market Watch June 2013
Market Watch June 2013Chaba Tamasi
 

Semelhante a Baltimore Metropolitan Area Market Conditions (20)

Philadelphia Metropolitan Market Conditions Report
Philadelphia Metropolitan Market Conditions ReportPhiladelphia Metropolitan Market Conditions Report
Philadelphia Metropolitan Market Conditions Report
 
Market Watch TORONTO 2015 SEPTEMBER
Market Watch TORONTO 2015 SEPTEMBERMarket Watch TORONTO 2015 SEPTEMBER
Market Watch TORONTO 2015 SEPTEMBER
 
TREB Market Watch - August 2016
TREB Market Watch - August 2016TREB Market Watch - August 2016
TREB Market Watch - August 2016
 
Toronto Market Watch AUGUST 2016
Toronto Market Watch AUGUST 2016Toronto Market Watch AUGUST 2016
Toronto Market Watch AUGUST 2016
 
Greater Baton Rouge Foreclosure Home Sales Improvement Report Q3 2011 vs Q3 2014
Greater Baton Rouge Foreclosure Home Sales Improvement Report Q3 2011 vs Q3 2014Greater Baton Rouge Foreclosure Home Sales Improvement Report Q3 2011 vs Q3 2014
Greater Baton Rouge Foreclosure Home Sales Improvement Report Q3 2011 vs Q3 2014
 
The Boulder Group | Q3 2014 Net Lease Research Report2014 q3-net-lease-resear...
The Boulder Group | Q3 2014 Net Lease Research Report2014 q3-net-lease-resear...The Boulder Group | Q3 2014 Net Lease Research Report2014 q3-net-lease-resear...
The Boulder Group | Q3 2014 Net Lease Research Report2014 q3-net-lease-resear...
 
Financial Forecast
Financial ForecastFinancial Forecast
Financial Forecast
 
Market Report for August 2017 - Residential Resale
Market Report for August 2017 - Residential ResaleMarket Report for August 2017 - Residential Resale
Market Report for August 2017 - Residential Resale
 
April 2016 Home Sales in Toronto and GTA
April 2016 Home Sales in Toronto and GTAApril 2016 Home Sales in Toronto and GTA
April 2016 Home Sales in Toronto and GTA
 
October Market Watch is Here !
October Market Watch is Here !October Market Watch is Here !
October Market Watch is Here !
 
TREB MARKET WATCH 2017
TREB MARKET WATCH 2017TREB MARKET WATCH 2017
TREB MARKET WATCH 2017
 
July 2015 Home Sales Report
July 2015 Home Sales ReportJuly 2015 Home Sales Report
July 2015 Home Sales Report
 
Market Watch - September 2019
Market Watch - September 2019Market Watch - September 2019
Market Watch - September 2019
 
2015 RCA Industrial Report
2015 RCA Industrial Report2015 RCA Industrial Report
2015 RCA Industrial Report
 
December 2014 Home Sales Report
December 2014 Home Sales ReportDecember 2014 Home Sales Report
December 2014 Home Sales Report
 
The Do Good Report - Wrightsville Beach 1st Quarter 2013
The Do Good Report - Wrightsville Beach 1st Quarter 2013The Do Good Report - Wrightsville Beach 1st Quarter 2013
The Do Good Report - Wrightsville Beach 1st Quarter 2013
 
September 2021 Market Watch Report
September 2021 Market Watch ReportSeptember 2021 Market Watch Report
September 2021 Market Watch Report
 
Housing forecast 2016 local stats presentation
Housing forecast 2016 local stats presentationHousing forecast 2016 local stats presentation
Housing forecast 2016 local stats presentation
 
September 2020 - Market Report - Toronto & GTA Housing Sales
September 2020 - Market Report - Toronto & GTA Housing SalesSeptember 2020 - Market Report - Toronto & GTA Housing Sales
September 2020 - Market Report - Toronto & GTA Housing Sales
 
Market Watch June 2013
Market Watch June 2013Market Watch June 2013
Market Watch June 2013
 

Último

Russian Call Girls In Gurgaon ❤️8448577510 ⊹Best Escorts Service In 24/7 Delh...
Russian Call Girls In Gurgaon ❤️8448577510 ⊹Best Escorts Service In 24/7 Delh...Russian Call Girls In Gurgaon ❤️8448577510 ⊹Best Escorts Service In 24/7 Delh...
Russian Call Girls In Gurgaon ❤️8448577510 ⊹Best Escorts Service In 24/7 Delh...lizamodels9
 
HONOR Veterans Event Keynote by Michael Hawkins
HONOR Veterans Event Keynote by Michael HawkinsHONOR Veterans Event Keynote by Michael Hawkins
HONOR Veterans Event Keynote by Michael HawkinsMichael W. Hawkins
 
FULL ENJOY Call Girls In Mahipalpur Delhi Contact Us 8377877756
FULL ENJOY Call Girls In Mahipalpur Delhi Contact Us 8377877756FULL ENJOY Call Girls In Mahipalpur Delhi Contact Us 8377877756
FULL ENJOY Call Girls In Mahipalpur Delhi Contact Us 8377877756dollysharma2066
 
Call Girls in Gomti Nagar - 7388211116 - With room Service
Call Girls in Gomti Nagar - 7388211116  - With room ServiceCall Girls in Gomti Nagar - 7388211116  - With room Service
Call Girls in Gomti Nagar - 7388211116 - With room Servicediscovermytutordmt
 
Famous Olympic Siblings from the 21st Century
Famous Olympic Siblings from the 21st CenturyFamous Olympic Siblings from the 21st Century
Famous Olympic Siblings from the 21st Centuryrwgiffor
 
Enhancing and Restoring Safety & Quality Cultures - Dave Litwiller - May 2024...
Enhancing and Restoring Safety & Quality Cultures - Dave Litwiller - May 2024...Enhancing and Restoring Safety & Quality Cultures - Dave Litwiller - May 2024...
Enhancing and Restoring Safety & Quality Cultures - Dave Litwiller - May 2024...Dave Litwiller
 
How to Get Started in Social Media for Art League City
How to Get Started in Social Media for Art League CityHow to Get Started in Social Media for Art League City
How to Get Started in Social Media for Art League CityEric T. Tung
 
Organizational Transformation Lead with Culture
Organizational Transformation Lead with CultureOrganizational Transformation Lead with Culture
Organizational Transformation Lead with CultureSeta Wicaksana
 
Call Girls Electronic City Just Call 👗 7737669865 👗 Top Class Call Girl Servi...
Call Girls Electronic City Just Call 👗 7737669865 👗 Top Class Call Girl Servi...Call Girls Electronic City Just Call 👗 7737669865 👗 Top Class Call Girl Servi...
Call Girls Electronic City Just Call 👗 7737669865 👗 Top Class Call Girl Servi...amitlee9823
 
The Path to Product Excellence: Avoiding Common Pitfalls and Enhancing Commun...
The Path to Product Excellence: Avoiding Common Pitfalls and Enhancing Commun...The Path to Product Excellence: Avoiding Common Pitfalls and Enhancing Commun...
The Path to Product Excellence: Avoiding Common Pitfalls and Enhancing Commun...Aggregage
 
Insurers' journeys to build a mastery in the IoT usage
Insurers' journeys to build a mastery in the IoT usageInsurers' journeys to build a mastery in the IoT usage
Insurers' journeys to build a mastery in the IoT usageMatteo Carbone
 
Boost the utilization of your HCL environment by reevaluating use cases and f...
Boost the utilization of your HCL environment by reevaluating use cases and f...Boost the utilization of your HCL environment by reevaluating use cases and f...
Boost the utilization of your HCL environment by reevaluating use cases and f...Roland Driesen
 
Best VIP Call Girls Noida Sector 40 Call Me: 8448380779
Best VIP Call Girls Noida Sector 40 Call Me: 8448380779Best VIP Call Girls Noida Sector 40 Call Me: 8448380779
Best VIP Call Girls Noida Sector 40 Call Me: 8448380779Delhi Call girls
 
Regression analysis: Simple Linear Regression Multiple Linear Regression
Regression analysis:  Simple Linear Regression Multiple Linear RegressionRegression analysis:  Simple Linear Regression Multiple Linear Regression
Regression analysis: Simple Linear Regression Multiple Linear RegressionRavindra Nath Shukla
 
Dr. Admir Softic_ presentation_Green Club_ENG.pdf
Dr. Admir Softic_ presentation_Green Club_ENG.pdfDr. Admir Softic_ presentation_Green Club_ENG.pdf
Dr. Admir Softic_ presentation_Green Club_ENG.pdfAdmir Softic
 
0183760ssssssssssssssssssssssssssss00101011 (27).pdf
0183760ssssssssssssssssssssssssssss00101011 (27).pdf0183760ssssssssssssssssssssssssssss00101011 (27).pdf
0183760ssssssssssssssssssssssssssss00101011 (27).pdfRenandantas16
 

Último (20)

Russian Call Girls In Gurgaon ❤️8448577510 ⊹Best Escorts Service In 24/7 Delh...
Russian Call Girls In Gurgaon ❤️8448577510 ⊹Best Escorts Service In 24/7 Delh...Russian Call Girls In Gurgaon ❤️8448577510 ⊹Best Escorts Service In 24/7 Delh...
Russian Call Girls In Gurgaon ❤️8448577510 ⊹Best Escorts Service In 24/7 Delh...
 
HONOR Veterans Event Keynote by Michael Hawkins
HONOR Veterans Event Keynote by Michael HawkinsHONOR Veterans Event Keynote by Michael Hawkins
HONOR Veterans Event Keynote by Michael Hawkins
 
VVVIP Call Girls In Greater Kailash ➡️ Delhi ➡️ 9999965857 🚀 No Advance 24HRS...
VVVIP Call Girls In Greater Kailash ➡️ Delhi ➡️ 9999965857 🚀 No Advance 24HRS...VVVIP Call Girls In Greater Kailash ➡️ Delhi ➡️ 9999965857 🚀 No Advance 24HRS...
VVVIP Call Girls In Greater Kailash ➡️ Delhi ➡️ 9999965857 🚀 No Advance 24HRS...
 
FULL ENJOY Call Girls In Mahipalpur Delhi Contact Us 8377877756
FULL ENJOY Call Girls In Mahipalpur Delhi Contact Us 8377877756FULL ENJOY Call Girls In Mahipalpur Delhi Contact Us 8377877756
FULL ENJOY Call Girls In Mahipalpur Delhi Contact Us 8377877756
 
Call Girls in Gomti Nagar - 7388211116 - With room Service
Call Girls in Gomti Nagar - 7388211116  - With room ServiceCall Girls in Gomti Nagar - 7388211116  - With room Service
Call Girls in Gomti Nagar - 7388211116 - With room Service
 
Forklift Operations: Safety through Cartoons
Forklift Operations: Safety through CartoonsForklift Operations: Safety through Cartoons
Forklift Operations: Safety through Cartoons
 
Famous Olympic Siblings from the 21st Century
Famous Olympic Siblings from the 21st CenturyFamous Olympic Siblings from the 21st Century
Famous Olympic Siblings from the 21st Century
 
Enhancing and Restoring Safety & Quality Cultures - Dave Litwiller - May 2024...
Enhancing and Restoring Safety & Quality Cultures - Dave Litwiller - May 2024...Enhancing and Restoring Safety & Quality Cultures - Dave Litwiller - May 2024...
Enhancing and Restoring Safety & Quality Cultures - Dave Litwiller - May 2024...
 
unwanted pregnancy Kit [+918133066128] Abortion Pills IN Dubai UAE Abudhabi
unwanted pregnancy Kit [+918133066128] Abortion Pills IN Dubai UAE Abudhabiunwanted pregnancy Kit [+918133066128] Abortion Pills IN Dubai UAE Abudhabi
unwanted pregnancy Kit [+918133066128] Abortion Pills IN Dubai UAE Abudhabi
 
How to Get Started in Social Media for Art League City
How to Get Started in Social Media for Art League CityHow to Get Started in Social Media for Art League City
How to Get Started in Social Media for Art League City
 
Mifty kit IN Salmiya (+918133066128) Abortion pills IN Salmiyah Cytotec pills
Mifty kit IN Salmiya (+918133066128) Abortion pills IN Salmiyah Cytotec pillsMifty kit IN Salmiya (+918133066128) Abortion pills IN Salmiyah Cytotec pills
Mifty kit IN Salmiya (+918133066128) Abortion pills IN Salmiyah Cytotec pills
 
Organizational Transformation Lead with Culture
Organizational Transformation Lead with CultureOrganizational Transformation Lead with Culture
Organizational Transformation Lead with Culture
 
Call Girls Electronic City Just Call 👗 7737669865 👗 Top Class Call Girl Servi...
Call Girls Electronic City Just Call 👗 7737669865 👗 Top Class Call Girl Servi...Call Girls Electronic City Just Call 👗 7737669865 👗 Top Class Call Girl Servi...
Call Girls Electronic City Just Call 👗 7737669865 👗 Top Class Call Girl Servi...
 
The Path to Product Excellence: Avoiding Common Pitfalls and Enhancing Commun...
The Path to Product Excellence: Avoiding Common Pitfalls and Enhancing Commun...The Path to Product Excellence: Avoiding Common Pitfalls and Enhancing Commun...
The Path to Product Excellence: Avoiding Common Pitfalls and Enhancing Commun...
 
Insurers' journeys to build a mastery in the IoT usage
Insurers' journeys to build a mastery in the IoT usageInsurers' journeys to build a mastery in the IoT usage
Insurers' journeys to build a mastery in the IoT usage
 
Boost the utilization of your HCL environment by reevaluating use cases and f...
Boost the utilization of your HCL environment by reevaluating use cases and f...Boost the utilization of your HCL environment by reevaluating use cases and f...
Boost the utilization of your HCL environment by reevaluating use cases and f...
 
Best VIP Call Girls Noida Sector 40 Call Me: 8448380779
Best VIP Call Girls Noida Sector 40 Call Me: 8448380779Best VIP Call Girls Noida Sector 40 Call Me: 8448380779
Best VIP Call Girls Noida Sector 40 Call Me: 8448380779
 
Regression analysis: Simple Linear Regression Multiple Linear Regression
Regression analysis:  Simple Linear Regression Multiple Linear RegressionRegression analysis:  Simple Linear Regression Multiple Linear Regression
Regression analysis: Simple Linear Regression Multiple Linear Regression
 
Dr. Admir Softic_ presentation_Green Club_ENG.pdf
Dr. Admir Softic_ presentation_Green Club_ENG.pdfDr. Admir Softic_ presentation_Green Club_ENG.pdf
Dr. Admir Softic_ presentation_Green Club_ENG.pdf
 
0183760ssssssssssssssssssssssssssss00101011 (27).pdf
0183760ssssssssssssssssssssssssssss00101011 (27).pdf0183760ssssssssssssssssssssssssssss00101011 (27).pdf
0183760ssssssssssssssssssssssssssss00101011 (27).pdf
 

Baltimore Metropolitan Area Market Conditions

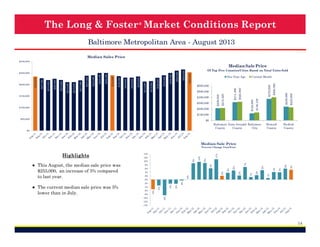
  • 1. The Long & Foster ® Market Conditions Report Baltimore Metropolitan Area - September 2013 Median Sales Price $300,000 Current Month $200,000 $229,000 $130,000 $299,550 $115,000 $300,000 $100,000 $289,950 $400,000 $215,000 $210,000 $500,000 $150,000 $370,000 $600,000 $226,500 One Year Ago $375,000 $248,500 $250,501 $265,000 $260,000 $250,000 $240,000 $229,200 $215,000 $213,000 $235,000 $230,000 $230,000 $236,000 $240,000 $250,000 $240,000 $237,926 $217,900 $210,000 $210,000 $219,900 $225,000 $219,000 $200,000 $227,500 $250,000 $250,000 Median Sale Price Of Top Five Counties/Cities Based on Total Units Sold $100,000 $50,000 $0 Baltimore Anne Arundel Baltimore County County City $0 Howard County Harford County Median Sale Price Percent Change Year/Year -2% -2% 5% 4% 6% 4% 1% 2% 4% 5% 7% 2% 5% 0% 0% 1% 0% 2% -6% 11% 2% 4% 4% 6% -4% 9% 6% 8% 10% 9% 10% -2% ● The current median sale price was 5% higher than the same month last year. 12% -8% -10% -12% -9% ● This September, the current median sale price of $248,500 was similar to the median sale price of last month. 14% -3% Highlights -14% 14
  • 2. The Long & Foster ® Market Conditions Report Baltimore Metropolitan Area - September 2013 Total Units Sold 1,000 500 238 203 283 400 275 473 444 490 2,088 Current Month 588 One Year Ago 709 800 579 2,441 2,493 2,967 2,926 Total Units Sold Of Top Five Counties/Cities Based on Total Units Sold 1,565 1,642 2,066 2,237 2,071 2,551 2,465 2,195 2,134 2,028 1,561 1,426 1,856 1,769 1,712 0 Baltimore Anne Arundel Baltimore County County City 0 Howard County Harford County Total Units Sold 26% 16% 3% 16% 14% 15% 9% 11% 0% 0% 1% -1% 0% 7% 7% 12% 7% 4% 6% 10% ● There was a decrease of 16% in total units sold in September compared to August. 20% 21% 17% 20% 6% ● This month's total units sold was higher than at this time last year, an increase of 14% versus September 2012. 30% -3% Highlights 28% Percent Change Year/Year 14% 1,500 2,005 2,000 2,516 2,500 2,718 3,000 3,156 3,266 3,500 -10% 15
  • 3. The Long & Foster ® Market Conditions Report Baltimore Metropolitan Area - September 2013 Total Units Sold by Type Detached Attached Total Units Sold by Type Current Month Condo 3,500 Detached Attached Condo 3,000 177 7% 2,500 2,000 1,500 953 38% 1,000 1,363 55% 500 0 Total Units Sold by Price Range Total Units Sold by Price Range < 150K 1,400 150K to < 300K 300K to < 450K 450K to < 600K Current Month 600K and up < 150K 450K to < 600K 1,200 220 9% 1,000 150K to < 300K 600K and up 150 6% 300K to < 450K 539 22% 800 600 553 22% 400 200 1,031 41% 0 16
  • 4. The Long & Foster ® Market Conditions Report Baltimore Metropolitan Area - September 2013 Total Active Inventory 20,000 Total Active Inventory Current Month 1,414 1,281 1,160 2,000 8,000 1,055 3,418 3,222 2,843 3,000 2,763 4,000 3,227 5,000 3,012 13,066 12,832 6,000 13,315 13,462 13,339 12,796 11,784 11,338 11,150 11,319 10,000 12,340 13,181 13,543 13,704 14,239 14,703 14,863 14,832 14,207 13,727 13,815 One Year Ago 14,414 12,000 16,029 14,000 Of Top Five Counties/Cities Based on Total Units Sold 17,320 16,000 17,942 18,000 1,000 6,000 0 Baltimore County 4,000 Anne Arundel County 2,000 Baltimore City Howard County Harford County 0 Total Active Inventory Percent Change Year/Year -5% -5% -6% -8% -10% -14% -17% -17% -19% -21% -23% -24% -25% -24% -23% -21% -22% -25% -30% -22% -25% -23% -20% -23% -15% -15% -10% -23% ● Versus last September, the total number of homes available was lower by 711 units or 5%. -5% -18% ● September's total active inventory of 12,832 units was 2% lower than the previous month's supply of inventory. 0% -14% Highlights -35% 17
  • 5. The Long & Foster ® Market Conditions Report Baltimore Metropolitan Area - September 2013 Total Active Inventory by Type Detached Attached Total Active Inventory by Type Condo Current Month 20,000 Detached Attached Condo 18,000 16,000 833 7% 14,000 12,000 10,000 4,246 33% 8,000 7,753 60% 6,000 4,000 2,000 0 Total Active Inventory by Price Range < 150K 20,000 18,000 150K to < 300K 300K to < 450K 450K to < 600K 600K and up Total Active Inventory by Price Range Current Month < 150K 450K to < 600K 150K to < 300K 600K and up 300K to < 450K 16,000 1,786 14% 14,000 12,000 10,000 8,000 6,000 4,000 2,000 1,434 11% 2,368 18% 3,176 25% 4,068 32% 0 18
  • 6. The Long & Foster ® Market Conditions Report Baltimore Metropolitan Area - September 2013 Sale Price as % of List Price Average Sale Price as a Percent of List Price Of Top Five Counties/Cities Based on Total Units Sold Baltimore County Days on Market Current One Year Month Ago 94.0% 93.5% 58 Anne Arundel County 97 95 100% 98 77 97.6% 97.0% 98.0% 97.1% 97.3% 96.2% Up 1.1% Vs. Year Ago < 150K 150K to < 300K 300K to < 450K 450K to < 600K 600K and up 98% 94 94 96% 87 85 85 Harford County by Price Range 105 100 100 99 Howard County Average Sale Price as a Percent of List Price Days on Market 105 Baltimore City Avg Sale Price as % of List Price Current One Year Month Ago Down -25% Vs. Year Ago 115 Current Month 97.1% 97.2% 96.3% 97.0% 100.0% 99.0% 98.0% 97.0% 96.0% 95.0% 94.0% 93.0% 95.5% 97.5% 97.8% 97.6% 97.3% 96.8% 96.9% 96.5% 96.7% 96.8% 96.8% 96.2% 96.7% One Year Ago 95.5% 95.8% 95.1% 94.5% 95.5% 95.3% 95.6% 95.0% 95.6% 95.5% 95.6% 96.0% 96.4% 96.4% 96.5% 96.8% 97.0% 97.1% 97.5% 97.6% 98.0% 96.3% 98.5% 78 77 78 77 78 79 81 81 82 94% 75 92% 75 90% 65 55 60 58 57 58 58 88% 86% 19
  • 7. The Long & Foster ® Market Conditions Report Baltimore Metropolitan Area - September 2013 Highlights Total Dollar Volume Sold In Thousands $1,200,000 ● Total volume sold this September was 15% greater than the same month one year ago. $719,257 $868,644 $983,028 $986,686 $871,868 $692,507 $556,709 $391,588 $409,096 $579,587 $610,219 $554,957 $624,351 $724,948 $729,549 $702,631 $512,851 $380,189 $494,423 $464,704 $365,176 $200,000 $437,511 $400,000 $547,438 $600,000 $610,833 $800,000 $822,470 $1,000,000 ● In September, there was 5.2 months of supply available, compared to 6.2 in September 2012. That was a decrease of 17% versus a year ago. $0 Months of Supply Total Dollar Volume Sold Current One Year Month Ago Current Month's Active Inventory/Current Month's Unit Sales 12 $719,256,938 9.7 2 4.4 4.2 4.1 5.2 5.2 5.6 6.8 5.5 5.5 6.4 6.2 5.4 5.8 7.2 4.6 4 5.4 5.9 7.0 7.0 7.8 6 $624,350,703 Up 15% Vs. Year Ago 8.8 9.1 9.0 8 10.1 10 Months of Supply Current One Year Month Ago 5.2 6.2 Down -17% Vs. Year Ago 0 20
  • 8. The Long & Foster ® Market Conditions Report Baltimore Metropolitan Area - September 2013 New Listings New Listings & New Contracts 3,335 Up 21% Vs. Year Ago New Contracts Current One Year Month Ago 2,651 2,041 354 326 440 346 786 991 Harford County Anne Arundel County Baltimore City Howard County 244 169 285 227 591 Current Month 433 603 478 One Year Ago 720 1,200 1,000 800 600 400 200 0 542 2,651 2,787 2,894 2,937 3,200 Howard County Harford County Supply/Demand Ratio Highlights ● Based on this month's amount of new listings and new contracts, the ratio of home supply (new listings) to current home demand (new contracts) was 1.5, a decrease of 7% from September 2012. Baltimore City New Contracts 2,123 2,835 Anne Arundel County Baltimore County 4,046 Current Month Of Top Five Counties/Cities Based on Total Units Sold 0 New Listings Current One Year Month Ago 899 733 1,038 870 Baltimore County 4,046 4,202 4,348 4,423 4,960 4,292 1,200 1,000 800 600 400 200 0 One Year Ago 3,291 3,137 1,980 1,536 1,864 2,202 1,905 2,627 3,290 3,335 2,041 3,610 2,376 3,594 2,417 3,892 2,456 4,129 2,614 2,550 3,361 2,090 1,776 1,889 1,434 1,754 1,895 1,723 2,000 2,652 2,562 3,000 1,000 2,950 3,355 3,351 5,000 4,323 4,425 5,123 6,000 4,000 Of Top Five Counties/Cities Based on Total Units Sold New Contracts (Under Active Contract Status) 3,261 New Listings Number of New Listings to New Contracts 2.5 2.0 1.5 1.9 1.8 1.5 1.7 1.6 1.7 1.7 1.6 1.6 1.3 1.5 1.5 1.6 1.5 1.6 1.6 1.6 1.5 1.5 1.5 1.5 1.5 1.5 1.4 1.2 1.0 0.5 Up 30% Vs. Year Ago 0.0 21