Bajaj Allianz Life Insurance Company - Insurer Innovation Award 2024
Sentron datasheet final 042610
1. SENTRON powermanager TM
software,
combined with Siemens power meters and
low voltage protective devices, provides
a complete energy management solution
for your business. It allows you to measure,
process, analyze, store and share energy
usage and status information across your
entire enterprise. It offers control capabilities,
comprehensive energy usage and reliability,
and detailed reporting that will help you
reduce energy related costs.
SENTRON powermanager allows you to
manage all your intelligent devices and
analyze the data, allowing you to identify
hidden potentials for energy optimization
and overall savings.
Its cutting edge flexibility and compatibility
means you can add one piece at a time,
at your own pace, while still maintaining
your original investments. Additionally,
the scalability lets you start with an easy
to configure, low investment sub-metering
solution which can be extended to an
enterprise wide power management
system later.
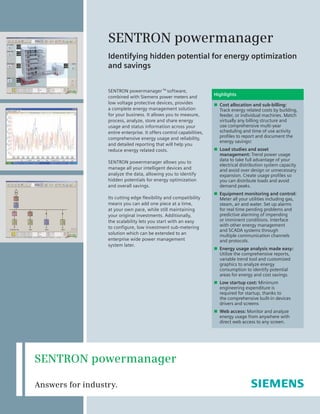
SENTRON powermanager
Identifying hidden potential for energy optimization
and savings
Highlights
n Cost allocation and sub-billing:
Track energy related costs by building,
feeder, or individual machines. Match
virtually any billing structure and
use comprehensive multi-year
scheduling and time of use activity
profiles to report and document the
energy savings!
n Load studies and asset
management: Trend power usage
data to take full advantage of your
electrical distribution system capacity
and avoid over design or unnecessary
expansion. Create usage profiles so
you can distribute loads and avoid
demand peaks.
n Equipment monitoring and control:
Meter all your utilities including gas,
steam, air and water. Set up alarms
for real time pending problems and
predictive alarming of impending
or imminent conditions. Interface
with other energy management
and SCADA systems through
multiple communication channels
and protocols.
n Energy usage analysis made easy:
Utilize the comprehensive reports,
variable trend tool and customized
graphics to analyze energy
consumption to identify potential
areas for energy and cost savings.
n Low startup cost: Minimum
engineering expenditure is
required for startup, thanks to
the comprehensive built-in devices
drivers and screens
n Web access: Monitor and analyze
energy usage from anywhere with
direct web access to any screen.
SENTRON powermanager
Answers for industry.
2. Power and energy flows become visible and controllable
2
Overview
SENTRON powermanager software and intelligent electronic devices
The SENTRON Power Management system is designed to support many different applications utilizing a standard PC or server
while communicating to the metering devices serially or over a standard Ethernet LAN / WAN network. General benefits of a
power management system: To identify savings potential, to reduce power costs and to ensure power availability.
SENTRON powermanager provides a comprehensive view of the
existing power and energy conditions and protective device
status. Detailed analysis of reports can be performed to identify
waste. Control functions of the software or from ties to other
supervisory systems then can be used to act to control the cost.
Controlling energy cost can be a significant factor in a business’
competitiveness in the market.
The SENTRON powermanager software:
• is available in a stand-alone or LAN/WAN based configuration
that can also exchange information with other supervisory
systems like building automation software
• can utilize any Ethernet or serial based connections
• is expandable from the basic monitoring application to a fully
customized enterprise management system
• is fully scalable with regard to the connected devices and to
the software’s function to meet current and future needs
• ensures the seamless integration of power monitoring
devices from the Siemens SENTRON PAC series meters and
SENTRON WL/VL circuit breakers as well as other Modbus
communicating devices
• is designed to collect, archive, monitor, display and evaluate
any kind of energy related device data
• provides web based reporting and detailed graphics
construction utilities as standard
Benefits
• Visibility and control of power flows
• Exact knowledge of the consumption profile
• Increase of energy efficiency
• Optimization of power supply contracts
• Compliance with contractual terms or regulations
• Allocation of costs to individual cost centers
• Optimization of plant maintenance
• Identification of critical systems conditions
The Siemens power meter and low voltage protection devices
are seamlessly integrated in the SENTRON powermanager
software. Energy data acquisition can take place without any
complicated configuration effort and the most important
measured values or states are indicated with predefined
screens. This reduces the engineering expenditures for the
customer and gives the user the assurance of knowing that
the device functions are optimally supported in the software
at the time of startup.
See status information of entire power distribution system at a glance Discover unusual energy patterns
3. Licenses Valid
Number of
devices
Number of
standard
windows clients
Feature package “Web”
number of standard
web clients
Feature
package
“Expert” OPC Server/client
Trial 30 Days Up to 10 1 10 Yes Yes server/client
Lean unlimited Up to 10 1 0 No Yes server
Lean Plus unlimited Up to 10 1 10 Yes Yes server/client
Standard Plus unlimited Up to 50 1 10 Yes Yes server/client
Advanced Plus unlimited Up to 100 1 10 Yes Yes server/client
Maximum Plus unlimited Up to 200 1 10 Yes Yes server/client
3
License Structure: The table below shows the type of package and the number of devices included in each license.
Simple one line diagram displaying low voltage system information
Create your own diagrams, objects and device types with the Expert tool
A power management system that can be customized to your needs
Scalable
The SENTRON powermanager system provides a scalable solution
that starts with the basic functionality of the “Lean” package. This
easy to use package provides basic status and energy monitoring,
logging, trending and alarming. Additional functionality can
be added by upgrading to the “Lean Plus,” “Standard Plus,”
“Advanced Plus” or “Maximum Plus” packages. All upgrades
require only a simple download of a key without the removal
of the existing software.
The “Lean Plus”, “Standard Plus,” “Advanced Plus” license packages
are ordered based on the number of devices attached to the
software. The scalable packages come in 10, 50, 100 and 200
device licenses. Each “Plus” license version also includes the
“Expert” and “Web” feature package.
The “Expert” feature package provides the user with an
easy to use graphic configuration tool that allows designing
of custom interactive graphic screens like one-lines, elevations,
floor plans and more. Object animation to events or status
changes, real time data displays all linked by hyper link buttons
can be designed by the end user. In addition the user can define
his own devices using a device editor, which is included in the
package, and integrate them in the system.
The user even has the possibility of creating their own runtime
scripts to execute special functions like applying animation to
objects, e.g. blinking, color change, appear or disappear. Existing
data and configurations can still be used after upgrading.
The “Web” feature package is included in all “Plus” license packages
and provides the user with all the features of the standard windows
client in a web HTML format. This gives the user the ability to
monitor, analyze and take actions (based on user rights) in a
standard web browser screen with no software loaded on the
computer from any computer with a Web connection.
SENTRON powermanager comprises a web-based server/client
software approach for the acquisition, processing, presentation
and archiving of energy data. Every software license contains a
data server license and a Windows client license. More than one
Windows clients can be used as a separate power management
station. Additional Windows clients can be added to the software
as an option allowing full functionality at multiple locations.
These “Expert” and “Web” features have been
designed to help you visualize the status of
the entire power distribution system.
4. 4
Powerful tools to analyze your energy consumption
Cost center report graph
Customer Benefits
Cost allocation and sub-billing reports
Cost allocation and sub-billing functionality in the SENTRON
powermanager software allows the user to track energy related
costs by building, floor, tenant, feeder or location. Match
virtually any fixed rate billing structure and use comprehensive
multi-year scheduling and time-of-use features to manage the
energy costs.
Load studies and asset management
Trend power usage data to take full advantage of your electrical
distribution system capacity and avoid over-design. Create
usage profiles that will allow you to distribute loads and avoid
demand peak which helps to identify energy leaks such as
equipment running during down time.
Equipment monitoring and control
SENTRON powermanager allows you to meter all your utilities
including gas, steam, air and water and set up general condition
alarming and pre-event alarms for impending or imminent
conditions. Interface with other energy management and SCADA
systems through multiple communication channels and protocols
like OPC.
Reports
Standard reports provide models of daily electricity usage so you
can distribute loads and avoid demand peaks. This enables you
to allocate energy consumption and/or costs to individual areas
and identify expensive processes that need attention. The
historic trending report compiles data from load circuits over a
users predefined period. This enables the user to fully utilize the
power distribution system and run at near rated tolerances.
Feature summary
Monitoring
Breaker/system status indicators – Display the current status
of breakers, motors or any device. See a feeder change color to
indicate overload. Watch a breaker status change when you press
the open/close button.
Control – Perform remote operation from the Windows client or
Web client e.g. remote control of a breaker or reset of power meter
device data. All control features are user defined with password
verification.
Reports – Standard and custom SENTRON powermanager reports
can be generated using an easy to use report wizard interface.
The reports can be generated in a Microsoft Excel or HTML
format and can be e-mailed, saved or printed out automatically.
Aggregate Energy and Demand (billing), Load Profiles and a
SQL query are standard pre-defined reports included with
the software.
Cost center overview table per utility
5. 5
View power quality data in the standard PAC 4200 screenBasic PAC metering table view
Variable trend tool – One value over two time periods Variable trend tool – Multiple values over one time periods
Display the status of your power distribution system
Generate trend graphs
The Variable Trend tool allows you to view and interpret a mixture of historic and instantaneous data. You can watch the KW load change
over a month, a week, or during production shifts. The tool also allows you to get a closer look using the versatile zoom functions, add or
remove values at your need and export viewed data to a CSV file.
Take advantage of default graphics
Speed up your system configuration with default screens. Immediate access to all meters is just a few mouse clicks away with the
“PM Explorer Start Page”: pick your meter, assign an IP address and immediately see data in the predefined views. Predefined data
representation helps users examine standard power management data as well as more sophisticated data like odd/even harmonics,
and THD.
The Variable Trend tool allows a user to compare energy
consumption of different buildings or different machines at the
same time i.e.: last month, last week or last year. This tool also
allows a user to view one specific value over time. For example,
a motor current that is rising over time, could indicate a need
for maintenance that would prevent downtime and costly repairs
or replacement.
The advanced features of the Variable Trend tool allows a user
to add a second time period. This makes it very convenient and
easy to compare one or multiple values over 2 time periods. For
example, to compare energy consumption this week to energy
consumption of the previous week.
6. 6
View and control your facilities’ infrastructure condition from anywhere
“Expert” feature package: Customized graphics
Graphical tools in the SENTRON powermanager “Expert” feature
package help create custom graphics for:
• an overview of the power distribution system status for the
entire facility or just selected locations
• specific alarm conditions e.g. to alert the operator of unusual
load circumstances
• status indicators of 3rd party devices like transformers,
generators etc.
• control triggers
• Powerful math, logic and control functions used to aggregate
data from multiple sources, analyze it and initiates coordinated
actions based on the results. Perfect for demand control and
cost allocation.
Plan overview provides energy usage per building
“Web” feature package: Web client access
Your web browser is now a window to the power management
system. Web clients provide the same functionality as a full
client, even with control ability. Use any computer’s standard
web browser to display the SENTRON powermanager graphics,
logged data, real time data, alarms, trends without any software
loaded on the computer. Windows client functionality is required
to create, change or schedule reports.
Additional standard functionality
Database management
All data is captured in SENTRON powermanager’s high
performance database thus avoiding any additional database
development investment. The software comes with OPC DA
Server and Client as well as OPC AE.
Multi-language support
The SENTRON powermanager supports English and German
as standard. The graphical user interface can be operated in
different languages even in one project simultaneously.
Additional languages can be imported using a tool to support
international locations.
User administration
User access can be assigned to multiple groups and up to 32
different security levels. Several special functions e.g. password
aging and auto logout are used to create a highly sophisticated
access security system.
Sophisticated user administration tool
7. 7
System configuration
• Integration of devices with predefined device templates
for the SENTRON PAC TM family and the SENTRON 3WL/3VL
circuit breakers
• Easy integration of existing Modbus devices
• Communication through Standard Ethernet
• Integration of devices with RS485 interface (Modbus RTU)
through Modbus gateway, e.g. the SENTRON PAC4200 can
be used as a gateway
System requirements
Hardware requirements
• Processor: Intel® Pentium® IV 2.8 Ghz (or better)
• RAM: At least 2 GB
• Hard disk: At least 1 GB free
• Graphics: VGA with at least 1280 x 1024 pixels and 16-bit
color intensity
Supported operating systems
• Windows Vista Business®, Ultimate; SP1
• Windows XP®; CP with SP2/SP3
• Windows 2003®: Server 2003 (32-bit)
• Windows 2008®: Server 2008 server (32-bit)
Supported Excel versions (required for reporting)
• Excel ® 2000, Excel XP, Excel 2007, Excel 2003
Network connectivity
Ethernet connectivity
A SENTRON powermanager system can be deployed on any
standard Ethernet TCP/IP network for fast transmission of data
from any Ethernet device tied to the network. These devices can
be locally or remotely connected using the plant’s WAN network.
Using the existing Ethernet network provides efficient use of
resources and allows visibility to the system by anyone on the
network though their computer’s Internet Explorer screen.
Gateway connectivity
The gateway ability of the Siemens meters allows a user to
connect multiple serial devices on one RS485 daisy-chain
communications wire to the Ethernet by using one meter as
the gateway or RS485 to Ethernet converter. This allows the
SENTRON powermanager software to communicate to multiple
devices using one IP address. This ability reduces the amount
of IP addresses required by the system, thus reducing server
space requirements.
Modbus device support
SENTRON powermanager can read data from any third party
Modbus RTU or Modbus TCP device.
Data acquisition
• Gather data via Ethernet or serial links using the gateway
functionality of a meter or another device
• Store historic and event data in a database
• Integrate metering of electricity, gas, water, steam, air,
and more
• Interface to third party hardware and software through
Modbus RTU, Modbus TCP, Ethernet, OPC AE and DA
System architecture
Flexibility allows the system to be adjusted to your needs
Ethernet
Ethernet (Modbus)
PAC3200
SENTRON
3WL
SENTRON
3VL
Third Party
Devices
GatewayPAC3200PAC4200
Data processing
SENTRON powermanager server
Data detection
Measuring/protection devices
Operation and monitoring
Windows or web clients
Third Party
Devices
PAC3100
Modbus RS485
PAC3100