Infographic: How Tech Marketers Are Using Content Marketing
•
0 gostou•505 visualizações

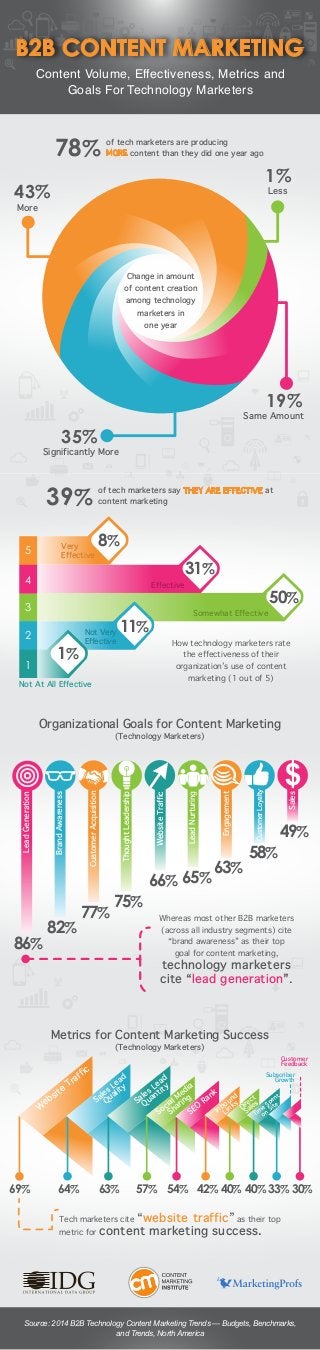
An infographic pulled from CMI’s B2B CONTENT MARKETING: 2014 BENCHMARKS, BUDGETS, AND TRENDS, NORTH AMERICA research. This report highlights key areas of difference between the most effective technology marketers and their less effective peers. This infographic specifically focuses on content marketing volume, effectiveness, metrics and goals for technology marketers. See more at: http://idgknowledgehub.com/infographic-tech-marketers-using-content-marketing/2014/05/01/#sthash.HP8sZuLe.dpuf
Recomendados

Recomendados
Mais conteúdo relacionado
Último
Último (20)
Destaque
Destaque (20)
Infographic: How Tech Marketers Are Using Content Marketing
- 1. Whereas most other B2B marketers (across all industry segments) cite “brand awareness” as their top goal for content marketing, technology marketers cite “lead generation”. LeadGeneration BrandAwareness CustomerAcquisition ThoughtLeadership WebsiteTraffic LeadNurturing Engagement CustomerLoyalty Sales B2B CONTENT MARKETING Content Volume, Effectiveness, Metrics and Goals For Technology Marketers B2B CONTENT MARKETING Content Volume, Effectiveness, Metrics and Goals For Technology Marketers Source: 2014 B2B Technology Content Marketing Trends — Budgets, Benchmarks, and Trends, North America Tech marketers cite “website traffic” as their top metric for content marketing success. 5 4 3 2 1 Change in amount of content creation among technology marketers in one year Significantly More 35% More 43% Same Amount 19% Less 1% of tech marketers say THEY ARE EFFECTIVE at content marketing39% 8% 31% 1% 50% 11% of tech marketers are producing MORE content than they did one year ago78% How technology marketers rate the effectiveness of their organization’s use of content marketing (1 out of 5) Very Effective Not At All Effective Organizational Goals for Content Marketing (Technology Marketers) 86% 82% 77% 75% 66% 65% 63% 58% 49% Metrics for Content Marketing Success (Technology Marketers) 69% 30%64% 33%40%40%42%54%57%63% W ebsite Traffic Sales Lead Quality Sales Lead Quantity Social Media Sharing SEO Rank Inbound Links Direct Sales Tim e Spent on Site Subscriber Growth Customer Feedback Effective Somewhat Effective Not Very Effective