SlideShare uma empresa Scribd logo
1 de 8
Baixar para ler offline
No. 11          23 January 2013
                             GLOBAL FDI RECOVERY DERAILS


                                                HIGHLIGHTS
   Global foreign direct investment (FDI) inflows declined by 18% in 2012, to an estimated US$1.3 trillion
    (figure 1) – a level close to the trough reached in 2009 – due mainly to macroeconomic fragility and
    policy uncertainty for investors.

   The FDI recovery that had started in 2010 and 2011 will take longer than expected. FDI flows could
    rise moderately over 2013-2014, although significant risks to this scenario persist.

   The strong decline of FDI flows presents a stark contrast to other macroeconomic variables, including
    GDP, trade and employment growth which remain in positive territory (table 1).

                   Figure 1. Global FDI inflows, average 2005–2007, 2007–2014
                                      (Trillions of US dollars)


           Source: UNCTAD.
           * Revised, ** Estimates, *** Forecast.

   In developed countries FDI flows fell drastically to values last seen almost ten years ago. The majority of
    EU countries saw significant drops in FDI flows with the total fall amounting to some US$150 billion.
    Unites States FDI flows also fell by US$80 billion.

   FDI flows to developing economies, for the first time ever, exceeded those to developed countries, by some
    US$130 billion. FDI flows to developing economies remained resilient, declining only 3%. Flows to
    developing Asia lost some momentum, although they remained at historically high levels. Latin America
    and Africa saw a small increase.

   Cross-border merger and acquisitions (M&As) data shows that developed country investors are divesting
    massively while investors from developing countries are bucking the trend. Their share in cross-border
    M&A purchases rose to a record 37%.


                                                                                                                  1
Global FDI inflows declined by one fifth in 2012

       Global FDI flows fell by 18% to an estimated US$1.3 trillion, down from a revised US$1.6 trillion
in 2011, as significant investor uncertainty continues to hamper the FDI recovery. This uncertainty is driven
by a weakening macroeconomic environment with lower growth rates for GDP, trade, capital formation and
employment (table 1), and by a number of perceived risk factors in the policy environment, related to the
Eurozone crisis, the United States fiscal cliff, changes of government in a number of major economies in
2012, and broad-based policy changes with implications for FDI.

                  Table 1. Growth rates of global GDP, GFCF, trade, employment and FDI, 2008–2014
                                                      (Per cent)

                  Variable                  2008   2009     2010      2011     2012a      2013b     2014b
      GDP                                    1.4    -2.1     4.0       2.7       2.3        2.4       3.1
      Trade                                  3.0   -10.4    12.6       5.8       3.2        4.5       5.8
      GFCF                                   2.3    -5.6     5.3       4.8       4.6        5.3       6.0
      Employment                             1.1     0.4     1.4       1.5       1.3        1.3       1.3
      FDI                                   -9.5   -33.0    14.1      16.2     -18.3        7.7      17.1
      Memorandum:
      FDI value ( in trillions)        1.81      1.21       1.38     1.60       1.31        1.4       1.6
      Source : UNCTAD based on World Bank for GDP, IMF for GFCF and Trade and ILO for employment.
      a
       Estimation. b Projections.
      GFCF=gross fixed capital formation.


              Developing countries surpassed developed countries in FDI inflows

        FDI flows to developing economies remained relatively resilient in 2012, reaching US$680
billion, the second highest level ever recorded. Developing economies absorbed an unprecedented
US$130 billion more than developed countries (figure 2).

          Figure 2. Global FDI inflows, developed, developing and transition economies, 2000–2012
                                                (Billions of US dollars)


           Source: UNCTAD.


                                                                                                            2
FDI inflows to developing Asia fell by 9.5% as a result of declines across most sub-regions and
major economies, including China, Hong Kong (China), India, the Republic of Korea, Singapore and
Turkey. However, 2012 inflows to Asia were still at the second highest level recorded, accounting for 59%
of FDI flows to developing countries.

       FDI flows to China declined slightly but the country continues to be a major FDI recipient – the
second largest in the world. FDI inflows to China declined by only 3.4% to $120 billion in 2012, despite a
strong downward pressure on FDI in manufacturing caused by rising production costs and weakening
export markets. The 7.8% growth of the Chinese economy helped maintain investor confidence. FDI to
India declined by 14%, although it remained at the high levels achieved in recent years. The country’s
prospects in attracting FDI are improving thanks to ongoing efforts to open up key economic sectors.

       Despite an overall 7% decline in FDI inflows to the Association of Southeast Asian Nations
(ASEAN), some countries in this group of economies appear to be a bright spot: preliminary data show that
inflows to Cambodia, Myanmar, the Philippines, Thailand and Viet Nam grew in 2012.

        FDI flows to West Asia did not turn around their negative trend in 2012, declining for the fourth
consecutive year. With continuing political uncertainty at the regional level, and subdued economic
prospects at the global level, foreign investors are still holding back. FDI to Saudi Arabia – the region’s
main recipient – did register an increase. Turkey, the region’s second main recipient, experienced a decline
in FDI flows due to a fall in cross-border M&As sales in 2012.

                Figure 3. FDI inflows to developing and transition economies, 2008–2012

                                                 (Billions of US dollars)


          Source: UNCTAD.
          *Asia includes East Asia, South-East Asia, South Asia and West Asia

        Latin America and the Caribbean registered positive growth in FDI in 2012. The rise was strongest
in South America due to the sub-region's economic buoyancy, leading to a significant number of market-
seeking investments, and persistent strength of commodity prices, which continue to encourage investments
in the extractive industries, particularly in Chile, Peru and Colombia. Inflows registered also strong growth in
Argentina. FDI to Brazil slowed but remained robust, confirming the country’s primacy as the leading
investment destination in the region, accounting for 28% of the total. FDI flows to Central America
decreased mainly as the result of a decline in Mexico.


                                                                                                              3
FDI flows to Africa rose in 2012. Flows to North Africa reversed their downward trend, as Egypt
saw a rebound of investment from European investors. Angola – an important holder of FDI stock in Africa
– posted lower divestments in 2012 compared with 2010 and 2011 while positive growth of FDI flows to
South Africa contributed to a rise in inward FDI flows to Southern Africa.

        Transition economies experienced a decline in FDI flows of 13%, reaching US$81 billion. FDI
flows to South-East Europe fell 52%, as a result of sluggishness of investment from EU countries, the main
investors in the region. Flows to the Commonwealth of Independent States (CIS) declined, as the rise of
FDI to Kazakhstan and Ukraine were not enough to compensate the 17% fall of FDI flows in the Russian
Federation.
                        FDI flows to developed countries plummeted
         FDI flows fell drastically in developed countries to values last seen almost ten years ago. Of the
global decline of US$300 billion in FDI inflows, from UD$1.6 trillion in 2011 to an estimated US$1.3
trillion in 2012, almost 90% was accounted for by developed countries. FDI declined sharply both in
Europe and in the United States. In Europe, Belgium and Germany saw large declines in FDI inflows. In
Belgium – which, with a drop of US$80 billion, accounted for much of the fall – FDI flows are often
volatile or inflated by the transactions of the special purpose entities (SPE). Germany posted a large decline
from US$40 billion in 2011 to only US$1 billion in 2012, due in part to large divestments. The decline of
inflows to the United States is largely explained by the fall in cross-border M&A sales; despite the fall the
country remained the largest recipient of FDI flows in the world. Elsewhere, Japan saw a net divestment for
the third successive year.

        There were a few developed countries that bucked the trend and saw FDI inflows increase, namely
France, Canada, Ireland, and the United Kingdom, although none of these increases were significant in
historic terms. With the return of stability and confidence in the Irish economy, which was severely
impacted by the banking crisis in 2008, there has been a revival of transitional corporation (TNC) activity in
the country.

         FDI flows to the Southern European countries hit by the crisis (Greece, Italy, Portugal, and Spain)
together more than halved from 2011. In Italy, where weak economic growth in 2011 turned into a
recession (an estimated contraction by 2.3%), the country saw sizable divestments and loan repayments. In
Spain inflows declined from US$29.5 billion in 2011 to US$17.5 billion in 2012. Inward FDI to Portugal
fell but remained at a relatively high level, helped by Chinese acquisitions of state assets in the energy
sector. Inward FDI to Greece remained marginal but saw a rise, mostly explained by injections of capital by
parent TNCs to cover losses of their affiliates.

   Cross-border M&As decreased sharply, but developing country investors are
                             bucking the trend
       In 2012, the value of cross-border M&As fell by 41% to the lowest activity level since 2009. The
weak M&A market reflected global macro-economic uncertainty and the resulting low corporate
confidence, especially in developed markets. In many European countries, cross-border M&A sales
decreased significantly from 2011 levels.

        Many developed countries such as the Australia, France, Luxembourg, Portugal and the United
Kingdom saw large divestments by their TNCs from assets abroad in 2012. Examples include the
divestments of ING Group in the United States and Canada for US$12 billion, and the sale by BP of a stake
in a group of oil fields in the Gulf of Mexico for US$5.6 billion. In contrast, purchases by TNCs from
developing economies reached US$115 billion, accounting for a record-high share of 37% of total world
                                                                                                            4
M&A purchases. Large deals include the acquisition by Petronas (Malaysia) of Progress Energy Resources
Corp (Canada) for US$5.4 billion, the purchase by Sinopec Group (China) of Petrogal Brasil Ltda (Brasil)
for US$4.8 billion and the purchase of Energias de Portugal SA (Portugal) by China Three Gorges Corp
(China) for US$3.5 billion. While M&A purchases by TNCs from Latin American saw the most rapid
increase (to US$28 billion), Asian investors continue to account for the lion's share (75%) of acquisitions
from developing countries (annex 2).

        The value of announced greenfield projects declined for the fourth straight year, falling by 34% to
their lowest level ever. However, the value of greenfield investments still account for two thirds of global
investments.
          Figure 4. The value of cross-border M&A sales and of greenfield investment projects,
                                                            a
                                                2005 – 2012
                                          (Billions of US dollars)


Source: UNCTAD, based on cross-border M&A database for M&As, and information from
      the Financial Times Ltd, fDi Markets (www.fDimarkets.com) for greenfield projects.
        a
          Data for 2012 are preliminary.


                       FDI prospects for 2013 and 2014: delayed recovery?
        FDI flows could rise moderately to US$1.4 trillion in 2013 and US$1.6 trillion in 2014 (table 1)
as the global economy is expected to make a hesitant and uneven recovery over the coming two years.
GDP growth, gross fixed capital formation and trade are projected to rise gradually, both at the global
level and, especially, in developing countries. Such a slight improvement in macroeconomic conditions
could prompt TNCs to transform their record levels of cash holdings into new investments. If investor
confidence returns, TNCs may also be induced to make strategic investments to cement their business
plans for the post-crisis period. In addition, possible further sales of publicly owned assets to restructure
sovereign debt may also provide FDI opportunities.

        Significant risks to this scenario persist, including structural weaknesses in major developed
economies and in the global financial system, the possible further deterioration of the macroeconomic
environment, and significant policy uncertainty in areas crucial for investor confidence, including fiscal
policy and investment regulations and restrictions. Should these risks prevail, FDI recovery could be
further delayed.

       "FDI recovery is on a bumpy road. While FDI in developing countries remained resilient, more
investment in sectors that can contribute to job creation and enhance local productive capacity is still
badly needed. Therefore promoting FDI for sustainable development remains a challenge" said
Secretary-General of UNCTAD, Dr. Supachai Panitchpakdi.


                                                                                                           5
Annex 1: FDI inflows, 2010-2012
                                        (Billions of dollars and per cent)
                                                                                                     Growth rate
Region / economy                                              2010          2011a        2012 b      2011-2012
                                                                                                         (%)
World                                                        1 381.0        1 604.2    1 310.7          -18.3
  Developed economies                                          674.9          807.8      548.9          -32.1
      Europe                                                   407.6          459.3      293.5          -36.1
        European Union                                         358.0          440.0      287.0          -34.8
          Austria                                                  0.8         14.7          5.0        -65.9
          Belgium                                                85.7         103.3        19.3         -81.3
          Czech Republic                                           6.1           5.4       10.0           84.3
          Denmark                                                - 7.4         14.8          2.1        -86.1
          France                                                 30.6          40.9        58.9           43.8
          Germany                                                46.9          40.4          1.3        -96.8
          Greece                                                   0.3           1.1         2.6        128.7
          Ireland                                                42.8          11.5        39.6         245.1
          Italy                                                    9.2         34.3          5.3        -84.7
          Luxembourg                                             27.7          14.4        22.6           57.0
          Netherlands                                            - 9.9         13.6        - 2.1             ..
          Poland                                                 13.9          18.9          4.1        -78.2
          Portugal                                                 2.6         10.4          9.2        -11.8
          Spain                                                  40.8          29.5        17.5         -40.6
          Sweden                                                 - 1.3         14.7        10.1         -31.1
          United Kingdom                                         50.6          51.1        62.5           22.2
      Switzerland                                                32.5          11.8          6.1        -48.2
      Canada                                                     29.1          41.4        47.2           14.0
      United States                                            197.9          226.9      146.7          -35.3
      Australia                                                  35.2          65.8        48.5         -26.3
      Japan                                                      - 1.3         - 1.8       - 0.4             ..
  Developing economies                                         630.9          702.7      680.4            -3.2
    Africa                                                       43.2          43.4        45.8            5.5
        Egypt                                                      6.4         - 0.5         3.5             ..
        Nigeria                                                    6.1           8.9         5.3        -40.8
        Angola                                                   - 3.2         - 5.6       - 3.1             ..
        South Africa                                               1.2           5.8         6.4          10.3
    Latin America and the Caribbean                            187.9          217.0      232.6             7.2
        Argentina                                                  7.1           8.7       11.0           27.3
        Brazil                                                   48.5          66.7        65.3           -2.0
        Chile                                                    15.4          17.3        26.4           52.7
        Colombia                                                   6.7         13.6        15.8           15.9
        Peru                                                       8.5           8.2       11.0           34.2
        Mexico                                                   21.0          20.8        17.4         -16.5
    Asia                                                       397.8          440.7      399.0            -9.5
      West Asia                                                  59.3          48.6        47.0           -3.3
        Saudi Arabia                                             29.2          16.3        18.8           15.1
        Turkey                                                     9.0         15.9        12.4         -22.1
      East Asia                                                214.6          237.5      213.1          -10.3
        China                                                  114.7          124.0      119.7            -3.4
        Hong Kong, China                                         82.7          96.1        72.5         -24.6
        Korea, Republic of                                       10.1          10.2          9.0        -11.9
      South Asia                                                 31.7          39.6        32.3         -18.4
        India                                                    24.2          31.6        27.3         -13.5
      South-East Asia                                            92.1         115.0      106.5            -7.3
        Cambodia                                                   0.8           0.9         1.8        104.3
        Indonesia                                                13.8          19.2        19.2           -0.1
        Malaysia                                                   9.1         12.0        10.0         -16.8
        Myanmar                                                    1.0           1.0         1.9          90.0
        Philippines                                                1.3           1.3         1.5          15.5
        Singapore                                                48.6          64.0        54.4         -15.1
        Thailand                                                   9.1           7.8         8.1           3.9
        Viet Nam                                                   8.0           7.4         8.4          12.5
  Transition economies                                           75.2          93.7        81.4         -13.1
    South-East Europe                                              4.6           7.2         3.5        -51.9
    Commonwealth of Independent States (CIS)                     70.6          86.5        78.0           -9.9
        Kazakhstan                                               11.6          13.7        15.6           13.4
        Russian Federation                                       43.3          52.9        44.1         -16.6
        Ukraine                                                    6.5           7.2         8.0          11.5
Source : UNCTAD.
a
  Revised.
b
  Preliminary estimates.
Note: World FDI inflows are projected on the basis of 199 economies for which data are available for part of
2012 or full year estimate, as of 16 January 2013. Data are estimated by annualizing their available data, in
most cases the first three quarters of 2012. The proportion of inflows to these economies in total inflows to their
respective region or subregion in 2011 is used to extrapolate the 2012 regional data.

                                                                                                                      6
Annex 2. Cross-border M&As, by region economy of seller/purchaser, 2011-2012
                                                (Millions of dollars)

                                        Net Sales                           Net Purchases
                                                            Growth rate                       Growth rate
       Region / economy              2011       2012        2011-2012      2011       2012    2011-2012
                                                                (%)                               (%)
World                               525 881   310 141          -41.0      525 881   310 141      -41.0
Developed economies                 409 691   258 003          -37.0      400 929   176 292      -56.0
  Europe                            200 363   135 352          -32.4      145 542    26 775      -81.6
    European Union                  172 257   119 707          -30.5      117 050       310      -99.7
      Austria                         6 928     1 938          -72.0        3 627     1 835      -49.4
      Belgium                         3 920     1 790          -54.3        7 757    -1 362           ..
      Cyprus                            780         51         -93.5        3 903     5 021       28.6
      Finland                           973     1 949          100.3        3 303     4 358       32.0
      France                         24 325    11 467          -52.9       31 804    -3 867           ..
      Germany                        12 709     8 229          -35.2        4 801    15 522      223.3
      Greece                          1 205         35         -97.1           79    -1 562           ..
      Ireland                         2 181    12 066          453.3       -6 018       774           ..
      Italy                          13 450     3 293          -75.5        4 176    -1 680           ..
      Luxembourg                      9 393     6 461          -31.2      -20 751    -6 290           ..
      Netherlands                    14 031    13 656            -2.7      19 750    -2 795           ..
      Poland                         10 043       832          -91.7          511     3 399      564.9
      Portugal                          911     8 334          815.2        2 404    -4 741           ..
      Spain                          17 298     5 246          -69.7       11 579    -2 312           ..
      United Kingdom                 35 691    35 313            -1.1      53 876    -7 678           ..
    Iceland                               0          0              ..      - 446    -2 547           ..
    Switzerland                      19 627     8 658          -55.9       17 463    16 331        -6.5
    Canada                           30 263    29 412            -2.8      40 215    39 532        -1.7
    United States                   134 103    66 259          -50.6      130 210    78 721      -39.5
    Australia                        35 460    23 086          -34.9        6 868    -4 983           ..
    Israel                            3 663       942          -74.3        8 086    -2 132           ..
    Japan                             4 991     1 278          -74.4       62 687    35 612      -43.2
Developing economies                 83 220    48 381          -41.9      103 615   114 657       10.7
  Africa                              7 205    -1 195               ..      4 812       592      -87.7
      South Africa                    5 228     - 879               ..      4 252       821      -80.7
  Latin America and the Caribbean    20 689    20 011            -3.3      18 659    28 149       50.9
      Argentina                       - 246       430               ..        102     2 799    2646.9
      Brazil                         15 422    15 299            -0.8       5 540     7 427       34.1
      Chile                             574     - 113               ..      1 083     9 764      801.6
      Colombia                        - 884     1 978               ..      4 314     2 278      -47.2
      Mexico                          1 231       331          -73.1        4 390     2 450      -44.2
  Asia                               55 302    29 580          -46.5       80 179    85 873         7.1
    East Asia                        12 575    11 983            -4.7      50 403    57 953       15.0
      China                          11 176     9 927          -11.2       34 355    37 051         7.8
      Hong Kong, China                1 028     2 787          171.2       11 293    13 237       17.2
      Korea, Republic of              2 466    -1 767               ..      4 109     5 508       34.0
    South-East Asia                  20 139    10 682          -47.0       17 563    16 409        -6.6
      Malaysia                        4 517       721          -84.0        3 909     9 293      137.7
      Thailand                          570       - 72              ..      4 996     5 448         9.0
    South Asia                       12 875     2 620          -79.6        6 078     2 658      -56.3
      India                          12 577     2 456          -80.5        6 072     2 657      -56.2
    West Asia                         9 713     4 295          -55.8        6 136     8 852       44.3
      Qatar                              28         92         222.8        - 833     5 133           ..
      Turkey                          7 348     2 690          -63.4          908     2 012      121.6
Transition economies                 32 970     3 756          -88.6       13 510     8 615      -36.2
    Russian Federation               29 705     5 617          -81.1        5 084     7 791       53.2
Sources: UNCTAD.


                                                                                                            7
The next issue of UNCTAD’s Global Investment Trends
     Monitor will be released in mid-April 2013.

The next issue of UNCTAD’s Investment Policy Monitor
           will be released in February 2013.


                                                       8

Mais conteúdo relacionado

Mais procurados

Research on relationship between china and ghana trade and foreign direct inv...
Research on relationship between china and ghana trade and foreign direct inv...Research on relationship between china and ghana trade and foreign direct inv...
Research on relationship between china and ghana trade and foreign direct inv...Alexander Decker
 
FDI fluctuations followed by GDP fluctuations in Kosovo and favoring particul...
FDI fluctuations followed by GDP fluctuations in Kosovo and favoring particul...FDI fluctuations followed by GDP fluctuations in Kosovo and favoring particul...
FDI fluctuations followed by GDP fluctuations in Kosovo and favoring particul...nakije.kida
 
BALANCE OF PAYMENTS
BALANCE OF PAYMENTSBALANCE OF PAYMENTS
BALANCE OF PAYMENTSsairajch10
 
Foreign Remittances and their Impact on the Economy of Pakistan
Foreign Remittances and their Impact on the Economy of PakistanForeign Remittances and their Impact on the Economy of Pakistan
Foreign Remittances and their Impact on the Economy of PakistanMuhammad Umair
 
Current account deficit and indian economy b.v.raghunandan
Current account deficit and indian economy b.v.raghunandanCurrent account deficit and indian economy b.v.raghunandan
Current account deficit and indian economy b.v.raghunandanSVS College
 
Mena economy, investments and the specter of the arab spring
Mena economy, investments and the specter of the arab springMena economy, investments and the specter of the arab spring
Mena economy, investments and the specter of the arab springteam-abr
 
China’s rise in global M&A: Here to stay
China’s rise in global M&A: Here to stayChina’s rise in global M&A: Here to stay
China’s rise in global M&A: Here to stayWhite & Case
 
Fdi by saurabh sharma
Fdi by saurabh sharma Fdi by saurabh sharma
Fdi by saurabh sharma 12saurabh345
 
EIBTM 2013 Trends Watch Report by Rob Davidson
EIBTM 2013 Trends Watch Report by Rob DavidsonEIBTM 2013 Trends Watch Report by Rob Davidson
EIBTM 2013 Trends Watch Report by Rob DavidsonRaúl Sánchez Tarí
 
OCR F585 Economics - Extract 2 - Globalisation and Trade Imbalances
OCR F585 Economics - Extract 2 - Globalisation and Trade ImbalancesOCR F585 Economics - Extract 2 - Globalisation and Trade Imbalances
OCR F585 Economics - Extract 2 - Globalisation and Trade Imbalancestutor2u
 
Current Account Deficit
Current Account DeficitCurrent Account Deficit
Current Account DeficitVishnu G
 
Capital Inflows and Economic Growth A Comperative Study
Capital Inflows and Economic Growth A Comperative StudyCapital Inflows and Economic Growth A Comperative Study
Capital Inflows and Economic Growth A Comperative Studyiosrjce
 

Mais procurados (19)

Remittances and Household Welfare in Pakistan
Remittances and Household Welfare in PakistanRemittances and Household Welfare in Pakistan
Remittances and Household Welfare in Pakistan
 
Research on relationship between china and ghana trade and foreign direct inv...
Research on relationship between china and ghana trade and foreign direct inv...Research on relationship between china and ghana trade and foreign direct inv...
Research on relationship between china and ghana trade and foreign direct inv...
 
Builan
BuilanBuilan
Builan
 
Remittances and Pakistan Economy
Remittances and Pakistan EconomyRemittances and Pakistan Economy
Remittances and Pakistan Economy
 
FDI fluctuations followed by GDP fluctuations in Kosovo and favoring particul...
FDI fluctuations followed by GDP fluctuations in Kosovo and favoring particul...FDI fluctuations followed by GDP fluctuations in Kosovo and favoring particul...
FDI fluctuations followed by GDP fluctuations in Kosovo and favoring particul...
 
BALANCE OF PAYMENTS
BALANCE OF PAYMENTSBALANCE OF PAYMENTS
BALANCE OF PAYMENTS
 
Foreign Remittances and their Impact on the Economy of Pakistan
Foreign Remittances and their Impact on the Economy of PakistanForeign Remittances and their Impact on the Economy of Pakistan
Foreign Remittances and their Impact on the Economy of Pakistan
 
Current account deficit and indian economy b.v.raghunandan
Current account deficit and indian economy b.v.raghunandanCurrent account deficit and indian economy b.v.raghunandan
Current account deficit and indian economy b.v.raghunandan
 
Remittances and Welfare in Pakistan
Remittances and Welfare in PakistanRemittances and Welfare in Pakistan
Remittances and Welfare in Pakistan
 
Final Draft
Final DraftFinal Draft
Final Draft
 
Mena economy, investments and the specter of the arab spring
Mena economy, investments and the specter of the arab springMena economy, investments and the specter of the arab spring
Mena economy, investments and the specter of the arab spring
 
B0362012020
B0362012020B0362012020
B0362012020
 
China’s rise in global M&A: Here to stay
China’s rise in global M&A: Here to stayChina’s rise in global M&A: Here to stay
China’s rise in global M&A: Here to stay
 
Fdi by saurabh sharma
Fdi by saurabh sharma Fdi by saurabh sharma
Fdi by saurabh sharma
 
EIBTM 2013 Trends Watch Report by Rob Davidson
EIBTM 2013 Trends Watch Report by Rob DavidsonEIBTM 2013 Trends Watch Report by Rob Davidson
EIBTM 2013 Trends Watch Report by Rob Davidson
 
OCR F585 Economics - Extract 2 - Globalisation and Trade Imbalances
OCR F585 Economics - Extract 2 - Globalisation and Trade ImbalancesOCR F585 Economics - Extract 2 - Globalisation and Trade Imbalances
OCR F585 Economics - Extract 2 - Globalisation and Trade Imbalances
 
The global economy in 2015
The global economy in 2015The global economy in 2015
The global economy in 2015
 
Current Account Deficit
Current Account DeficitCurrent Account Deficit
Current Account Deficit
 
Capital Inflows and Economic Growth A Comperative Study
Capital Inflows and Economic Growth A Comperative StudyCapital Inflows and Economic Growth A Comperative Study
Capital Inflows and Economic Growth A Comperative Study
 

Destaque

United Nations Conference on Trade and Development (UNCTAD)
United Nations Conference on Trade and Development (UNCTAD)United Nations Conference on Trade and Development (UNCTAD)
United Nations Conference on Trade and Development (UNCTAD)Suraj Sudheer
 
The United Nations Conference on Trade and Development (UNCTAD) - Internation...
The United Nations Conference on Trade and Development (UNCTAD) - Internation...The United Nations Conference on Trade and Development (UNCTAD) - Internation...
The United Nations Conference on Trade and Development (UNCTAD) - Internation...manumelwin
 
Permutation & Combination
Permutation & CombinationPermutation & Combination
Permutation & CombinationPuru Agrawal
 
General Agreement on Tariffs and Trade (GATT)
General Agreement on Tariffs and Trade (GATT)General Agreement on Tariffs and Trade (GATT)
General Agreement on Tariffs and Trade (GATT)Jean Tralala
 
Presentation on wto & india
Presentation on wto & indiaPresentation on wto & india
Presentation on wto & indiaPreeti Gulati
 
The world trade organization (wto)
The world trade organization (wto)The world trade organization (wto)
The world trade organization (wto)Tinaaz Wadia
 
Wto ppt
Wto pptWto ppt
Wto pptrk2its
 
Wto presentation
Wto presentationWto presentation
Wto presentationMamta Singh
 
Specialized Cells, Biology
Specialized Cells, BiologySpecialized Cells, Biology
Specialized Cells, Biologyfatimaalzahraa
 

Destaque (20)

United Nations Conference on Trade and Development (UNCTAD)
United Nations Conference on Trade and Development (UNCTAD)United Nations Conference on Trade and Development (UNCTAD)
United Nations Conference on Trade and Development (UNCTAD)
 
UNCTAD
UNCTADUNCTAD
UNCTAD
 
UNCTAD
UNCTADUNCTAD
UNCTAD
 
The United Nations Conference on Trade and Development (UNCTAD) - Internation...
The United Nations Conference on Trade and Development (UNCTAD) - Internation...The United Nations Conference on Trade and Development (UNCTAD) - Internation...
The United Nations Conference on Trade and Development (UNCTAD) - Internation...
 
UNCTAD (IBE)
UNCTAD (IBE)UNCTAD (IBE)
UNCTAD (IBE)
 
Unctad edited
Unctad editedUnctad edited
Unctad edited
 
UNCTAD
UNCTADUNCTAD
UNCTAD
 
Non Tarif Measures UNCTAD
Non Tarif Measures UNCTADNon Tarif Measures UNCTAD
Non Tarif Measures UNCTAD
 
Permutation & Combination
Permutation & CombinationPermutation & Combination
Permutation & Combination
 
Pagsulong at Pag-unlad
Pagsulong at Pag-unladPagsulong at Pag-unlad
Pagsulong at Pag-unlad
 
GATT Agreements
GATT Agreements GATT Agreements
GATT Agreements
 
WTO and India
WTO and IndiaWTO and India
WTO and India
 
General Agreement on Tariffs and Trade (GATT)
General Agreement on Tariffs and Trade (GATT)General Agreement on Tariffs and Trade (GATT)
General Agreement on Tariffs and Trade (GATT)
 
What is gatt
What is gattWhat is gatt
What is gatt
 
Presentation on wto & india
Presentation on wto & indiaPresentation on wto & india
Presentation on wto & india
 
The world trade organization (wto)
The world trade organization (wto)The world trade organization (wto)
The world trade organization (wto)
 
Unctad
UnctadUnctad
Unctad
 
Wto ppt
Wto pptWto ppt
Wto ppt
 
Wto presentation
Wto presentationWto presentation
Wto presentation
 
Specialized Cells, Biology
Specialized Cells, BiologySpecialized Cells, Biology
Specialized Cells, Biology
 

Semelhante a Global FDI Inflows Fall 18% in 2012

MDGs & external finance, Peter Gammeltoft, Dakar 2009
MDGs & external finance, Peter Gammeltoft, Dakar 2009MDGs & external finance, Peter Gammeltoft, Dakar 2009
MDGs & external finance, Peter Gammeltoft, Dakar 2009pgammeltoft
 
7. Foreign Direct Investment.pdf
7. Foreign Direct Investment.pdf7. Foreign Direct Investment.pdf
7. Foreign Direct Investment.pdfLAZINAAZRIN
 
Foreign Direct Investment. Political Economic Digest Series - XVI
Foreign Direct Investment. Political Economic Digest Series - XVIForeign Direct Investment. Political Economic Digest Series - XVI
Foreign Direct Investment. Political Economic Digest Series - XVIAkash Shrestha
 
QNB Group Indonesia Economic Insight 2013
QNB Group Indonesia Economic Insight 2013QNB Group Indonesia Economic Insight 2013
QNB Group Indonesia Economic Insight 2013Joannes Mongardini
 
Cambodia's outlook brief for 2013 possibilities and policy priorities for s...
Cambodia's outlook brief for 2013   possibilities and policy priorities for s...Cambodia's outlook brief for 2013   possibilities and policy priorities for s...
Cambodia's outlook brief for 2013 possibilities and policy priorities for s...Solina Yean
 
China Views ODI: The Brave New World
China Views ODI: The Brave New WorldChina Views ODI: The Brave New World
China Views ODI: The Brave New WorldShiqing Hua, MBA
 
Inward FDI in Indonesia and its policy context, 2013
Inward FDI in Indonesia and its policy context, 2013 Inward FDI in Indonesia and its policy context, 2013
Inward FDI in Indonesia and its policy context, 2013 Arita Soenarjono
 
2013_Economic_Review___Outlook
2013_Economic_Review___Outlook2013_Economic_Review___Outlook
2013_Economic_Review___OutlookOyelade Oke
 
Business-Environment-China.pdf
Business-Environment-China.pdfBusiness-Environment-China.pdf
Business-Environment-China.pdfSOUMYASINGH241628
 
BALANCE OF PAYMENTS, COMPONENTS & ECONOMIC SURVEY
BALANCE OF PAYMENTS, COMPONENTS & ECONOMIC SURVEYBALANCE OF PAYMENTS, COMPONENTS & ECONOMIC SURVEY
BALANCE OF PAYMENTS, COMPONENTS & ECONOMIC SURVEYsairajch94
 
07.2013, REPORT, Selected Macroeconomic Indicators for Mongolia, Internationa...
07.2013, REPORT, Selected Macroeconomic Indicators for Mongolia, Internationa...07.2013, REPORT, Selected Macroeconomic Indicators for Mongolia, Internationa...
07.2013, REPORT, Selected Macroeconomic Indicators for Mongolia, Internationa...The Business Council of Mongolia
 
D2112228
D2112228D2112228
D2112228aijbm
 

Semelhante a Global FDI Inflows Fall 18% in 2012 (20)

MDGs & external finance, Peter Gammeltoft, Dakar 2009
MDGs & external finance, Peter Gammeltoft, Dakar 2009MDGs & external finance, Peter Gammeltoft, Dakar 2009
MDGs & external finance, Peter Gammeltoft, Dakar 2009
 
International investment in Europe: A canary in the coal mine? - Investment I...
International investment in Europe: A canary in the coal mine? - Investment I...International investment in Europe: A canary in the coal mine? - Investment I...
International investment in Europe: A canary in the coal mine? - Investment I...
 
7. Foreign Direct Investment.pdf
7. Foreign Direct Investment.pdf7. Foreign Direct Investment.pdf
7. Foreign Direct Investment.pdf
 
Georgian enomony
Georgian enomonyGeorgian enomony
Georgian enomony
 
Foreign Direct Investment. Political Economic Digest Series - XVI
Foreign Direct Investment. Political Economic Digest Series - XVIForeign Direct Investment. Political Economic Digest Series - XVI
Foreign Direct Investment. Political Economic Digest Series - XVI
 
QNB Group Indonesia Economic Insight 2013
QNB Group Indonesia Economic Insight 2013QNB Group Indonesia Economic Insight 2013
QNB Group Indonesia Economic Insight 2013
 
Chinese investment in developed markets
Chinese investment in developed marketsChinese investment in developed markets
Chinese investment in developed markets
 
Cambodia's outlook brief for 2013 possibilities and policy priorities for s...
Cambodia's outlook brief for 2013   possibilities and policy priorities for s...Cambodia's outlook brief for 2013   possibilities and policy priorities for s...
Cambodia's outlook brief for 2013 possibilities and policy priorities for s...
 
The fdi_report_2014
The fdi_report_2014The fdi_report_2014
The fdi_report_2014
 
Nov 2013 Colliers Vietnam Investment Digest
Nov 2013 Colliers Vietnam Investment DigestNov 2013 Colliers Vietnam Investment Digest
Nov 2013 Colliers Vietnam Investment Digest
 
China Views ODI: The Brave New World
China Views ODI: The Brave New WorldChina Views ODI: The Brave New World
China Views ODI: The Brave New World
 
Inward FDI in Indonesia and its policy context, 2013
Inward FDI in Indonesia and its policy context, 2013 Inward FDI in Indonesia and its policy context, 2013
Inward FDI in Indonesia and its policy context, 2013
 
Fdi brazil
Fdi  brazilFdi  brazil
Fdi brazil
 
Fdi
FdiFdi
Fdi
 
2013_Economic_Review___Outlook
2013_Economic_Review___Outlook2013_Economic_Review___Outlook
2013_Economic_Review___Outlook
 
Business-Environment-China.pdf
Business-Environment-China.pdfBusiness-Environment-China.pdf
Business-Environment-China.pdf
 
BALANCE OF PAYMENTS, COMPONENTS & ECONOMIC SURVEY
BALANCE OF PAYMENTS, COMPONENTS & ECONOMIC SURVEYBALANCE OF PAYMENTS, COMPONENTS & ECONOMIC SURVEY
BALANCE OF PAYMENTS, COMPONENTS & ECONOMIC SURVEY
 
07.2013, REPORT, Selected Macroeconomic Indicators for Mongolia, Internationa...
07.2013, REPORT, Selected Macroeconomic Indicators for Mongolia, Internationa...07.2013, REPORT, Selected Macroeconomic Indicators for Mongolia, Internationa...
07.2013, REPORT, Selected Macroeconomic Indicators for Mongolia, Internationa...
 
Vidhu assignment
Vidhu assignmentVidhu assignment
Vidhu assignment
 
D2112228
D2112228D2112228
D2112228
 

Mais de Lilian Alvares

Trainee Industrial Ambev
Trainee Industrial AmbevTrainee Industrial Ambev
Trainee Industrial AmbevLilian Alvares
 
Trainee Industrial Ambev - 2015
Trainee Industrial Ambev - 2015Trainee Industrial Ambev - 2015
Trainee Industrial Ambev - 2015Lilian Alvares
 
Bndespar cvm dados econômico-financeiros_31-12-2012
Bndespar  cvm dados econômico-financeiros_31-12-2012Bndespar  cvm dados econômico-financeiros_31-12-2012
Bndespar cvm dados econômico-financeiros_31-12-2012Lilian Alvares
 

Mais de Lilian Alvares (7)

Trainee Industrial Ambev
Trainee Industrial AmbevTrainee Industrial Ambev
Trainee Industrial Ambev
 
Trainee Industrial Ambev - 2015
Trainee Industrial Ambev - 2015Trainee Industrial Ambev - 2015
Trainee Industrial Ambev - 2015
 
Bndespar cvm dados econômico-financeiros_31-12-2012
Bndespar  cvm dados econômico-financeiros_31-12-2012Bndespar  cvm dados econômico-financeiros_31-12-2012
Bndespar cvm dados econômico-financeiros_31-12-2012
 
Focus 13fev2013
Focus 13fev2013Focus 13fev2013
Focus 13fev2013
 
Focus -01/02/2013
Focus -01/02/2013Focus -01/02/2013
Focus -01/02/2013
 
Focus25 01
Focus25 01Focus25 01
Focus25 01
 
Projecoesfmi
ProjecoesfmiProjecoesfmi
Projecoesfmi
 

Global FDI Inflows Fall 18% in 2012

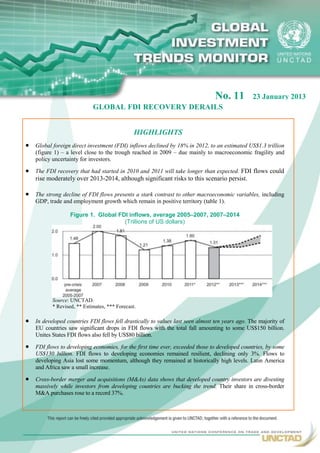
  • 1. No. 11 23 January 2013 GLOBAL FDI RECOVERY DERAILS HIGHLIGHTS  Global foreign direct investment (FDI) inflows declined by 18% in 2012, to an estimated US$1.3 trillion (figure 1) – a level close to the trough reached in 2009 – due mainly to macroeconomic fragility and policy uncertainty for investors.  The FDI recovery that had started in 2010 and 2011 will take longer than expected. FDI flows could rise moderately over 2013-2014, although significant risks to this scenario persist.  The strong decline of FDI flows presents a stark contrast to other macroeconomic variables, including GDP, trade and employment growth which remain in positive territory (table 1). Figure 1. Global FDI inflows, average 2005–2007, 2007–2014 (Trillions of US dollars) Source: UNCTAD. * Revised, ** Estimates, *** Forecast.  In developed countries FDI flows fell drastically to values last seen almost ten years ago. The majority of EU countries saw significant drops in FDI flows with the total fall amounting to some US$150 billion. Unites States FDI flows also fell by US$80 billion.  FDI flows to developing economies, for the first time ever, exceeded those to developed countries, by some US$130 billion. FDI flows to developing economies remained resilient, declining only 3%. Flows to developing Asia lost some momentum, although they remained at historically high levels. Latin America and Africa saw a small increase.  Cross-border merger and acquisitions (M&As) data shows that developed country investors are divesting massively while investors from developing countries are bucking the trend. Their share in cross-border M&A purchases rose to a record 37%. 1
  • 2. Global FDI inflows declined by one fifth in 2012 Global FDI flows fell by 18% to an estimated US$1.3 trillion, down from a revised US$1.6 trillion in 2011, as significant investor uncertainty continues to hamper the FDI recovery. This uncertainty is driven by a weakening macroeconomic environment with lower growth rates for GDP, trade, capital formation and employment (table 1), and by a number of perceived risk factors in the policy environment, related to the Eurozone crisis, the United States fiscal cliff, changes of government in a number of major economies in 2012, and broad-based policy changes with implications for FDI. Table 1. Growth rates of global GDP, GFCF, trade, employment and FDI, 2008–2014 (Per cent) Variable 2008 2009 2010 2011 2012a 2013b 2014b GDP 1.4 -2.1 4.0 2.7 2.3 2.4 3.1 Trade 3.0 -10.4 12.6 5.8 3.2 4.5 5.8 GFCF 2.3 -5.6 5.3 4.8 4.6 5.3 6.0 Employment 1.1 0.4 1.4 1.5 1.3 1.3 1.3 FDI -9.5 -33.0 14.1 16.2 -18.3 7.7 17.1 Memorandum: FDI value ( in trillions) 1.81 1.21 1.38 1.60 1.31 1.4 1.6 Source : UNCTAD based on World Bank for GDP, IMF for GFCF and Trade and ILO for employment. a Estimation. b Projections. GFCF=gross fixed capital formation. Developing countries surpassed developed countries in FDI inflows FDI flows to developing economies remained relatively resilient in 2012, reaching US$680 billion, the second highest level ever recorded. Developing economies absorbed an unprecedented US$130 billion more than developed countries (figure 2). Figure 2. Global FDI inflows, developed, developing and transition economies, 2000–2012 (Billions of US dollars) Source: UNCTAD. 2
  • 3. FDI inflows to developing Asia fell by 9.5% as a result of declines across most sub-regions and major economies, including China, Hong Kong (China), India, the Republic of Korea, Singapore and Turkey. However, 2012 inflows to Asia were still at the second highest level recorded, accounting for 59% of FDI flows to developing countries. FDI flows to China declined slightly but the country continues to be a major FDI recipient – the second largest in the world. FDI inflows to China declined by only 3.4% to $120 billion in 2012, despite a strong downward pressure on FDI in manufacturing caused by rising production costs and weakening export markets. The 7.8% growth of the Chinese economy helped maintain investor confidence. FDI to India declined by 14%, although it remained at the high levels achieved in recent years. The country’s prospects in attracting FDI are improving thanks to ongoing efforts to open up key economic sectors. Despite an overall 7% decline in FDI inflows to the Association of Southeast Asian Nations (ASEAN), some countries in this group of economies appear to be a bright spot: preliminary data show that inflows to Cambodia, Myanmar, the Philippines, Thailand and Viet Nam grew in 2012. FDI flows to West Asia did not turn around their negative trend in 2012, declining for the fourth consecutive year. With continuing political uncertainty at the regional level, and subdued economic prospects at the global level, foreign investors are still holding back. FDI to Saudi Arabia – the region’s main recipient – did register an increase. Turkey, the region’s second main recipient, experienced a decline in FDI flows due to a fall in cross-border M&As sales in 2012. Figure 3. FDI inflows to developing and transition economies, 2008–2012 (Billions of US dollars) Source: UNCTAD. *Asia includes East Asia, South-East Asia, South Asia and West Asia Latin America and the Caribbean registered positive growth in FDI in 2012. The rise was strongest in South America due to the sub-region's economic buoyancy, leading to a significant number of market- seeking investments, and persistent strength of commodity prices, which continue to encourage investments in the extractive industries, particularly in Chile, Peru and Colombia. Inflows registered also strong growth in Argentina. FDI to Brazil slowed but remained robust, confirming the country’s primacy as the leading investment destination in the region, accounting for 28% of the total. FDI flows to Central America decreased mainly as the result of a decline in Mexico. 3
  • 4. FDI flows to Africa rose in 2012. Flows to North Africa reversed their downward trend, as Egypt saw a rebound of investment from European investors. Angola – an important holder of FDI stock in Africa – posted lower divestments in 2012 compared with 2010 and 2011 while positive growth of FDI flows to South Africa contributed to a rise in inward FDI flows to Southern Africa. Transition economies experienced a decline in FDI flows of 13%, reaching US$81 billion. FDI flows to South-East Europe fell 52%, as a result of sluggishness of investment from EU countries, the main investors in the region. Flows to the Commonwealth of Independent States (CIS) declined, as the rise of FDI to Kazakhstan and Ukraine were not enough to compensate the 17% fall of FDI flows in the Russian Federation. FDI flows to developed countries plummeted FDI flows fell drastically in developed countries to values last seen almost ten years ago. Of the global decline of US$300 billion in FDI inflows, from UD$1.6 trillion in 2011 to an estimated US$1.3 trillion in 2012, almost 90% was accounted for by developed countries. FDI declined sharply both in Europe and in the United States. In Europe, Belgium and Germany saw large declines in FDI inflows. In Belgium – which, with a drop of US$80 billion, accounted for much of the fall – FDI flows are often volatile or inflated by the transactions of the special purpose entities (SPE). Germany posted a large decline from US$40 billion in 2011 to only US$1 billion in 2012, due in part to large divestments. The decline of inflows to the United States is largely explained by the fall in cross-border M&A sales; despite the fall the country remained the largest recipient of FDI flows in the world. Elsewhere, Japan saw a net divestment for the third successive year. There were a few developed countries that bucked the trend and saw FDI inflows increase, namely France, Canada, Ireland, and the United Kingdom, although none of these increases were significant in historic terms. With the return of stability and confidence in the Irish economy, which was severely impacted by the banking crisis in 2008, there has been a revival of transitional corporation (TNC) activity in the country. FDI flows to the Southern European countries hit by the crisis (Greece, Italy, Portugal, and Spain) together more than halved from 2011. In Italy, where weak economic growth in 2011 turned into a recession (an estimated contraction by 2.3%), the country saw sizable divestments and loan repayments. In Spain inflows declined from US$29.5 billion in 2011 to US$17.5 billion in 2012. Inward FDI to Portugal fell but remained at a relatively high level, helped by Chinese acquisitions of state assets in the energy sector. Inward FDI to Greece remained marginal but saw a rise, mostly explained by injections of capital by parent TNCs to cover losses of their affiliates. Cross-border M&As decreased sharply, but developing country investors are bucking the trend In 2012, the value of cross-border M&As fell by 41% to the lowest activity level since 2009. The weak M&A market reflected global macro-economic uncertainty and the resulting low corporate confidence, especially in developed markets. In many European countries, cross-border M&A sales decreased significantly from 2011 levels. Many developed countries such as the Australia, France, Luxembourg, Portugal and the United Kingdom saw large divestments by their TNCs from assets abroad in 2012. Examples include the divestments of ING Group in the United States and Canada for US$12 billion, and the sale by BP of a stake in a group of oil fields in the Gulf of Mexico for US$5.6 billion. In contrast, purchases by TNCs from developing economies reached US$115 billion, accounting for a record-high share of 37% of total world 4
  • 5. M&A purchases. Large deals include the acquisition by Petronas (Malaysia) of Progress Energy Resources Corp (Canada) for US$5.4 billion, the purchase by Sinopec Group (China) of Petrogal Brasil Ltda (Brasil) for US$4.8 billion and the purchase of Energias de Portugal SA (Portugal) by China Three Gorges Corp (China) for US$3.5 billion. While M&A purchases by TNCs from Latin American saw the most rapid increase (to US$28 billion), Asian investors continue to account for the lion's share (75%) of acquisitions from developing countries (annex 2). The value of announced greenfield projects declined for the fourth straight year, falling by 34% to their lowest level ever. However, the value of greenfield investments still account for two thirds of global investments. Figure 4. The value of cross-border M&A sales and of greenfield investment projects, a 2005 – 2012 (Billions of US dollars) Source: UNCTAD, based on cross-border M&A database for M&As, and information from the Financial Times Ltd, fDi Markets (www.fDimarkets.com) for greenfield projects. a Data for 2012 are preliminary. FDI prospects for 2013 and 2014: delayed recovery? FDI flows could rise moderately to US$1.4 trillion in 2013 and US$1.6 trillion in 2014 (table 1) as the global economy is expected to make a hesitant and uneven recovery over the coming two years. GDP growth, gross fixed capital formation and trade are projected to rise gradually, both at the global level and, especially, in developing countries. Such a slight improvement in macroeconomic conditions could prompt TNCs to transform their record levels of cash holdings into new investments. If investor confidence returns, TNCs may also be induced to make strategic investments to cement their business plans for the post-crisis period. In addition, possible further sales of publicly owned assets to restructure sovereign debt may also provide FDI opportunities. Significant risks to this scenario persist, including structural weaknesses in major developed economies and in the global financial system, the possible further deterioration of the macroeconomic environment, and significant policy uncertainty in areas crucial for investor confidence, including fiscal policy and investment regulations and restrictions. Should these risks prevail, FDI recovery could be further delayed. "FDI recovery is on a bumpy road. While FDI in developing countries remained resilient, more investment in sectors that can contribute to job creation and enhance local productive capacity is still badly needed. Therefore promoting FDI for sustainable development remains a challenge" said Secretary-General of UNCTAD, Dr. Supachai Panitchpakdi. 5
  • 6. Annex 1: FDI inflows, 2010-2012 (Billions of dollars and per cent) Growth rate Region / economy 2010 2011a 2012 b 2011-2012 (%) World 1 381.0 1 604.2 1 310.7 -18.3 Developed economies 674.9 807.8 548.9 -32.1 Europe 407.6 459.3 293.5 -36.1 European Union 358.0 440.0 287.0 -34.8 Austria 0.8 14.7 5.0 -65.9 Belgium 85.7 103.3 19.3 -81.3 Czech Republic 6.1 5.4 10.0 84.3 Denmark - 7.4 14.8 2.1 -86.1 France 30.6 40.9 58.9 43.8 Germany 46.9 40.4 1.3 -96.8 Greece 0.3 1.1 2.6 128.7 Ireland 42.8 11.5 39.6 245.1 Italy 9.2 34.3 5.3 -84.7 Luxembourg 27.7 14.4 22.6 57.0 Netherlands - 9.9 13.6 - 2.1 .. Poland 13.9 18.9 4.1 -78.2 Portugal 2.6 10.4 9.2 -11.8 Spain 40.8 29.5 17.5 -40.6 Sweden - 1.3 14.7 10.1 -31.1 United Kingdom 50.6 51.1 62.5 22.2 Switzerland 32.5 11.8 6.1 -48.2 Canada 29.1 41.4 47.2 14.0 United States 197.9 226.9 146.7 -35.3 Australia 35.2 65.8 48.5 -26.3 Japan - 1.3 - 1.8 - 0.4 .. Developing economies 630.9 702.7 680.4 -3.2 Africa 43.2 43.4 45.8 5.5 Egypt 6.4 - 0.5 3.5 .. Nigeria 6.1 8.9 5.3 -40.8 Angola - 3.2 - 5.6 - 3.1 .. South Africa 1.2 5.8 6.4 10.3 Latin America and the Caribbean 187.9 217.0 232.6 7.2 Argentina 7.1 8.7 11.0 27.3 Brazil 48.5 66.7 65.3 -2.0 Chile 15.4 17.3 26.4 52.7 Colombia 6.7 13.6 15.8 15.9 Peru 8.5 8.2 11.0 34.2 Mexico 21.0 20.8 17.4 -16.5 Asia 397.8 440.7 399.0 -9.5 West Asia 59.3 48.6 47.0 -3.3 Saudi Arabia 29.2 16.3 18.8 15.1 Turkey 9.0 15.9 12.4 -22.1 East Asia 214.6 237.5 213.1 -10.3 China 114.7 124.0 119.7 -3.4 Hong Kong, China 82.7 96.1 72.5 -24.6 Korea, Republic of 10.1 10.2 9.0 -11.9 South Asia 31.7 39.6 32.3 -18.4 India 24.2 31.6 27.3 -13.5 South-East Asia 92.1 115.0 106.5 -7.3 Cambodia 0.8 0.9 1.8 104.3 Indonesia 13.8 19.2 19.2 -0.1 Malaysia 9.1 12.0 10.0 -16.8 Myanmar 1.0 1.0 1.9 90.0 Philippines 1.3 1.3 1.5 15.5 Singapore 48.6 64.0 54.4 -15.1 Thailand 9.1 7.8 8.1 3.9 Viet Nam 8.0 7.4 8.4 12.5 Transition economies 75.2 93.7 81.4 -13.1 South-East Europe 4.6 7.2 3.5 -51.9 Commonwealth of Independent States (CIS) 70.6 86.5 78.0 -9.9 Kazakhstan 11.6 13.7 15.6 13.4 Russian Federation 43.3 52.9 44.1 -16.6 Ukraine 6.5 7.2 8.0 11.5 Source : UNCTAD. a Revised. b Preliminary estimates. Note: World FDI inflows are projected on the basis of 199 economies for which data are available for part of 2012 or full year estimate, as of 16 January 2013. Data are estimated by annualizing their available data, in most cases the first three quarters of 2012. The proportion of inflows to these economies in total inflows to their respective region or subregion in 2011 is used to extrapolate the 2012 regional data. 6
  • 7. Annex 2. Cross-border M&As, by region economy of seller/purchaser, 2011-2012 (Millions of dollars) Net Sales Net Purchases Growth rate Growth rate Region / economy 2011 2012 2011-2012 2011 2012 2011-2012 (%) (%) World 525 881 310 141 -41.0 525 881 310 141 -41.0 Developed economies 409 691 258 003 -37.0 400 929 176 292 -56.0 Europe 200 363 135 352 -32.4 145 542 26 775 -81.6 European Union 172 257 119 707 -30.5 117 050 310 -99.7 Austria 6 928 1 938 -72.0 3 627 1 835 -49.4 Belgium 3 920 1 790 -54.3 7 757 -1 362 .. Cyprus 780 51 -93.5 3 903 5 021 28.6 Finland 973 1 949 100.3 3 303 4 358 32.0 France 24 325 11 467 -52.9 31 804 -3 867 .. Germany 12 709 8 229 -35.2 4 801 15 522 223.3 Greece 1 205 35 -97.1 79 -1 562 .. Ireland 2 181 12 066 453.3 -6 018 774 .. Italy 13 450 3 293 -75.5 4 176 -1 680 .. Luxembourg 9 393 6 461 -31.2 -20 751 -6 290 .. Netherlands 14 031 13 656 -2.7 19 750 -2 795 .. Poland 10 043 832 -91.7 511 3 399 564.9 Portugal 911 8 334 815.2 2 404 -4 741 .. Spain 17 298 5 246 -69.7 11 579 -2 312 .. United Kingdom 35 691 35 313 -1.1 53 876 -7 678 .. Iceland 0 0 .. - 446 -2 547 .. Switzerland 19 627 8 658 -55.9 17 463 16 331 -6.5 Canada 30 263 29 412 -2.8 40 215 39 532 -1.7 United States 134 103 66 259 -50.6 130 210 78 721 -39.5 Australia 35 460 23 086 -34.9 6 868 -4 983 .. Israel 3 663 942 -74.3 8 086 -2 132 .. Japan 4 991 1 278 -74.4 62 687 35 612 -43.2 Developing economies 83 220 48 381 -41.9 103 615 114 657 10.7 Africa 7 205 -1 195 .. 4 812 592 -87.7 South Africa 5 228 - 879 .. 4 252 821 -80.7 Latin America and the Caribbean 20 689 20 011 -3.3 18 659 28 149 50.9 Argentina - 246 430 .. 102 2 799 2646.9 Brazil 15 422 15 299 -0.8 5 540 7 427 34.1 Chile 574 - 113 .. 1 083 9 764 801.6 Colombia - 884 1 978 .. 4 314 2 278 -47.2 Mexico 1 231 331 -73.1 4 390 2 450 -44.2 Asia 55 302 29 580 -46.5 80 179 85 873 7.1 East Asia 12 575 11 983 -4.7 50 403 57 953 15.0 China 11 176 9 927 -11.2 34 355 37 051 7.8 Hong Kong, China 1 028 2 787 171.2 11 293 13 237 17.2 Korea, Republic of 2 466 -1 767 .. 4 109 5 508 34.0 South-East Asia 20 139 10 682 -47.0 17 563 16 409 -6.6 Malaysia 4 517 721 -84.0 3 909 9 293 137.7 Thailand 570 - 72 .. 4 996 5 448 9.0 South Asia 12 875 2 620 -79.6 6 078 2 658 -56.3 India 12 577 2 456 -80.5 6 072 2 657 -56.2 West Asia 9 713 4 295 -55.8 6 136 8 852 44.3 Qatar 28 92 222.8 - 833 5 133 .. Turkey 7 348 2 690 -63.4 908 2 012 121.6 Transition economies 32 970 3 756 -88.6 13 510 8 615 -36.2 Russian Federation 29 705 5 617 -81.1 5 084 7 791 53.2 Sources: UNCTAD. 7
  • 8. The next issue of UNCTAD’s Global Investment Trends Monitor will be released in mid-April 2013. The next issue of UNCTAD’s Investment Policy Monitor will be released in February 2013. 8