Mais conteúdo relacionado Semelhante a Market research for Central (11) 1. CLEVELAND NEIGHBORHOOD MARKET DRILLDOWN PROFILE
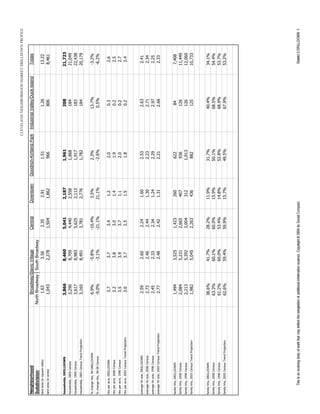
Neighborhood Broadway/Slavic Village Central Downtown Goodrich-Kirtland Park Industrial Valley/Duck Island Totals
Subdivision North Broadway South Broadway
land area (in square miles) 1.63 3.56 2.35 2.91 1.51 1.26 13.22
land area (in acres) 1,043 2,278 1,504 1,862 966 806 8,461
households, DRILLDOWN 3,866 8,460 5,041 2,187 1,961 208 21,723
households, 2000 Census 3,290 8,709 4,440 2,558 1,868 184 21,049
households, 1990 Census 3,617 8,983 5,625 2,113 1,917 183 22,438
households, 2003 Census Trend Projection 3,165 8,491 3,781 2,776 1,782 184 20,179
% change hhs, 90-DRILLDOWN 6.9% -5.8% -10.4% 3.5% 2.3% 13.7% -3.2%
% change hhs, 90-00 Census -9.0% -3.1% -21.1% 21.1% -2.6% 0.5% -6.2%
hhs per acre, DRILLDOWN 3.7 3.7 3.4 1.2 2.0 0.3 2.6
hhs per acre, 2000 Census 3.2 3.8 3.0 1.4 1.9 0.2 2.5
hhs per acre, 1990 Census 3.5 3.9 3.7 1.1 2.0 0.2 2.7
hhs per acre, 2003 Census Trend Projection 3.0 3.7 2.5 1.5 1.8 0.2 2.4
average hh size, DRILLDOWN 2.59 2.60 2.24 1.60 2.53 2.63 2.41
average hh size, 2000 Census 2.73 2.46 2.44 1.30 2.23 2.71 2.34
average hh size, 1990 Census 2.45 2.33 2.34 1.24 2.29 2.97 2.25
average hh size, 2003 Census Trend Projection 2.77 2.48 2.42 1.31 2.21 2.66 2.33
family hhs, DRILLDOWN 1,494 3,525 1,423 260 622 84 7,408
family hhs, 2000 Census 2,084 5,231 2,665 407 936 126 11,449
family hhs, 1990 Census 2,213 5,392 3,004 312 1,013 126 12,060
family hhs, 2003 Census Trend Projection 1,982 5,045 2,263 436 882 125 10,733
family hhs, DRILLDOWN 38.6% 41.7% 28.2% 11.9% 31.7% 40.4% 34.1%
family hhs, 2000 Census 63.3% 60.1% 60.0% 15.9% 50.1% 68.5% 54.4%
family hhs, 1990 Census 61.2% 60.0% 53.4% 14.8% 52.8% 68.9% 53.7%
family hhs, 2003 Census Trend Projection 62.6% 59.4% 59.9% 15.7% 49.5% 67.9% 53.2%
This is an evolving body of work that may reflect the integration of additional information sources. Copyright © 2004 by Social Compact District 3 DRILLDOWN -1
2. CLEVELAND NEIGHBORHOOD MARKET DRILLDOWN PROFILE
Neighborhood Broadway/Slavic Village Central Downtown Goodrich-Kirtland Park Industrial Valley/Duck Island Totals
Subdivision North Broadway South Broadway
population, DRILLDOWN 10,092 22,099 12,548 6,145 5,098 1,164 57,146
population, 2000 Census 9,049 21,475 12,107 5,960 4,295 1,116 54,002
population, 1990 Census 8,852 20,958 13,788 4,651 4,506 543 53,298
population, 2003 Census Trend Projection 8,853 21,170 10,333 6,271 4,059 1,107 51,793
% change pop, 90-DRILLDOWN 14.0% 5.4% -9.0% 32.1% 13.1% 114.4% 7.2%
% change pop, 90-00 Census 2.2% 2.5% -12.2% 28.1% -4.7% 105.5% 1.3%
pop per acre, DRILLDOWN 9.7 9.7 8.3 3.3 5.3 1.4 6.8
pop per acre, 2000 Census 8.7 9.4 8.0 3.2 4.4 1.4 6.4
pop per acre, 1990 Census 8.5 9.2 9.2 2.5 4.7 0.7 6.3
pop per acre, 2003 Census Trend Projection 8.5 9.3 6.9 3.4 4.2 1.4 6.1
age under 18 years, DRILLDOWN 1,587 3,405 2,005 135 627 82 7,841
age under 18 years, 2000 Census 3,449 6,781 5,485 550 1,021 151 17,437
age under 18 years, 1990 Census 2,758 5,587 5,639 371 1,109 186 15,650
age under 18 years, DRILLDOWN 15.7% 15.4% 16.0% 2.2% 12.3% 7.0% 13.7%
age under 18 years, 2000 Census 38.1% 31.6% 45.3% 9.2% 23.8% 13.5% 32.3%
age under 18 years, 1990 Census 31.2% 26.7% 40.9% 8.0% 24.6% 34.3% 29.4%
age over 64 years, DRILLDOWN 1,603 3,723 1,385 630 988 84 8,413
age over 64 years, 2000 Census 1,021 2,316 888 445 703 47 5,420
age over 64 years, 1990 Census 1,331 3,379 1,357 946 801 56 7,870
age over 64 years, DRILLDOWN 15.9% 16.8% 11.0% 10.3% 19.4% 7.2% 14.7%
age over 64 years, 2000 Census 11.3% 10.8% 7.3% 7.5% 16.4% 4.2% 10.0%
age over 64 years, 1990 Census 15.0% 16.1% 9.8% 20.3% 17.8% 10.3% 14.8%
hhs no credit history 1,749 2,991 2,866 1,070 847 84 9,608
hhs no credit history 45.3% 35.4% 56.9% 48.9% 43.2% 40.5% 44.2%
hhs no bankcard 1,590 2,791 2,613 956 763 87 8,801
hhs no bankcard 41.1% 33.0% 51.8% 43.7% 38.9% 41.9% 40.5%
This is an evolving body of work that may reflect the integration of additional information sources. Copyright © 2004 by Social Compact District 3 DRILLDOWN -2
3. CLEVELAND NEIGHBORHOOD MARKET DRILLDOWN PROFILE
Neighborhood Broadway/Slavic Village Central Downtown Goodrich-Kirtland Park Industrial Valley/Duck Island Totals
Subdivision North Broadway South Broadway
Income
income $50K+, DRILLDOWN 399 1433 362 789 163 46 3,192
hhs income $50K+, 2000 Census 422 1,703 260 721 138 58 3,302
hhs income $50K+, 1990 Census 192 637 75 370 108 9 1,391
hhs income $50K+, 2003 Census Trend Projection 468 1,734 262 870 161 86 3,581
income $50K+, DRILLDOWN 10.3% 16.9% 7.2% 36.1% 8.3% 22.0% 14.7%
hhs income $50K+, 2000 Census 12.8% 19.6% 5.9% 28.2% 7.4% 31.5% 15.7%
hhs income $50K+, 1990 Census 5.3% 7.1% 1.3% 17.5% 5.6% 4.9% 6.2%
hhs income $50K+, 2003 Census Trend Projection 14.8% 20.4% 6.9% 31.3% 9.0% 46.7% 17.7%
median income, DRILLDOWN $18,838 $27,887 $11,309 $37,458 $17,312 $21,235 $23,047
median income, 2000 Census $21,366 $26,256 $8,657 $26,285 $18,043 $33,929 $17,376
median income, 1990 Census $17,841 $18,452 $9,979 $10,029 $12,565 $10,188 $13,247
1990 inflation adjusted for 2000 $23,506 $24,311 $13,148 $13,213 $16,555 $13,423 $17,453
1990 inflation adjusted for 2002 $24,502 $25,341 $13,705 $13,774 $17,256 $13,992 $18,193
median income, 2003 Census Trend Projection $22,746 $26,695 $14,588 $25,345 $23,384 $21,000 $22,293
% change from 90, DRILLDOWN 5.6% 51.1% 13.3% 273.5% 37.8% 108.4% 74.0%
% change from 90, 2000 Census 19.8% 42.3% -13.2% 162.1% 43.6% 233.0% 31.2%
% change from 90, inflation '00 31.8% 31.8% 31.8% 31.8% 31.8% 31.8% 31.8%
% change from 90, inflation '02 37.3% 37.3% 37.3% 37.3% 37.3% 37.3% 37.3%
% change from 90, Census Trend Projection '03 27.5% 44.7% 46.2% 152.7% 86.1% 106.1% 68.3%
DRILLDOWN, diff from Census '00 -11.8% 6.2% 30.6% 42.5% -4.1% -37.4% 32.6%
DRILLDOWN, diff from Census Trend Projection '03 -17.2% 4.5% -22.5% 47.8% -26.0% 1.1% 3.4%
avg income, DRILLDOWN (unadj.) $25,143 $31,889 $17,773 $48,600 $23,812 $31,279 $28,360
avg income (w/ cash econ) $28,738 $36,450 $20,315 $55,549 $27,217 $35,752 $32,416
avg income, 2000 Census $29,303 $34,051 $15,005 $37,582 $22,757 $36,970 $28,744
avg income, 1990 Census $27,373 $32,551 $10,547 $131,322 $22,681 $28,403 $34,624
1990 inflation adjusted for 2000 $36,064 $42,886 $13,895 $173,020 $29,883 $37,422 $45,618
1990 inflation adjusted for 2002 $37,593 $44,704 $14,485 $180,354 $31,150 $39,008 $47,552
avg income, 2003 Census Trend Projection $31,201 $32,190 $17,067 $48,159 $25,696 $50,204 $30,989
This is an evolving body of work that may reflect the integration of additional information sources. Copyright © 2004 by Social Compact District 3 DRILLDOWN -3
4. CLEVELAND NEIGHBORHOOD MARKET DRILLDOWN PROFILE
Neighborhood Broadway/Slavic Village Central Downtown Goodrich-Kirtland Park Industrial Valley/Duck Island Totals
Subdivision North Broadway South Broadway
Income (continued)
cash economy (%), DRILLDOWN 14.3% 14.3% 14.3% 14.3% 14.3% 14.3% 14.3%
cash economy ($), DRILLDOWN $13,899,749 $38,579,209 $12,812,242 $15,199,061 $6,677,486 $930,377 $88,098,126
aggregate buying power $77,659,455 $215,546,359 $71,583,432 $84,918,855 $37,307,862 $5,198,122 $492,214,085
agg. income, DRILLDOWN $97,201,045 $269,784,680 $89,596,101 $106,287,141 $46,695,707 $6,506,135 $616,070,809
adjusted agg. income, DRILLDOWN $111,100,794 $308,363,889 $102,408,343 $121,486,202 $53,373,193 $7,436,512 $704,168,935
agg. income, 2000 Census $96,405,300 $296,550,100 $66,623,106 $96,135,000 $42,509,500 $6,802,400 $605,025,406
agg. income, 1990 Census $99,007,147 $292,402,390 $59,324,936 $277,483,608 $43,479,535 $5,197,749 $776,895,365
agg. income, 2003 Census Trend Projection $98,752,501 $273,322,502 $64,530,000 $133,690,003 $45,790,000 $9,237,500 $625,322,506
agg income/acre, DRILLDOWN $93,176 $118,410 $59,572 $57,070 $48,319 $8,068 $72,815
adj. agg income/acre, DRILLDOWN $106,500 $135,342 $68,091 $65,231 $55,229 $9,222 $83,227
agg income/acre, 2000 Census $92,413 $130,157 $44,297 $51,619 $43,987 $8,436 $71,509
agg income/acre, 1990 Census $94,907 $128,337 $39,445 $148,992 $44,991 $6,446 $91,823
agg income/acre, 2003 Census Trend Projection $94,663 $119,962 $42,906 $71,784 $47,382 $11,455 $73,908
agg income/sq. mile, DRILLDOWN $59,632,543 $75,782,213 $38,126,000 $36,524,791 $30,924,309 $5,163,599 $46,601,423
adj. agg income/sq. mile, DRILLDOWN $68,159,997 $86,619,070 $43,578,018 $41,747,836 $35,346,485 $5,901,994 $53,265,426
agg income/sq. mile, 2000 Census $59,144,356 $83,300,590 $28,350,258 $33,036,082 $28,151,987 $5,398,730 $45,765,916
agg income/sq. mile 1990 Census $60,740,581 $82,135,503 $25,244,654 $95,355,192 $28,794,394 $4,125,198 $58,766,669
agg income/sq. mile, 2003 Census Trend Projection $60,584,356 $76,775,984 $27,459,574 $45,941,582 $30,324,503 $7,331,349 $47,301,249
Housing Costs
March 2002 hrough August 2003
number of single-unit home sales 110 299 15 12 27 8 471
median value, DRILLDOWN $62,000 $58,500 $73,000 $114,000 $61,500 $63,500 $60,000
med home value, 2000 Census $42,449 $57,543 $73,269 $145,833 $45,474 $32,000 $48,733
med home value, 1990 Census $20,878 $32,063 $18,027 $21,953 $17,939 $6,278 $22,033
1990 inflation adjusted for 2000 $27,507 $42,244 $23,751 $28,924 $23,635 $8,271 $29,029
1990 inflation adjusted for 2002 $28,673 $44,034 $24,758 $30,150 $24,637 $8,622 $30,260
med home value, 2003 Census Trend Projection $56,940 $62,203 $27,061 $36,193 $36,152 $42,255 $40,403
This is an evolving body of work that may reflect the integration of additional information sources. Copyright © 2004 by Social Compact District 3 DRILLDOWN -4
5. CLEVELAND NEIGHBORHOOD MARKET DRILLDOWN PROFILE
Neighborhood Broadway/Slavic Village Central Downtown Goodrich-Kirtland Park Industrial Valley/Duck Island Totals
Subdivision North Broadway South Broadway
Housing Costs (continued)
% change from 90, DRILLDOWN 197.0% 82.5% 304.9% 419.3% 242.8% 911.5% 172.3%
% change from 90, 2000 Census 103.3% 79.5% 306.4% 564.3% 153.5% 409.7% 121.2%
% change from 90, inflation '00 31.8% 31.8% 31.8% 31.8% 31.8% 31.8% 31.8%
% change from 90, Census Trend Projection '03 172.7% 94.0% 50.1% 64.9% 101.5% 573.1% 83.4%
DRILLDOWN, diff from Census '00 46.1% 1.7% -0.4% -21.8% 35.2% 98.4% 23.1%
DRILLDOWN, diff from Census Trend Projection '03 8.9% -6.0% 169.8% 215.0% 70.1% 50.3% 48.5%
Distribution of Housing Values
DRILLDOWN Home Values
$300K+ 4.5% 1.0% 0.0% 0.0% 7.4% 37.5% 2.8%
$200-299.9K 0.0% 0.0% 13.3% 8.3% 7.4% 0.0% 1.1%
$150-199.9K 0.0% 1.0% 0.0% 16.7% 0.0% 0.0% 1.1%
$125-$149.9K 2.7% 1.0% 13.3% 16.7% 0.0% 0.0% 2.1%
$100-$124.9K 0.0% 1.3% 0.0% 33.3% 7.4% 0.0% 2.1%
$70-$99.9K 29.1% 32.8% 33.3% 25.0% 11.1% 0.0% 29.9%
under $70K 63.6% 62.9% 40.0% 0.0% 66.7% 62.5% 60.9%
2000 Census Home Values
$300K+ 1.0% 1.0% 0.0% 100.0% 0.0% 0.0% 1.2%
$200-299.9K 0.0% 1.7% 0.0% 0.0% 0.0% 0.0% 1.1%
$150-199.9K 0.5% 0.9% 0.0% 0.0% 0.0% 0.0% 0.7%
$100-$149.9K 1.9% 1.7% 33.5% 0.0% 7.8% 0.0% 3.6%
under $100K 96.6% 94.7% 66.5% 0.0% 92.2% 100.0% 93.3%
This is an evolving body of work that may reflect the integration of additional information sources. Copyright © 2004 by Social Compact District 3 DRILLDOWN -5
6. CLEVELAND NEIGHBORHOOD MARKET DRILLDOWN PROFILE
Neighborhood Broadway/Slavic Village Central Downtown Goodrich-Kirtland Park Industrial Valley/Duck Island Totals
Subdivision North Broadway South Broadway
Distribution of Housing Values (continued)
1990 Census Home Values
$300K+ 0.0% 0.0% 0.0% 5.0% 0.0% 0.0% 0.0%
$200-299.9K 0.0% 0.1% 0.0% 5.0% 0.0% 0.0% 0.1%
$150-199.9K 0.1% 0.1% 0.6% 5.0% 0.0% 0.0% 0.1%
$100-$149.9K 0.0% 1.0% 6.3% 0.0% 1.0% 0.0% 0.9%
under $100K 99.9% 98.9% 93.2% 85.0% 99.0% 100.0% 98.9%
2003 Census Trend Projection Home Values
$300K+ 0.8% 0.7% 3.3% 18.9% 0.0% 0.0% 0.9%
$200-299.9K 0.8% 2.1% 2.8% 21.6% 0.0% 0.0% 1.9%
$100-199.9K 2.8% 4.9% 4.7% 37.8% 5.3% 3.9% 4.8%
under $100K 95.7% 92.3% 89.1% 21.6% 94.7% 96.1% 92.3%
Housing Units
Total Units, DRILLDOWN 3,935 8,612 5,495 2,208 2,089 214 22,553
Total Units, 2000 Census 3,955 9,878 5,441 3,813 2,194 210 25,491
Total Units, 1990 Census 4,173 10,141 7,948 2,573 2,265 218 27,318
Vacant Units, DRILLDOWN 69 152 454 21 128 6 830
Vacant Units, 2000 Census 665 1,169 1,001 1,255 326 26 4,442
Vacant Units, 1990 Census 556 1,158 2,323 460 348 35 4,880
Vacant Units, DRILLDOWN 1.8% 1.8% 8.3% 1.0% 6.1% 2.8% 3.7%
Vacant Units, 2000 Census 16.8% 11.8% 18.4% 32.9% 14.9% 12.4% 17.4%
Vacant Units, 1990 Census 13.3% 11.4% 29.2% 17.9% 15.4% 16.1% 17.9%
Occupied Units, DRILLDOWN 3,866 8,460 5,041 2,187 1,961 208 21,723
Occupied Units, 2000 Census 3,290 8,709 4,440 2,558 1,868 184 21,049
Occupied Units, 1990 Census 3,617 8,983 5,625 2,113 1,917 183 22,438
This is an evolving body of work that may reflect the integration of additional information sources. Copyright © 2004 by Social Compact District 3 DRILLDOWN -6
7. CLEVELAND NEIGHBORHOOD MARKET DRILLDOWN PROFILE
Neighborhood Broadway/Slavic Village Central Downtown Goodrich-Kirtland Park Industrial Valley/Duck Island Totals
Subdivision North Broadway South Broadway
Housing Units (continued)
Owner Occupied DRILLDOWN 1,862 4,750 514 153 792 104 8,175
Owner Occupied, 2000 Census 1,514 4,451 363 67 582 77 7,054
Owner Occupied, 1990 Census 1,795 4,812 338 57 683 86 7,771
Owner Occupied, DRILLDOWN 48.2% 56.1% 10.2% 7.0% 40.4% 50.0% 37.6%
Owner Occupied, 2000 Census 46.0% 51.1% 8.2% 2.6% 31.2% 41.8% 33.5%
Owner Occupied, 1990 Census 49.6% 53.6% 6.0% 2.7% 35.6% 47.0% 34.6%
Renter Occupied, DRILLDOWN 2,004 3,710 4,527 2,034 1,169 104 13,548
Renter Occupied, 2000 Census 1,776 4,258 4,077 2,491 1,286 107 13,995
Renter Occupied, 1990 Census 1,822 4,171 5,287 2,056 1,234 97 14,667
Renter Occupied, DRILLDOWN 51.8% 43.9% 89.8% 93.0% 59.6% 50.0% 62.4%
Renter Occupied, 2000 Census 54.0% 48.9% 91.8% 97.4% 68.8% 58.2% 66.5%
Renter Occupied, 1990 Census 50.4% 46.4% 94.0% 97.3% 64.4% 53.0% 65.4%
Housing Unit Distribution
Total Units, DRILLDOWN 3,935 8,612 5,495 2,208 2,089 214 22,553
single units 1,634 3,931 901 61 580 105 7,212
2 units 1,748 3,582 554 26 844 54 6,808
3-4 Units 422 927 467 33 512 38 2,399
5-9 Units 64 155 349 35 44 5 652
10-19 Units 12 17 112 119 42 12 314
20-49 Units 55 0 583 576 0 0 1,214
50 + Units 0 0 2,529 1,358 67 0 3,954
Total Units, DRILLDOWN
single units 41.5% 45.6% 16.4% 2.8% 27.8% 49.1% 32.0%
2 units 44.4% 41.6% 10.1% 1.2% 40.4% 25.2% 30.2%
3-4 Units 10.7% 10.8% 8.5% 1.5% 24.5% 17.8% 10.6%
5-9 Units 1.6% 1.8% 6.4% 1.6% 2.1% 2.3% 2.9%
10-19 Units 0.3% 0.2% 2.0% 5.4% 2.0% 5.6% 1.4%
20-49 Units 1.4% 0.0% 10.6% 26.1% 0.0% 0.0% 5.4%
50 + Units 0.0% 0.0% 46.0% 61.5% 3.2% 0.0% 17.5%
This is an evolving body of work that may reflect the integration of additional information sources. Copyright © 2004 by Social Compact District 3 DRILLDOWN -7
8. CLEVELAND NEIGHBORHOOD MARKET DRILLDOWN PROFILE
Neighborhood Broadway/Slavic Village Central Downtown Goodrich-Kirtland Park Industrial Valley/Duck Island Totals
Subdivision North Broadway South Broadway
Housing Unit Distribution (continued)
Total Units, 2000 Census 3,955 9,878 5,441 3,813 2,194 210 25,491
single units 2,473 4,710 777 25 1,076 125 9,186
2 units 759 2,481 275 32 542 22 4,111
3-4 Units 407 1,112 613 21 209 14 2,376
5-9 Units 90 166 1,863 44 68 7 2,238
10-19 Units 101 15 928 70 43 6 1,163
20-49 Units 34 0 396 411 81 0 922
50 + Units (and other units) 91 1,394 589 3,210 175 36 5,495
Total Units, 2000 Census
single units 62.5% 47.7% 14.3% 0.7% 49.0% 59.5% 36.0%
2 units 19.2% 25.1% 5.1% 0.8% 24.7% 10.5% 16.1%
3-4 Units 10.3% 11.3% 11.3% 0.6% 9.5% 6.7% 9.3%
5-9 Units 2.3% 1.7% 34.2% 1.2% 3.1% 3.3% 8.8%
10-19 Units 2.6% 0.2% 17.1% 1.8% 2.0% 2.9% 4.6%
20-49 Units 0.9% 0.0% 7.3% 10.8% 3.7% 0.0% 3.6%
50 + Units (and other units) 2.3% 14.1% 10.8% 84.2% 8.0% 17.1% 21.6%
Total Units, 1990 Census 4,173 10,141 7,948 2,573 2,265 218 27,318
single units 2,122 4,666 1,219 19 871 146 9,043
2-9 units 1,855 5,160 3,243 61 1,095 40 11,454
10-49 Units 66 17 2,078 347 75 14 2,597
50 + Units 130 298 1,408 2,146 224 18 4,224
Total Units, 1990 Census
single units 50.9% 46.0% 15.3% 0.7% 38.5% 67.0% 33.1%
2-9 units 44.5% 50.9% 40.8% 2.4% 48.3% 18.3% 41.9%
10-49 Units 1.6% 0.2% 26.1% 13.5% 3.3% 6.4% 9.5%
50 + Units 3.1% 2.9% 17.7% 83.4% 9.9% 8.3% 15.5%
4,173 10,141 7,948 2,573 2,265 218 27,318
This is an evolving body of work that may reflect the integration of additional information sources. Copyright © 2004 by Social Compact District 3 DRILLDOWN -8
9. CLEVELAND NEIGHBORHOOD MARKET DRILLDOWN PROFILE
Neighborhood Broadway/Slavic Village Central Downtown Goodrich-Kirtland Park Industrial Valley/Duck Island Totals
Subdivision North Broadway South Broadway
Risk/Stability
Reported Incidents of Crime 1
Total Reported Incidents of Crime, 2003 597 1,148 674 1,345 446 74 4,284
Total Reported Incidents of Crime, 1997 918 1,603 1,439 2,772 850 116 7,698
% change Total Reported Incidents of Crime, 1997-2003 -34.97% -28.38% -53.16% -51.48% -47.53% -36.21% -44.35%
Reported Incidents of Property Crime, 2003 474 1,167 364 60 481 953 3,499
Reported Incidents of Property Crime, 1997 758 1,366 1,071 2,473 753 104 6,525
% change Reported Incidents of Property Crime, 1997-2003 -37.47% -14.57% -66.01% -97.57% -36.12% 816.35% -46.38%
Reported Incidents of Violent Crime, 2003 116 195 200 178 82 14 785
Reported Incidents of Violent Crime, 1997 160 237 368 299 97 12 1,173
% change Reported Incidents of Violent Crime, 1997-2003 -27.50% -17.72% -45.65% -40.47% -15.46% 16.67% -33.08%
Reported Incidents of Crime per 1,000 people 2
Total Reported Incidents of Crime per 1,000 people, 2003 65.97 53.46 55.67 225.67 103.84 66.31 79.33
Total Reported Incidents of Crime per 1,000 people, 1997 101.45 74.64 118.86 465.10 197.90 103.94 142.55
Reported Incidents of Property Crime per 1,000 people, 2003 52.38 54.34 30.07 10.07 111.99 853.94 64.79
Reported Incidents of Property Crime per 1,000 people, 1997 83.77 63.61 88.46 414.93 175.32 93.19 120.83
Reported Incidents of Violent Crime per 1,000 people, 2003 12.82 9.08 16.52 29.87 19.09 12.54 14.54
Reported Incidents of Violent Crime per 1,000 people, 1997 17.68 11.04 30.40 50.17 22.58 10.75 21.72
1
Crime definitions follow the standard set forth by the FBI Uniform Crime Reports and are classified as either Property (Burglary, Larceny-Theft, Motor Vehicle Theft) or Violent (Murder and Non Negligent Homicide, Forcible Rape, Robbery,
Aggravated Assault).
2
For purposes of comparison, 2000 Census population figures were used to calculate crime per person.
Owner Occupancy
Owner Occupied Buildings 1,860 4,749 501 43 775 104 8,032
% Owner Occupied Buildings 70.4% 79.0% 35.8% 35.0% 66.0% 71.2% 69.8%
Owner Occupied Units 1,862 4,750 514 153 792 104 8,175
% Owner Occupied Units 48.2% 56.1% 10.2% 7.0% 40.4% 50.0% 37.6%
This is an evolving body of work that may reflect the integration of additional information sources. Copyright © 2004 by Social Compact District 3 DRILLDOWN -9
10. CLEVELAND NEIGHBORHOOD MARKET DRILLDOWN PROFILE
Neighborhood Broadway/Slavic Village Central Downtown Goodrich-Kirtland Park Industrial Valley/Duck Island Totals
Subdivision North Broadway South Broadway
Residential Building Permits, January 2000 - December 2002
Additions/Alterations/Repair Permits 215 373 79 160 92 8 927
New Construction Permits (January 2000 -- December 2003) 23 129 150 1 9 2 314
Demolitions 63 113 34 3 22 4 239
Total Residential Building Permits 301 615 263 164 123 14 1480
This is an evolving body of work that may reflect the integration of additional information sources. Copyright © 2004 by Social Compact District 3 DRILLDOWN -10