
Recomendados
Mais conteúdo relacionado
Semelhante a Aventine Renewable Energy Financial Analysis Presentation
Semelhante a Aventine Renewable Energy Financial Analysis Presentation (20)
Aventine Renewable Energy Financial Analysis Presentation
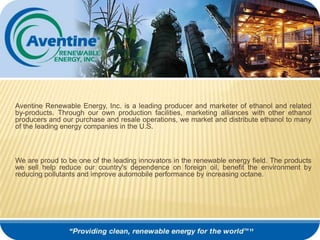
- 1. Aventine Renewable Energy, Inc. is a leading producer and marketer of ethanol and related by-products. Through our own production facilities, marketing alliances with other ethanol producers and our purchase and resale operations, we market and distribute ethanol to many of the leading energy companies in the U.S. We are proud to be one of the leading innovators in the renewable energy field. The products we sell help reduce our country's dependence on foreign oil, benefit the environment by reducing pollutants and improve automobile performance by increasing octane.
- 9. Bio-diesel
- 11. Liquidity Ratios: A Closer Look Current Financials AVR’s current assets are steadily increasing in relation to their current liabilities, contributing to our increasing levels of liquidity. Debt and Equity AVR’s debt and equity ratios show rapidly increasing assets and a growing preference for equity financing.
- 12. Turnover Ratios: A Closer Look Inventory Aventine Renewable Energy’s turnover ratios show a definite strength in the rate of inventory turnover. Perhaps this is why they are a leader in the industry. Receivables Aventine Renewable Energy has a remarkably fast rate of receivables turnover. This keeps cash inflows coming but may deter customers.
- 13. Profitability Ratios: A Closer Look Cash Coverage AVR’s cash coverage ratios show a good ability to cover interest payments. Profitability We will discuss profitability ratios on the next slide.
- 14. Profitability Summary Profit Margin AVR’s profit margin has been decreasing but is still higher than the industry average. This reflects their superior ability to preserve sales revenues. Return on Assets AVR’s return on assets is decreasing and has remained lower than the industry average. This could reflect a poor investment strategy. Return on Equity AVR’s return on equity is decreasing but is still higher than the industry average. This shows that AVR is not using the money invested in it wisely to generate income. This is obviously a problem for the whole industry.
Notas do Editor
- Current RatioAVR's current ratio has been steadily increasing over the past two years. making them increasingly liquid. While their current liabilities are increasing, their current assets are increasing even more rapidly. AVR's current ratio is almost double that of the industry, suggesting an excess of cash and possibly a lack of investments.Quick RatioAVR’s quick ratio has also been increasing, for the most part even more rapidly than its current ratio, as its inventories decline. AVR’s quick ratio is also higher than the industry average. This shows that AVR tends to hold a little less inventory than its peers. Cash RatioOver the past two years, AVR’s cash ratio has first increased dramatically and then fallen slightly. It now rests well above the industry average. This is reflective of cash levels that have followed the same pattern over steadily increasing liabilities. It is uncertain whether this level is adequate for the industry because the industry average is currently at a negative.Total Debt RatioAVR’s total debt ratio has been decreasing, overall, due to a rather rapid increase in liabilities as equity increases slowly. This ratio shows that AVR’s liabilities equal about half of our assets.Debt/Equity RatioDespite increasing debt, AVR’s debt/equity ratio has decreased over time due to a large increase in equity. It is significantly lower than the industry average. This reflects a reluctancy of AVR to finance their operations through debt, preferring to use equity instead. While keeping debt to a minimum is good, this may hinder AVR’s ability to lever up their profits.Equity MultiplierAVR’s equity multiplier, which is also noticeably lower than the industry average, confirm’s the company’s lack of debt in their financial structure.
- Inventory TurnoverAVR’s inventory turnover has generally increased since 2005, with an especially high figure for 2006. They have remained well above the industry average in this area, showing a strong ability to keep inventory moving and sales coming. This could also indicate a lower level of inventory.Days Sales in InventoryAVR’s days sales in inventory has generally decreased over the past few years, reflecting either quicker sales or more spontaneous ordering policies. This figure has remained significantly lower than the industry average, showing a shorter holding period for inventory.Receivables TurnoverAVR’s receivables turnover has remained relatively constant over the last few years. It is noticeably higher than the industry average. This would contribute to greater amounts of cash but could possibly deter customers.Average Collection PeriodAVR’s average collection period has remained relatively constant over the past few years and is noticeably lower than the industry average. This would increase cash from sales but might deter customers.Total Asset TurnoverAVR’s total asset turnover is decreasing but is still remarkably higher than the industry average. This is not due to a decrease in sales but is simply a product of their rapidly increasing assets that have outpaced increases in sales. This reflects a superior ability to generate sales given a certain level of assets.
- Times Interest EarnedAVR’s return rates have varied noticeably over time, jumping from 4.09 to 10.26 and falling to 3.05 again. However, through all this, they have remained above the industry average, showing a strength apparently quite uncommon to the industry.Cash CoverageAVR’s cash coverage ratios remain fairly in sync with their times interest earned. This shows that depreciation apparently is not too significant to the company.
- Profit MarginAVR’s profit margin has been decreasing but is still higher than the industry average. This could be due to a deficit in investing outside of sales alone. Return on AssetsAVR’s return on assets is decreasing and has remained lower than the industry average. This could, once again, reflect a poor investment strategy.Return on EquityAVR’s return on equity is decreasing but is still higher than the industry average. This shows that AVR is not using the money invested in it wisely to generate income. This is obviously a problem for the whole industry.