Recomendados

Recomendados
Mais conteúdo relacionado
Último
Último (20)
Destaque
Destaque (20)
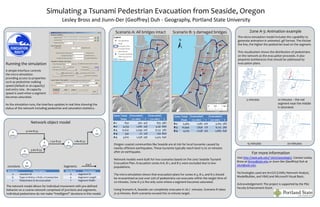
Simulating a tsunami evacuation from Seaside, Oregon
- 1. Simulating a Tsunami Pedestrian Evacuation from Seaside, Oregon Lesley Bross and Jiunn-Der (Geoffrey) Duh - Geography, Portland State University Scenario A: All bridges intact Scenario B: 5 damaged bridges Zone A-3: Animation example The micro-simulation model includes the capability to generate animation in animated .gif format. The thicker the line, the higher the pedestrian load on the segment. This visualization shows the distribution of pedestrians on the network as the evacuation proceeds. It also pinpoints bottlenecks that should be addressed by Running the simulation evacuation plans. A simple interface controls the micro-simulation providing access to properties such as pedestrian walking speed (default or at-capacity) and entry rate. At-capacity speed is used when a segment becomes saturated. 5 minutes 10 minutes -- the red As the simulation runs, the interface updates in real time showing the segment near the middle status of the network including pedestrian and saturation statistics. is saturated. Zone Total Evacuated Evacuated Zone Total Evacuated Evacuated Peds (15 min) % (20 min) % Peds (15 min) % (20 min) % Network object model A-1 850 360 42% 835 98% B-2 5,464 1,082 20% 3,164 58% A-2 4,753 1,082 23% 3,141 66% B-3 10,944 1,836 17% 6,125 56% 4-100-8.53 1 A-3 10,641 2,099 20% 6,152 58% B-4 4,205 1,038 25% 2,683 64% 5 1/0 A-4 941 211 22% 756 80% 0/42 A-5 3,610 1,038 29% 2,505 69% 3 2-50-8.53 2 1-80-8.53 Oregon coastal communities like Seaside are at risk for local tsunamis caused by 15 minutes 20 minutes 2/0 0/35 nearby offshore earthquakes. These tsunamis typically reach land 15 to 20 minutes 4 3-60-8.53 after an earthquake. For more information 0/50 Visit http://web.pdx.edu/~jduh/seasidegis/. Contact Lesley Network models were built for two scenarios based on the 2007 Seaside Tsunami a Bross at lbross@pdx.edu or Jiunn-Der (Geoffrey) Duh at d-e-f Evacuation Plan. Evacuation zones A-6, B-1, and B-5 were excluded due to low Junctions b/c Segments jduh@pdx.edu. populations. Attribute Description Attribute Description a Junction ID d Segment ID Technologies used are ArcGIS (Utility Network Analyst, The micro-simulation shows that evacuation plans for zones A-3, B-2, and B-3 should b Type: 0=Entry; 1=Exit; 2=Connection e Segment Length ModelBuilder, and VBA) and Microsoft Visual Basic. be re-examined as just over 50% of pedestrians can evacuate within the target time of c Pedestrians to be evacuated f Segment Width 20 minutes. Zone A-3 is the only zone where a segment becomes saturated. Acknowledgement: The project is supported by the PSU The network model allows for individual movement with pre-defined Faculty Enhancement Grant. behavior on a coarse network comprised of junctions and segments. Using Scenario A, Seaside can completely evacuate in 26.7 minutes. Scenario B takes Individual pedestrians do not make “intelligent” decisions in this model. 31.9 minutes. Both scenarios exceed the 20 minute target.