Games on Social Networks: Constructing Valuable Networks
•
1 gostou•241 visualizações

Summer 2008 REU at Carleton College.
Recomendados

Recomendados
Mais conteúdo relacionado
Mais procurados
Mais procurados (18)
Destaque
Semelhante a Games on Social Networks: Constructing Valuable Networks
Semelhante a Games on Social Networks: Constructing Valuable Networks (20)
Último
Último (20)
Games on Social Networks: Constructing Valuable Networks
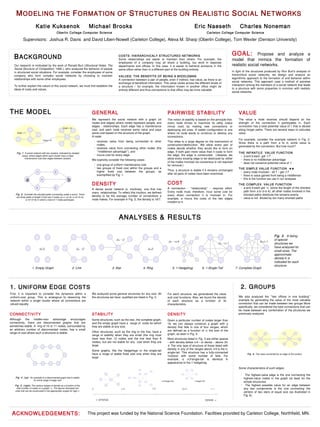
- 1. M ODELING THE F ORMATION OF S TRUCTURES ON R EALISTIC S OCIAL N ETWORKS Katie Kuksenok Michael Brooks Eric Naeseth Charles Noneman Oberlin College Computer Science Carleton College Computer Science Supervisors: Joshua R. Davis and David Liben-Nowell (Carleton College), Alexa M. Sharp (Oberlin College), Tom Wexler (Denison University) GOAL: Propose and analyze a B ACKGROUND COSTS: HIERARCHICALY STRUCTURED NETWORKS Some relationships are easier to maintain than others. For example, the model that mimics the formation of employees of a company may all share a building, but work in separate Our research is motivated by the work of Ronald Burt (Structural Holes: The departments and offices. In this case, it is easier to befriend someone in the realistic social networks. Social Structure of Competition, 1992.), who analyzed the behavior of people same office rather than in a different part of the building entirely. in structured social situations. For example, consider the employees of some In light of the structures produced by Ron Burt's analysis of company who form complex social networks by choosing to maintain hierarchical social networks, we design and analyze an VALUES: THE BENEFITS OF BEING A MIDDLEMAN relationships with some other employees. algorithmic approach to the formation of and behavior within A connection between a pair of people, even if indirect, has value, as there is an social networks. This approach uses a method of pairwise exchange of beneficial information. This value varies across the different levels of To further explain the nature of this social network, we must first establish the interaction among the members of a social network that leads a structure – for example, the information known in another office might be ideas of costs and values. to a structure with some properties in common with realistic entirely different and thus connections to that office may be more valuable. social networks. T HE M ODEL GENERAL PAIRWISE STABILITY VALUE We represent the social network with a graph (of The notion of stability is based on the principle that The value a node receives should depend on the nodes and edges) where nodes represent people, and every node strives to maximize its utility (value strength of the connection it participates in. Each edges - relationships. Each edge has a maintenance minus cost) by making new connections or connection has a total potential value of 1 that is diluted Cost = 3 cost, and each node receives some value and pays destroying old ones. A stable configuration is one along longer paths. There are several ways to calculate Cost = 1 some cost based on the structure of the graph. where no node wants to construct or destroy any value. A node: connections. Cost = 5 For example, consider the example network in Fig. 2. receives value from being connected to other This relies to a large degree on the mechanism of Since there is a path from a to b, some value is ➢ nodes, construction/destruction. We allow every pair of generated by the connection. But how much? ➢ receives value from connecting other nodes (the nodes decide whether they would like to form an “middleman advantage”), and edge. If both gain more value than it costs to form THE INFANTILE VALUE FUNCTION Fig. 1. A social network with two clusters, indicated by shaded areas, where edges within each cluster have a lower ➢ Incurs cost for every edge the edge, the edge is constructed. Likewise, we ➢ a and b each get 1/7 maintenance cost than edges between clusters. We explicitly consider the following cases: allow every existing edge to be destroyed by either ➢ there is no middleman advantage of the nodes involved (so consensus is not required does not conserve potential value of 1 one group of uniform maintenance cost ➢ ➢ for removal.) ➢ two groups of fixed cost within the groups and a THE SIMPLE VALUE FUNCTION higher fixed cost between the groups, as Thus, a structure is stable if it remains unchanged 1 2 every node involved – all 7 – get 1/7 after all pairs of nodes have been examined. ➢ exemplified by Fig. 1. ➢ there is value gained from being a middleman a 4 b ➢ this is the function we use in our analyses DENSITY COST THE COMPLEX VALUE FUNCTION 5 3 A dense social network is, intuitively, one that has A connection - “relationship” - requires effort. ➢ a and b each get ¼ (since the length of the shortest many relationships. To reflect this intuition, we defined Every node must, therefore, incur some cost for path form a to b is 4); all other nodes involved in the Fig. 2. Consider the shortest paths connecting nodes a and b. There density to be the average number of connections a every direct connection it is involved in. For shortest paths distribute the remains evenly are three paths of length 3 that use 4 nodes (a→1→2→b; a→5→4→b; value is not diluted by too many shortest paths a→5→3→b) in which a total of 7 nodes participate. node makes. For example in Fig. 2, the density is 16/7. example, a incurs the costs of the two edges ➢ incident to it. A NALYSES & R ESULTS Fig. 3. A listing d= ~2 of special d= ~n/4 d=n-1 d= ~n-1 structures we have analyzed for d=0 d= ~2 d=2 small sizes. The approximate density d is indicated for each structure. 1. Empty Graph 2. Line 3. Star 4. Ring 5. 1-Hedgehog 6. 1-Single-Tail 7. Complete Graph 1. U NIFORM E DGE C OSTS 2. G ROUPS First, it is important to consider the dynamics within a We analyzed some general structures for any size. All For each structure, we generalized the value uniform-cost group. This is analogous to observing the the structures we have qualified are listed in Fig. 3. and cost functions. Also, we found the density We also analyzed the “two offices in one building” network within a single cluster where all connections are of each structure as a function of its example by generating the value of the most valuable valued equally. characteristics. connection that can be made between two groups More specifically, we considered the best connections that can be made between any combination of the structures we CONNECTIVITY STABILITY DENSITY previously analyzed. Although the middle-man advantage encourages Some structures, such as the star, the complete graph, Given a particular number of nodes larger than connectivity, there are disconnected graphs that are and the empty graph have a range of costs for which 16, we can always construct a graph with a sometimes stable. A ring of 10 or 11 nodes, surrounded by they are stable at any size. density that falls in one of four ranges, which an arbitrary number of disconnected nodes, has a small are defined as a function of n, the size of the range of cost where such a structure is stable: Other structures, such as the ring or the line, have a range of stability when they are small (the ring must graph, as seen in Fig. 5. have less than 12 nodes and the line less than 8 Most structures listed in Fig. 3 are either sparse nodes), but are not stable for any cost when they are – with density below n/4 – or dense – above 3n/ large. 4. The only type of structure of those listed with density in any of the ranges above n/4 is the k- Some graphs, like the hedgehogs or the single-tail single-tail. This structure has a fully-connected have a range of stable fixed cost only when they are Fig. 6. Two stars connected by an edge at the centers 'nucleus' with some number of tails. For large. example, a n/2-single-tail is identical in appearance to the 1-hedgehog. Some characteristics of such edges: ➢ The highest-value edge is the one connecting the Fig. 4. (up) An example of a disconnected graph that is stable highest-value nodes in the graph (at least for the for some range of edge cost n/4-Single-Tail 1-Single-Tail simple structures) Fig. 5. (right) The various ranges of density as a function of the ➢ The highest possible value for an edge between total number of nodes on a graph, n,. The figures illustrated are 0 n/4 n/2 3n/4 n-1 any two components is the one connecting the ones that can be constructed in the appropriate ranges for high n. centers of two stars of equal size (as illustrated in Fig. 6). ← SPARSE DENSE → A CKNOWLEDGEMENTS: This project was funded by the National Science Foundation. Facilities provided by Carleton College, Northfield, MN.