Assignment southern chemicals with project appraisal
•Transferir como XLSX, PDF•
0 gostou•358 visualizações


Recomendados
Mais conteúdo relacionado
Semelhante a Assignment southern chemicals with project appraisal
Semelhante a Assignment southern chemicals with project appraisal (12)
Mais de Kinshook Chaturvedi
Mais de Kinshook Chaturvedi (20)
Assignment southern chemicals with project appraisal
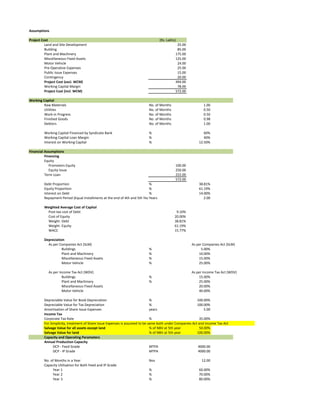
- 1. Assumptions Project Cost (Rs. Lakhs) Land and Site Development 25.00 Building 85.00 Plant and Machinery 175.00 Miscellaneous Fixed Assets 125.00 Motor Vehicle 24.00 Pre-Operative Expenses 25.00 Public Issue Expenses 15.00 Contingency 20.00 Project Cost (excl. WCM) 494.00 Working Capital Margin 78.00 Project Cost (incl. WCM) 572.00 Working Capital Raw Materials No. of Months 1.00 Utilities No. of Months 0.50 Work-in Progress No. of Months 0.50 Finished Goods No. of Months 0.98 Debtors No. of Months 1.00 Working Capital Financed by Syndicate Bank % 60% Working Capital Loan Margin % 40% Interest on Working Capital % 12.50% Financial Assumptions Financing Equity Promoters Equity 100.00 Equity Issue 250.00 Term Loan 222.00 572.00 Debt Proportion % 38.81% Equity Proportion % 61.19% Interest on Debt % 14.00% Repayment Period (Equal Installments at the end of 4th and 5th Year) Years 2.00 Weighted Average Cost of Capital Post-tax cost of Debt 9.10% Cost of Equity 20.00% Weight- Debt 38.81% Weight- Equity 61.19% WACC 15.77% Depreciation As per Companies Act (SLM) As per Companies Act (SLM) Buildings % 5.00% Plant and Machinery % 10.00% Miscellaneous Fixed Assets % 15.00% Motor Vehicle % 25.00% As per Income Tax Act (WDV) As per Income Tax Act (WDV) Buildings % 15.00% Plant and Machinery % 25.00% Miscellaneous Fixed Assets 20.00% Motor Vehicle 40.00% Depreciable Value for Book Depreciation % 100.00% Depreciable Value for Tax Depreciation % 100.00% Amortisation of Share Issue Expenses years 5.00 Income Tax Corporate Tax Rate % 35.00% For Simplicity, treatment of Share Issue Expenses is assumed to be same both under Companies Act and Income Tax Act Salvage Value for all assets except land % of NBV at 5th year 50.00% Salvage Value for land % of NBV at 5th year 100.00% Capacity and Operating Parameters Annual Production Capacity DCP - Feed Grade MTPA 4000.00 DCP - IP Grade MTPA 4000.00 No. of Months in a Year Nos 12.00 Capacity Utilisation for Both Feed and IP Grade Year 1 % 60.00% Year 2 % 70.00% Year 3 % 80.00%
- 2. Operating Revenue and Costs Sales Price DCP - Feed Grade Rs. per MT 8500.00 DCP - IP Grade Rs. per MT 28000.00 Cost of Raw Material p.u. of DCP - Feed Grade Rate (Rs. p.u.) 4650.00 Cost of Raw Material p.u. of DCP - IP Grade Rate (Rs. p.u.) 16500.00 Consumable Stores % of Sales Revenue 2.00% Power % of Sales Revenue 4.00% Fuel % of Sales Revenue 2.50% Packaging Costs % of Sales Revenue 1.00% Administrative Expenses 1st Year of Operation Rs. Lakhs 5.50 2nd Year of Operation Onwards % Increase p.a. 5.00% Selling and Distribution Expenses % of Sales 3.00% Wages and Salaries 1st Year of Operation Fixed (80% of Rs.24 Lakhs) Rs. Lakhs 19.20 Variable (20% of Rs.24 Lakhs) Rs. Lakhs 4.80 2nd Year of Operation Onwards Fixed % Increase p.a. 5.00% Variable Increase in the same proportion of Production
- 3. Statement of Working Capital (Rs. Lakhs) Particulars Units 0 1 2 3 4 5 Working Capital Raw Materials Rs. Crores 42.30 49.35 56.40 56.40 56.40 Utilities Rs. Crores 3.47 4.05 4.62 4.62 4.62 Work-in Progress Rs. Crores 25.23 29.38 33.52 33.55 33.58 Finished Goods Rs. Crores 50.66 58.87 67.08 67.19 67.31 Debtors Rs. Crores 73.00 85.17 97.33 97.33 97.33 Working Capital Rs. Crores 194.66 226.81 258.96 259.10 259.25 Increase/(Decrease) in WC Rs. Crores -194.66 -32.15 -32.15 -0.14 -0.15 Working Capital Financing Working Capital Margin Rs. Crores 77.86 77.86 77.86 77.86 77.86 Debt 30.22 30.22 30.22 30.22 30.22 Equity 47.64 47.64 47.64 47.64 47.64 Increase/(Decrease) in WCM -77.86 0.00 0.00 0.00 0.00 Working Capital Loan Rs. Crores 116.80 136.08 155.38 155.46 155.55 Interest on Working Capital Loan Crores Rs. 14.60 17.01 19.42 19.43 19.44 Working Capital through Internal Accruals 0.00 12.86 25.72 25.78 25.84 Increase/(Decrease) in WCM-Equity -47.64 0.00 0.00 0.00 0.00 Increase/(Decrease) in WC through Internal Accruals 0.00 -12.86 -12.86 -0.06 -0.06 -47.64 -12.86 -12.86 -0.06 -0.06 0.00 Recovery of WCM-Equity -73.48
- 4. Statement of Profitability and Performance Parameters (Rs. Lakhs) Particulars Units 0 1 2 3 4 5 Production Operational Months Months 12 12 12 12 12 Capacity Utilisation % First 6 Months % 60% 70% 80% 80% 80% Second 6 Months % 60% 70% 80% 80% 80% Annual Production DCP - Feed Grade MTPA 2400 2800 3200 3200 3200 DCP - IP Grade MTPA 2400 2800 3200 3200 3200 Profit/Loss Gross Revenue Rs. Lakhs 876.00 1022.00 1168.00 1168.00 1168.00 Operating Expenditure Cost of Raw Material p.u. of DCP - Feed Grade 111.60 130.20 148.80 148.80 148.80 Cost of Raw Material p.u. of DCP - IP Grade 396.00 462.00 528.00 528.00 528.00 Consumable Stores 17.52 20.44 23.36 23.36 23.36 Power 35.04 40.88 46.72 46.72 46.72 Fuel 21.90 25.55 29.20 29.20 29.20 Packaging Costs 8.76 10.22 11.68 11.68 11.68 Administrative Expenses 5.50 5.78 6.06 6.37 6.69 Selling and Distribution Expenses 26.28 30.66 35.04 35.04 35.04 Wages and Salaries Fixed 19.20 20.16 21.17 22.23 23.34 Variable 4.80 5.60 6.40 6.40 6.40 Total Rs. Lakhs 646.60 751.49 856.43 857.79 859.22 Gross Margin Rs. Lakhs 229.40 270.52 311.57 310.21 308.78 Less: Amortisation of Share Issue Expenses 3.00 3.00 3.00 3.00 3.00 Less: Book Depreciation Rs. Lakhs 51.62 51.62 51.62 51.62 44.96 Profit before Interest and Tax Rs. Lakhs 174.78 215.90 256.95 255.59 260.82 Less: Interest on Term Loans Rs. Lakhs 31.08 31.08 31.08 31.08 15.54 Less: Interest on Working Capital Loan Rs. Lakhs 14.60 17.01 19.42 19.43 19.44 Profit before Tax Rs. Lakhs 129.10 167.81 206.45 205.08 225.84 Corporate Tax Rs. Lakhs 27.86 49.83 69.62 73.85 82.35 Profit after Tax Rs. Lakhs 101.25 117.98 136.83 131.23 143.49
- 5. Balance Sheet (Rs. Lakhs) Particulars Period 0 1 2 3 4 5 Liabilities Equity 350.00 350.00 350.00 350.00 350.00 350.00 Reserves and Surplus 0.00 101.25 219.22 356.05 487.27 630.76 Long Term Loans 222.00 222.00 222.00 222.00 111.00 0.00 Working Capital Borrowings 116.80 136.08 155.38 155.46 155.55 572.00 790.04 927.31 1083.42 1103.73 1136.31 Assets Gross Block 479.00 479.00 479.00 479.00 479.00 479.00 Accumulated Depreciation 51.62 103.23 154.85 206.46 251.42 Net Block 479.00 427.38 375.77 324.15 272.54 227.58 Deferred Revenue Expenditure 15.00 12.00 9.00 6.00 3.00 0.00 Net Working Capital 194.66 226.81 258.96 259.10 259.25 Cash and Bank Balances 78.00 156.00 315.73 494.31 569.10 649.48 572.00 790.04 927.31 1083.42 1103.73 1136.31 Check 0.00 0.00 0.00 0.00 0.00 0.00
- 6. Cash Flow Statement (Rs. Lakhs) Particulars 0 1 2 3 4 5 Cash Flows from Operating Activities Net Profit before Interest & Tax 174.78 215.90 256.95 255.59 260.82 Adjustment for Book Dep & Amort. 54.62 54.62 54.62 54.62 47.96 Change in Working Capital -194.66 -32.15 -32.15 -0.14 -0.15 Tax Paid -27.86 -49.83 -69.62 -73.85 -82.35 Sub-Total (A) 6.88 188.54 209.79 236.22 226.28 Cash Flows from Investing Activities Change in Deferred Revenue Expd. -15.00 Change in fixed assets -479.00 Sub-Total (B) -494.00 0.00 0.00 0.00 0.00 0.00 Cash Flows from Financing Activities Change in equity share capital 350.00 0.00 0.00 0.00 0.00 0.00 Change in Loans 222.00 0.00 0.00 0.00 -111.00 -111.00 Change in Working Capital Borrowings 0.00 116.80 19.29 19.29 0.08 0.09 Interest on Long Term Loan -31.08 -31.08 -31.08 -31.08 -15.54 Interest on Working Capital Loan -14.60 -17.01 -19.42 -19.43 -19.44 Sub-Total (C) 572.00 71.12 -28.80 -31.21 -161.43 -145.90 Change in Cash Flows (A+B+C) 78.00 78.00 159.73 178.58 74.79 80.38 Opening Balance 0.00 78.00 156.00 315.73 494.31 569.10 Closing Balance 78.00 156.00 315.73 494.31 569.10 649.48 Closing Balance as per BS 78.00 156.00 315.73 494.31 569.10 649.48 Difference (Check) 0.00 0.00 0.00 0.00 0.00 0.00
- 7. Tax and Depreciation Computation (Rs. Lakhs) Pre- Post- Allocated Allocation Depreciable Cost Cost Allocation Cost Building 85.00 9.35 94.35 Plant and Machinery 175.00 19.25 194.25 Miscellaneous Fixed Assets 125.00 13.75 138.75 Motor Vehicle 24.00 2.64 26.64 Pre-Operative Expenses and Contingency (To be allocated to main asset items) 45.00 Total Depreciable Cost 454.00 45.00 454.00 Depreciation and Tax Calculation 0 1 2 3 4 5 Operational Months 12 12 12 12 12 Depreciation as per Companies Act Building 4.72 4.72 4.72 4.72 4.72 Plant and Machinery 19.43 19.43 19.43 19.43 19.43 Miscellaneous Fixed Assets 20.81 20.81 20.81 20.81 20.81 Motor Vehicle 6.66 6.66 6.66 6.66 0.00 Total 51.62 51.62 51.62 51.62 44.96 Accmulated Depreciation Building 4.72 9.44 14.15 18.87 23.59 Plant and Machinery 19.43 38.85 58.28 77.70 97.13 Miscellaneous Fixed Assets 20.81 41.63 62.44 83.25 104.06 Motor Vehicle 6.66 13.32 19.98 26.64 26.64 Total 51.62 103.23 154.85 206.46 251.42 Gross Block Building 94.35 94.35 94.35 94.35 94.35 Plant and Machinery 194.25 194.25 194.25 194.25 194.25 Miscellaneous Fixed Assets 138.75 138.75 138.75 138.75 138.75 Motor Vehicle 26.64 26.64 26.64 26.64 26.64 Total 454.00 454.00 454.00 454.00 454.00 Net Block Building 89.63 84.92 80.20 75.48 70.76 Plant and Machinery 174.83 155.40 135.98 116.55 97.13 Miscellaneous Fixed Assets 117.94 97.13 76.31 55.50 34.69 Motor Vehicle 19.98 13.32 6.66 0.00 0.00 Total 402.38 350.77 299.15 247.54 202.58 Depreciation as per Income Tax Act Building 14.15 12.03 10.23 8.69 7.39 Plant and Machinery 48.56 36.42 27.32 20.49 15.37 Miscellaneous Fixed Assets 27.75 22.20 17.76 14.21 11.37 Motor Vehicle 10.66 6.39 3.84 2.30 1.38 Total 101.12 77.05 59.14 45.69 35.50 Accmulated Depreciation Building 14.15 26.18 36.41 45.10 52.49 Plant and Machinery 48.56 84.99 112.30 132.79 148.16 Miscellaneous Fixed Assets 27.75 49.95 67.71 81.92 93.29 Motor Vehicle 10.66 17.05 20.89 23.19 24.57 Total 101.12 178.17 237.31 283.00 318.50 Gross Block Building 94.35 94.35 94.35 94.35 94.35 Plant and Machinery 194.25 194.25 194.25 194.25 194.25 Miscellaneous Fixed Assets 138.75 138.75 138.75 138.75 138.75 Motor Vehicle 26.64 26.64 26.64 26.64 26.64 Total 454.00 454.00 454.00 454.00 454.00 Net Block Building 80.20 68.17 57.94 49.25 41.86 Plant and Machinery 145.69 109.27 81.95 61.46 46.10 Miscellaneous Fixed Assets 111.00 88.80 71.04 56.83 45.47 Motor Vehicle 15.98 9.59 5.75 3.45 2.07 Total 352.88 275.83 216.69 171.00 135.50 Corporate Income Tax PBT (Book Profits) 129.10 167.81 206.45 205.08 225.84 Add: Book Depreciation 51.62 51.62 51.62 51.62 44.96 Less: Income Tax Depreciation 101.12 77.05 59.14 45.69 35.50 Balance after Current Depreciation 79.60 142.38 198.93 211.00 235.29 Unabsorbed Depreciation 0.00 0.00 0.00 0.00 0.00 Carry Forward Unabsorb. Dep. 0.00 0.00 0.00 0.00 0.00 Dedn of Unabsorb. Dep. 0.00 0.00 0.00 0.00 0.00 Income Chargeable to Tax 79.60 142.38 198.93 211.00 235.29 Corporate Income Tax 27.86 49.83 69.62 73.85 82.35 Note: It is assumed that there is no Minimum Alternate Tax.
- 9. Repayment of Debt (Rs. in Lacs) Year Total 0 1 2 3 4 5 Opening Bal. 222.00 222.00 222.00 222.00 111.00 Loan Drawal 222.00 222.00 Interest Payment 139.86 0.00 31.08 31.08 31.08 31.08 15.54 Principal Payment 222.00 0.00 0.00 0.00 0.00 111.00 111.00 Closing Bal. 222.00 222.00 222.00 222.00 111.00 0.00 Total Payment 361.86 0.00 31.08 31.08 31.08 142.08 126.54
- 10. Working Capital (Increase)/Decrease in Working Capital Rs. Lakhs -47.64 -12.86 -12.86 -0.06 -0.06 0.00 Recovery of Working Capital Rs. Lakhs -73.48 Capex Capital Expenditure Excl. WC Mgn Rs. Lakhs -572.00 Salvage Value Rs. Lakhs 126.29 Project IRR (Post Tax) Profit Before Tax Rs. Lakhs 129.10 167.81 206.45 205.08 225.84 Add: Book Depreciation and Amortisation Rs. Lakhs 54.62 54.62 54.62 54.62 47.96 Interest on Term Loans Rs. Lakhs 31.08 31.08 31.08 31.08 15.54 Interest on Working Capital Loan Rs. Lakhs 14.60 17.01 19.42 19.43 19.44 Cash Accruals Before Tax Rs. Lakhs 229.40 270.52 311.57 310.21 308.78 Less: Corporate Tax Rs. Lakhs 27.86 49.83 69.62 73.85 82.35 Cash Accruals to Project Rs. Lakhs 201.54 220.68 241.94 236.36 226.42 Capital Expenditure Excl. WC Mgn, IDC and FC Rs. Lakhs -572.00 0.00 0.00 0.00 0.00 0.00 Salvage Value Rs. Lakhs 126.29 (Increase)/Decrease in Working Capital Rs. Lakhs -47.64 -12.86 -12.86 -0.06 -0.06 0.00 Recovery of Working Capital Rs. Lakhs -73.48 Net Cash Flows to Project Rs. Lakhs -619.64 188.68 207.82 241.89 236.30 279.24 Project IRR % 23.25% Project NPV Discount Factor % 10.00% NPV Rs. Lakhs 218.32 Project NPV Discount Factor % 15.77% NPV Rs. Lakhs 120.11 Project Payback Period Net Cash Flows to Project Rs. Lakhs -619.64 188.68 207.82 241.89 236.30 279.24 Cumulative Net Cash Flows to Project Rs. Lakhs -619.64 -430.96 -223.14 18.75 255.04 534.28 Payback Period Years 0.00 0.00 0.00 2.92 0.00 0.00 Payback Period Years 2.92 Equity IRR (Post Tax) Profit after tax Rs. Lakhs 101.25 117.98 136.83 131.23 143.49 Add: Book Depreciation Rs. Lakhs 51.62 51.62 51.62 51.62 44.96 (Increase)/Decrease in Working Capital Rs. Lakhs -47.64 0.00 0.00 0.00 0.00 Recovery of Working Capital Rs. Lakhs -73.48 Salvage Value Rs. Lakhs 126.29 Equity Infusion for Capex Rs. Lakhs #REF! #REF! Repayment of Debt Rs. Lakhs #REF! #REF! #REF! #REF! Net Cash Flows to Equity Rs. Lakhs #REF! #REF! #REF! #REF! #REF! 241.25 Equity IRR % #VALUE! Discounted Project Payback Period Discount Factor % 15.77% PV Factor 1.00 0.86 0.75 0.64 0.56 0.48 PV of Net Cash Flows to Project Rs. Lakhs -619.64 162.98 155.06 155.89 131.55 134.28 Cumulative Net Cash Flows to Project Rs. Lakhs -619.64 -456.66 -301.60 -145.71 -14.16 120.11 Payback Period Years 0.00 0.00 0.00 0.00 0.00 4.11 Discounted Payback Period Years 4.11 Equity IRR (Post Tax) Profit after tax Rs. Lakhs 101.25 117.98 136.83 131.23 143.49 Add: Book Depreciation and Amortisation Rs. Lakhs 54.62 54.62 54.62 54.62 47.96
- 11. (Increase)/Decrease in Working Capital Rs. Lakhs -47.64 -12.86 -12.86 -0.06 -0.06 0.00 Recovery of Working Capital Rs. Lakhs -73.48 Salvage Value Rs. Lakhs 126.29 Equity Infusion for Capex (Excl. WCM) Rs. Lakhs -302.36 Repayment of Debt Rs. Lakhs 0.00 0.00 0.00 -111.00 -111.00 Net Cash Flows to Equity Rs. Lakhs -350.00 143.00 159.73 191.39 74.78 133.25 Equity IRR % 30.57% Equity NPV Discount Factor % 20.00% NPV Rs. Lakhs 430.46 Adjusted Net Present Value All Promoter's Equity Financed NPV -12.78 Issue Expenses for Public Issue 15.00 PV of Tax Sheild 133.15 Adjusted NPV 105.37 Debt Service Coverage Ratio Profit after tax Rs. Lakhs 101.25 117.98 136.83 131.23 143.49 Add: Depreciation Rs. Lakhs 51.62 51.62 51.62 51.62 44.96 Interest on Term Loans Rs. Lakhs 31.08 31.08 31.08 31.08 15.54 Total Inflow Rs. Lakhs 183.94 200.67 219.52 213.92 203.98 Interest on Term Loans Rs. Lakhs 31.08 31.08 31.08 31.08 15.54 Repayment of Principal Amount Rs. Lakhs 0.00 0.00 0.00 111.00 111.00 Total Outflow Rs. Lakhs 31.08 31.08 31.08 142.08 126.54 Annual DSCR times 5.92 6.46 7.06 1.51 1.61 Average DSCR times 2.82 Maximum DSCR times 7.06 Minimum DSCR times 1.51 NPV of Debt Financing for Adjusted NPV Drawal 222.00 Tax shield on Interest 10.88 10.88 10.88 10.88 5.44 Repayment 0.00 0.00 0.00 -111.00 -111.00 Financing Cash Flows 222.00 10.88 10.88 10.88 -100.12 -105.56 NPV 133.15