
Recomendados

Recomendados
Mais conteúdo relacionado
Mais de Keane Wheeler
Mais de Keane Wheeler (11)
Último
Último (20)
Erin Bellingham
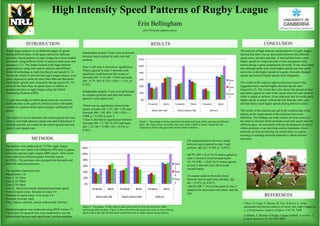
- 1. High Intensity Speed Patterns of Rugby League Erin Bellingham u3017231@uni.canberra.edu.au INTRODUCTION RESULTS CONCLUSION Rugby league players cover different ranges of speeds The analysis of high intensity speed patterns of rugby league Independent sample T-tests were performed during different plays of the game and across different showed that there was an association between the different between metres gained in each zone and positions. Speed patterns in rugby league have been studied 120% speed zones, position and play. It showed that backs reach position. previously using different forms of analysis techniques and higher speeds for longer periods of time and gained more measures (1,2). The studies looked at the high intensity 100% metres during a game compared to forwards. It was also found Zone 3 and zone 4 showed no significance. speed patterns using time motion analysis and different that although backs may reach higher speeds and may spend •Metres gained in zone 5 showed a non forms of technology to track the players and speeds (1, 2). 80% more time at the higher speeds in a game, forwards changed significant result between the means of Across the studies it showed that rugby league players were speeds and reached higher speeds more frequently. forwards (M= 12.0, SD= 5.944) and backs rarely required to sprint for more than 40m and that backs 60% Zone (M= 15.79, SD= 8.728; t (38) = -1.516, p= reach faster speeds more frequently during a game (2). No 3 The results of the analysis oppose previous research that 0.232) research has been done on speed zones in relation to 40% Zone suggested backs reached higher absolute speeds more position and play in rugby league using the Global 4 frequently (2). The results have also shown the spread of time Independent samples T-test were performed Positioning Systems (GPS). 20% Zone and metres gained in each of the speed zones for each position to compare positions and time and metres 5 while in attack or defence. It has indicated that forwards reach gained in each speed zone. 0% To gain knowledge of which speed zones are covered in higher speeds in attack without the ball than any other play different plays in the game by which position will enable Forwards Backs Forwards Backs Forwards Backs and that backs reach higher speeds during defensive plays. •There was no significance between the coaches to organise tactics and to prepare sufficiently for means of backs (M= 2.25, SD= 1.39) and games. Attack with Ball Attack without Ball Defence The results of the analysis can aid in the conditioning of the forwards (M= 1.88, SD= 1.09; t (38) = - players as the requirements of the positions have been 0.908, p = 0.236) in zone 5. The objectives are to determine the metres gained and time identified. The findings can help coaches develop tactics as • Zone 6 also had no significance between spent in each high intensity speed zone and to determine if Figure 1: Percentage of metres gained by forwards and backs while carrying out different the analysis showed which positions used each speed zone for forwards (M= 1.5, SD= 0.707) and backs position and play are related to the metres gained and time plays. The figure shows forwards cover more metres while in attack without the ball different plays. In association with the development of tactics (M= 1.25, SD = 0.500; t (4) = 0.516, p= compared to backs who gain more metres while in defence. spent in each speed zone. within positions it can also help coaches determine which 0.541). positions are best at carrying out certain plays in a game assisting in reaching maximal potential to obtain desired METHODS Chi squared analysis showed a trend outcomes. between metres gained in zone 3 and The analysis was conducted on 15 Elite rugby league 120% position (χ2 (2) = 6.599, p = 0.037). players who were fitted with GPSports GPS units in games across the national rugby league 2009 season. 1024 events 100% •68.9% (SR 1.5) of 10-25 metres gained in were coded from different games from the season zone 3 showed a trend towards backs. (n=1024).. The positions were grouped into forwards and 80% •31.1% (SR= -1.8)of 10-15 metres gained backs for analysing purposes. Zone 60% in zone 3 showed a less likely trend 3 towards backs. The variables measured were: 40% Zone •Speed zones 3-6: 4 Chi square analysis showed a trend Zone 3: 14-22km 20% Zone between time in each zone and play. (χ2 Zone 4: 23-29km 0% 5 (6) = 15.471, p= 0.017). Zone 5: 29-38km • 60.0% (SR = 1.9) of time spent in zone 3 Zone 6: Above previously measured maximum speed Forwards Backs Forwards Backs Forwards Backs tended to be associated with attack with the •Time in speed zones: Seconds in zones 3-6 ball. •Distance in speed zones: m in zones 3-6 Attack with Ball Attack without Ball Defence REFERENCES •Position: forward, back •Play: Attack with ball, Attack without ball, Defence 1.Dave, S, Craig, T, Shayne, H, Ceri, N Kevin, L. Semi- Figure 2: Percentage of time spent in each speed zone by forwards and backs while automated time-motion analysis of senior elite rugby league Int Statistical analysis was conducted using SPSS version 17. performing different plays. Figure 2 shows that forwards spend more time in zone 6 during J. of Performance Analysis of Sport 9:47-59. 2009 T-tests and Chi squared tests were conducted to test the attack without the ball and that backs spend more time at higher speeds during defence. relationships between each speed zone, position and play 2.Gabbett, T. Science of Rugby League football: A review. J. of Sport Sciences. 23: 961-976 2005