

Recomendados
Recomendados
Mais conteúdo relacionado
Mais procurados
Mais procurados (20)
Destaque
Destaque (10)
Semelhante a Catalyst Study: Turnover and Retention
Semelhante a Catalyst Study: Turnover and Retention (20)
Mais de Kevin Carter
Mais de Kevin Carter (20)
Último
Último (20)
Catalyst Study: Turnover and Retention
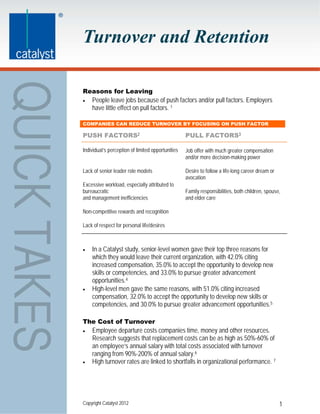
- 1. Turnover and Retention Reasons for Leaving People leave jobs because of push factors and/or pull factors. Employers have little effect on pull factors. 1 COMPANIES CAN REDUCE TURNOVER BY FOCUSING ON PUSH FACTOR PUSH FACTORS2 PULL FACTORS3 Individual’s perception of limited opportunities Job offer with much greater compensation and/or more decision-making power Lack of senior leader role models Desire to follow a life-long career dream or avocation Excessive workload, especially attributed to bureaucratic Family responsibilities, both children, spouse, and management inefficiencies and elder care Non-competitive rewards and recognition Lack of respect for personal life/desires In a Catalyst study, senior-level women gave their top three reasons for which they would leave their current organization, with 42.0% citing increased compensation, 35.0% to accept the opportunity to develop new skills or competencies, and 33.0% to pursue greater advancement opportunities.4 High-level men gave the same reasons, with 51.0% citing increased compensation, 32.0% to accept the opportunity to develop new skills or competencies, and 30.0% to pursue greater advancement opportunities.5 The Cost of Turnover Employee departure costs companies time, money and other resources. Research suggests that replacement costs can be as high as 50%-60% of an employee’s annual salary with total costs associated with turnover ranging from 90%-200% of annual salary.6 High turnover rates are linked to shortfalls in organizational performance. 7 Copyright Catalyst 2012 1
- 2. Turnover and Retention When retention is higher than normal, customer satisfaction, productivity, and profitability also tend to be higher than normal.8 Turnover by Industry, 20119 Tenure The median employment tenure of all wage and salary workers in January 2010 was 4.4, up from 4.1 years in January 2008.10 Women had a median tenure of 4.2 and men 4.6.11 In January 2004, management, professional, and related occupations had a median tenure of 5.2 years (Management, with 6.1 years, had the longest tenure.).12 Service occupation workers had a median tenure of 3.1 years. 13. Copyright Catalyst 2012 2
- 3. Turnover and Retention Tenure Increases with Age: Percentage of Workers by Age with the Same Employer for 10 Years or More 14 Collective Turnover* Antecedents15 HR systems and practices – There are links between the adoption of “high- commitment,” “high involvement,” or “high-performance” HR management systems and lower collective turnover. Collective attitudes and perceptions – HR investments enhance workers’ attitudes (satisfaction, commitment), increase feelings of equity or fairness, reduce the attractiveness of alternatives, and/or weaken turnover intentions. Collective characteristics – o Management/leadership quality – In six studies where collective turnover has been correlated with aspects of supervisor quality, no relationship has been found. o Climate/culture – A negative climate often results in a higher turnover rate o Cohesiveness/teamwork - Despite intuitive appeal, there is limited support for possible turnover-mitigating effects of group cohesiveness or teamwork. o Satisfaction/commitment – There is an inverse relationship between job satisfaction and collective turnover. Copyright Catalyst 2012 3
- 4. Turnover and Retention o Justice/fairness – Research reveals no relationship between collective turnover rates and feelings of injustice or unfairness. *Aggregate levels of employee departures that occur within groups, work units, or organizations. SOURCES 1 “When Talented Women Leave Your Company: Is it Push or Pull?” WFD Consulting, It’s About Time, Vol. 10 (Winter 2004). http://www.wfd.com/PDFS/2004-w-1.pdf 2 “When Talented Women Leave Your Company: Is it Push or Pull?” WFD Consulting, It’s About Time, Vol. 10 (Winter 2004). http://www.wfd.com/PDFS/2004-w-1.pdf 3 “When Talented Women Leave Your Company: Is it Push or Pull?” WFD Consulting, It’s About Time, Vol. 10 (Winter 2004). http://www.wfd.com/PDFS/2004-w-1.pdf 4 Catalyst, Women and Men in U.S. Corporate Leadership: Same Workplace, Different Realities? (2004). http://www.catalyst.org/publication/145/women-and-men-in-us-corporate-leadership-same- workplace-different-realities 5 Catalyst, Women and Men in U.S. Corporate Leadership: Same Workplace, Different Realities? (2004). http://www.catalyst.org/publication/145/women-and-men-in-us-corporate-leadership-same- workplace-different-realities 6 David G. Allen, Retaining Talent: A Guide to Analyzing and Managing Employee Turnover (SHRM, 2008). http://www.shrm.org/about/foundation/research/Pages/RetainingTalentEPG.aspx 7 David G. Allen, Retaining Talent: A Guide to Analyzing and Managing Employee Turnover (SHRM, 2008). http://www.shrm.org/about/foundation/research/Pages/RetainingTalentEPG.aspx 8 Paul R. Bernthal, and Richard S. Wellins, Ph.D., Retaining Talent: A Benchmarking Study (Development Dimensions International, 2001). http://tinyurl.com/3ddyjzf 9 Bureau of Labor Statistics, “Table 16: Annual Quits Rates by Industry and Region, Not Seasonally Adjusted” (2012). http://www.bls.gov/news.release/jolts.t16.htm 10 Bureau of Labor Statistics, Employee Tenure in 2010 (September 2010). http://www.bls.gov/news.release/tenure.nr0.htm 11 Bureau of Labor Statistics, Employee Tenure in 2010 (September 2010). http://www.bls.gov/news.release/tenure.nr0.htm 12 Bureau of Labor Statistics, Employee Tenure in 2010 (September 2010). http://www.bls.gov/news.release/tenure.nr0.htm 13 Bureau of Labor Statistics, Employee Tenure in 2010 (September 2010). http://www.bls.gov/news.release/tenure.nr0.htm 14 Bureau of Labor Statistics, Table 2. Percent of Employed Wage and Salary Workers 25 Years and Over Who Had 10 Years or More of Tenure with Their Current Employer by Age and Sex, Selected Years 1996-2010. (September 2010).http://www.bls.gov/news.release/tenure.t02.htm 15 John P. Hausknecht, Charlie O. Trevor, “Collective Turnover at the Group, Unit, and Organizational Levels: Evidence, Issues, and Implications,” Journal of Management, Vol. 37, No. 1, (January 2011). Copyright Catalyst 2012 4
- 5. Turnover and Retention Updated on April 22, 2012 Copyright Catalyst 2012 5