
Recomendados
Recomendados
Mais conteúdo relacionado
Semelhante a Coronary Heart Disease and Stroke
Semelhante a Coronary Heart Disease and Stroke (20)
Mais de Julie Pal
Mais de Julie Pal (20)
Coronary Heart Disease and Stroke
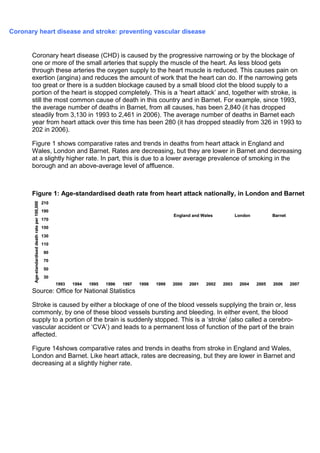
- 1. Coronary heart disease and stroke: preventing vascular disease Coronary heart disease (CHD) is caused by the progressive narrowing or by the blockage of one or more of the small arteries that supply the muscle of the heart. As less blood gets through these arteries the oxygen supply to the heart muscle is reduced. This causes pain on exertion (angina) and reduces the amount of work that the heart can do. If the narrowing gets too great or there is a sudden blockage caused by a small blood clot the blood supply to a portion of the heart is stopped completely. This is a ‘heart attack’ and, together with stroke, is still the most common cause of death in this country and in Barnet. For example, since 1993, the average number of deaths in Barnet, from all causes, has been 2,840 (it has dropped steadily from 3,130 in 1993 to 2,461 in 2006). The average number of deaths in Barnet each year from heart attack over this time has been 280 (it has dropped steadily from 326 in 1993 to 202 in 2006). Figure 1 shows comparative rates and trends in deaths from heart attack in England and Wales, London and Barnet. Rates are decreasing, but they are lower in Barnet and decreasing at a slightly higher rate. In part, this is due to a lower average prevalence of smoking in the borough and an above-average level of affluence. Figure 1: Age-standardised death rate from heart attack nationally, in London and Barnet Source: Office for National Statistics Stroke is caused by either a blockage of one of the blood vessels supplying the brain or, less commonly, by one of these blood vessels bursting and bleeding. In either event, the blood supply to a portion of the brain is suddenly stopped. This is a ‘stroke’ (also called a cerebro- vascular accident or ‘CVA’) and leads to a permanent loss of function of the part of the brain affected. Figure 14shows comparative rates and trends in deaths from stroke in England and Wales, London and Barnet. Like heart attack, rates are decreasing, but they are lower in Barnet and decreasing at a slightly higher rate. 30 50 70 90 110 130 150 170 190 210 1993 1994 1995 1996 1997 1998 1999 2000 2001 2002 2003 2004 2005 2006 2007 Age-standardiseddeathrateper100,000 England and Wales London Barnet 30 50 70 90 110 130 150 170 190 210 1993 1994 1995 1996 1997 1998 1999 2000 2001 2002 2003 2004 2005 2006 2007 Age-standardiseddeathrateper100,000 England and Wales London Barnet
- 2. Figure 2: Age-standardised death rate from stroke nationally, in London and Barnet These two diseases have similar origins: they are usually caused by progressive damage to the lining of blood vessels. This damage occurs in many parts of the body but the heart and the brain are more susceptible to a loss of blood supply than most other organs. CHD and stroke are often combined into one condition – cardio-vascular disease (CVD) for this reason. The most common causes of CVD are smoking, high blood pressure, raised blood cholesterol levels and diabetes. These last three risk factors are much more common amongst people who are obese. Put another way, the most common cause of death in Barnet is mainly caused by two things: smoking and obesity. If we wish to reduce the number of people who die each year from avoidable disease then we need to help people – in various different ways – to stop smoking and, if they are overweight or obese, to lose weight. The risk we face Death rates from CVD have been dropping in recent years both in Barnet and nationally. There have been two main reasons for this: nationally, the prevalence of smoking has been dropping1 and treatment for both heart attack and stroke (especially for heart attack) is more effective now than it was.2 However, the ‘obesity epidemic’ and the projected change in Barnet’s population (concerning Barnet’s impending ‘middle age spread’) mean that we can expect more people to be at risk of CVD than before. Unless we take active steps to help people to reduce lifestyle risks such as smoking and obesity, and take active steps to identify more people with established problems such as raised blood pressure, raised blood cholesterol and diabetes, then this downward trend in death rates is likely to reverse. 1 In part, the reduction in smoking prevalence is attributable to NHS and other services enabling people to quit. Smoking cessation in Barnet is discussed in section Error: Reference source not found. In part, the reduction in smoking prevalence is also due to taxation and smoke-free legislation and to a decreasing social acceptance of smoking. No one measure will work alone in helping people to quit (and preferably not to start) and it is necessary for the NHS, local government, employers, landlords and others to continue to discourage smoking as much as possible and to facilitate people to quit (for example, by actively encouraging people to attend smoking cessation services during working hours and not to have smoking breaks at work). 2 The Department of Health is looking to the NHS to provide immediate revascularisation services for everyone who has a heart attack, i.e. passing a small balloon on a catheter through an artery in groin into the affected blood vessel of the heart and expanding the narrowed area and then ‘splinting’ it with a stent to help keep it open. This requires specialist facilities and staff and thus, increasingly, people who have heart attacks will not be take to the nearest hospital but to one with these facilities. However, reducing deaths from CHD also requires the identification of people with risk factors such as high blood pressure and raised blood cholesterol and diabetes and managing these conditions aggressively to reduce risk. 30 40 50 60 70 80 90 1993 1994 1995 1996 1997 1998 1999 2000 2001 2002 2003 2004 2005 2006 2007 England and Wales London Barnet Age-standardiseddeathrateper100,000 30 40 50 60 70 80 90 1993 1994 1995 1996 1997 1998 1999 2000 2001 2002 2003 2004 2005 2006 2007 England and Wales London Barnet Age-standardiseddeathrateper100,000
- 3. The relationship between diversity and deprivation and CVD The impact of deprivation on health is shown most starkly in terms of deaths from coronary heart disease, which, together with stroke, is the most common cause of death. Everyone will die of something, so we tend to look at ‘premature’ deaths and this is defined as death occurring under the age of 75 years. Figure 3 shows the trend in deaths in Barnet from coronary heart disease in recent years. This has been constructed by ranking superoutput areas in order of deprivation score (see Error: Reference source not found) and then dividing these into three groups of lowest, middle and highest deprivation. Figure 3 clearly shows that, in terms of coronary heart disease, people living in the most deprived parts of the borough are most likely to die prematurely. Figure 3: Age-standardised death rates from coronary heart disease in people aged under 75 years grouped by super-output areas ranked in order of deprivation Asian people are at higher risk of developing diabetes and consequently have a risk of developing coronary heart disease that is about 40% higher than amongst the White population in the UK,i principally because of the damage that diabetes does to the blood vessels. People from Black, and especially African-Caribbean, ethnic groups are also at higher risk of stroke, principally because of a genetic predisposition to developing high blood pressure. However, for reasons that are not clear, Black people are between 25% and 50% less likely to have coronary heart disease than the White population in the UK. Age is also a factor in death from CVD: death from a heart attack or a stroke is more likely to occur in an older person than a younger one. This may seem obvious, but the important point is that many people live to an old age before dying of a CVD-related event, as shown in and Figure 4 and . 19 29 39 49 59 69 2004 2005 2006 2007 Age-standardiseddeathsper100,000 Low Deprivation SOAs Medium Deprivation SOAs High Deprivation SOAs PCT Average 19 29 39 49 59 69 2004 2005 2006 2007 Age-standardiseddeathsper100,000 Low Deprivation SOAs Medium Deprivation SOAs High Deprivation SOAs PCT Average Low Deprivation SOAsLow Deprivation SOAs Medium Deprivation SOAsMedium Deprivation SOAs High Deprivation SOAsHigh Deprivation SOAs PCT AveragePCT Average
- 4. Figure 4: The total number of deaths from cardiovascular disease in Barnet over the four-year period 2004-2007 by age group Source: Office for National Statistics Annual District Mortality Data Figure 5: The total number of deaths from stroke in Barnet in 2007 by age group Source: Office for National Statistics Annual District Mortality Data Local targets Figure 6 shows the current death rate in people aged under 75 years in Barnet and the trajectory for this that has been agreed as a target to achieve. This is especially challenging: the death rate from this disease cannot be expected to continue to drop until it reaches zero. However, it is also clear that death rates in the more deprived parts of the borough are higher than in the more affluent ones and if more effort is made with the people at special risk of CVD who live in these areas then overall CVD deaths should decrease. 0 10 20 30 40 50 60 5-9 10-14 15-19 20-24 25-29 30-34 35-39 40-44 45-49 50-54 55-59 60-64 65-69 70-74 75-79 80-84 85-89 90+ Totalnumberofdeaths Age at death 0 10 20 30 40 50 60 5-9 10-14 15-19 20-24 25-29 30-34 35-39 40-44 45-49 50-54 55-59 60-64 65-69 70-74 75-79 80-84 85-89 90+ Totalnumberofdeaths 0 10 20 30 40 50 60 5-9 10-14 15-19 20-24 25-29 30-34 35-39 40-44 45-49 50-54 55-59 60-64 65-69 70-74 75-79 80-84 85-89 90+ 0 10 20 30 40 50 60 5-9 10-14 15-19 20-24 25-29 30-34 35-39 40-44 45-49 50-54 55-59 60-64 65-69 70-74 75-79 80-84 85-89 90+ Totalnumberofdeaths Age at death
- 5. Figure 6: The trajectory for deaths from cardiovascular disease Key things that need to be done The key activities required are: maintaining the current good performance on smoking cessation and, especially in the more deprived areas, to try to increase the number of people quitting smoking; establishing ways for GP practices and acute and community sector providers to identify people with obesity and to refer them to specific services to enable them to lose weight which need to be of two types – − for people with ‘simple’ obesity and no other established medical problems, − for people with obesity and co-morbidity, e.g. conditions such as high blood pressure, raised blood cholesterol, diabetes, as helping these people to lose weight requires careful monitoring of the treatment they have for their other conditions; working with employers to make it easier for their staff to (i) be healthier at work and (ii) identify any established health risks such as smoking, obesity, high blood pressure and for these risks to be properly dealt with; working with schools to increase opportunities for healthy eating and taking exercise and to increase understanding amongst younger people of the importance of healthier lifestyles; targeting people at special risk of CVD who, for various reasons, do not see themselves at such risk and encouraging and enabling them to reduce CVD risk factors.
- 6. i Department of Health. Coronary Heart Disease National Service Framework. Chapter two: Preventing coronary heart disease in high risk patients. Department of Health. London. 2000
- 7. i Department of Health. Coronary Heart Disease National Service Framework. Chapter two: Preventing coronary heart disease in high risk patients. Department of Health. London. 2000