Call Girls In Seelampur Delhi ↬8447779280}Seelampur Escorts Service In Delhi...
Annie Williams Market Trends Aug-Sept 2014
1. Annie Williams
AUGUST/SEPTEMBER 2014
Inside This Issue
> LOCAL MARKET TRENDS ..................... 1
> MORTGAGE RATE OUTLOOK ............... 2
> HOME STATISTICS .............................. 2
> FORECLOSURE STATS ........................ 3
> CONDO STATISTICS ............................ 3
> MOMENTUM CHARTS .......................... 4
The Real Estate Report
local market trends
SAN FRANCISCO
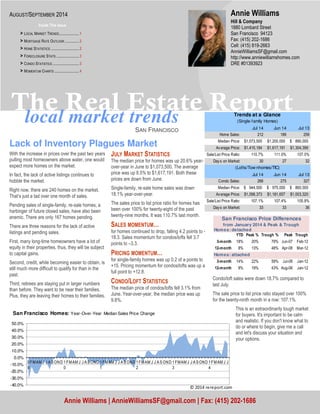
Trends at a Glance
(Single-family Homes)
Jul 14 Jun 14 Jul 13
Home Sales: 212 189 259
Median Price: $1 ,073,500 $1 ,200,000 $ 890,000
Av erage Price: $1 ,415,184 $1 ,617,191 $1 ,304,399
Sale/List Price Ratio: 110.7% 111.0% 107.0%
Day s on Market: 30 27 32
(Lof ts/Tow nhomes/TIC)
Jul 14 Jun 14 Jul 13
Condo Sales: 266 275 327
Median Price: $ 9 44,500 $ 9 75,000 $ 8 60,000
Av erage Price: $1 ,098,373 $1 ,181,657 $1 ,003,320
Sale/List Price Ratio: 107.1% 107.4% 105.8%
Day s on Market: 33 33 36
San Francisco Price Differences
from January 2014 & Peak & Trough
Homes: detached
YTD Peak % Trough % Peak Trough
3-month 18% 20% 79% Jun-07 Feb-12
12-month 8% 13% 48% Apr-08 Mar-12
Homes: attached
3-month 14% 22% 59% Jul-08 Jan-12
12-month 8% 19% 43% Aug-08 Jan-12
Condo/loft sales were down 18.7% compared to
last July.
The sale price to list price ratio stayed over 100%
for the twenty-ninth month in a row: 107.1%.
This is an extraordinarily tough market
for buyers. It's important to be calm
and realistic. If you don't know what to
do or where to begin, give me a call
and let's discuss your situation and
your options.
Lack of Inventory Plagues Market
With the increase in prices over the past two years
pulling most homeowners above water, one would
expect more homes on the market.
In fact, the lack of active listings continues to
hobble the market.
Right now, there are 240 homes on the market.
That’s just a tad over one month of sales.
Pending sales of single-family, re-sale homes, a
harbinger of future closed sales, have also been
anemic. There are only 167 homes pending.
There are three reasons for the lack of active
listings and pending sales.
First, many long-time homeowners have a lot of
equity in their properties, thus, they will be subject
to capital gains.
Second, credit, while becoming easier to obtain, is
still much more difficult to qualify for than in the
past.
Third, retirees are staying put in larger numbers
than before. They want to be near their families.
Plus, they are leaving their homes to their families.
JULY MARKET STATISTICS
The median price for homes was up 20.6% year-over-
year in June to $1,073,500. The average
price was up 8.5% to $1,617,191. Both these
prices are down from June.
Single-family, re-sale home sales was down
18.1% year-over-year.
The sales price to list price ratio for homes has
been over 100% for twenty-eight of the past
twenty-nine months. It was 110.7% last month.
SALES MOMENTUM…
for homes continued to drop, falling 4.2 points to -
18.3. Sales momentum for condos/lofts fell 3.7
points to –3.3.
PRICING MOMENTUM…
for single-family homes was up 0.2 of a points to
+15. Pricing momentum for condos/lofts was up a
full point to +12.8.
CONDO/LOFT STATISTICS
The median price of condos/lofts fell 3.1% from
June. Year-over-year, the median price was up
9.8%.
Hill & Company
1880 Lombard Street
San Francisco 94123
Fax: (415) 202-1686
Cell: (415) 819-2663
AnnieWilliamsSF@gmail.com
http://www.anniewilliamshomes.com
DRE #01393923
Annie Williams | AnnieWilliamsSF@gmail.com | Fax: (415) 202-1686
50.0%
40.0%
30.0%
20.0%
10.0%
0.0%
-10.0%
-20.0%
-30.0%
-40.0%
0
9
FMAM J J A SOND 1
0
FMAM J J A SOND 1
1
FMAM J J A SOND 1
2
FMAM J J A S OND 1
3
FMAM J J A SOND 1
4
FMAM J J
San Francisco Homes: Year-Over-Year Median Sales Price Change
2. 30-Year Fixed Mortgage Rates
04-14
01-14
10-13
07-13
04-13
01-13
10-12
07-12
04-12
01-12
10-11
07-11
04-11
01-11
10-10
07-10
04-10
01-10
10-09
07-09
04-09
01-09
10-08
07-08
04-08
01-08
10-07
07-07
04-07
01-07
10-06
07-06
04-06
3.0% 4.0% 5.0% 6.0% 7.0% 8.0%
Page 2
The Real Estate Report
The chart above shows the Na-tional
monthly average for 30-
year fixed rate mortgages as
compiled by HSH.com. The av-erage
includes mortgages of all
sizes, including conforming,
expanded conforming, and
jumbo.
MORTGAGE RATE OUTLOOK
Fed Message Bumps Rates, A Little
August 1, 2014 -- One of these days, and probably not
long from now, the Federal Reserve is going to again
surprise the market in a meaningful way, causing all
manner of unintended consequences. This week, the
Fed did present a little different message in regard to
inflation and the economy, and the market jumped,
only to settle back amid an ongoing litany of global
troubles.
It won't be this way forever, where beneficial and
countervailing forces keep rates from starting an
upward march. For the moment, whether by inertia or
other reasons, mortgage and other interest rates
remain grounded.
HSH.com's broad-market mortgage tracker -- our
weekly Fixed-Rate Mortgage Indicator (FRMI) --
found that the overall average rate for 30-year fixed-rate
mortgages increased by four basis points
(0.04%) back to 4.22%, where it stood two weeks
ago. The FRMI's 15-year companion also added four
basis points, rising to an average rate of 3.47%.
Popular FHA-backed 30-year FRMs saw just a two
basis point increase, ticking up to 3.94%, as these
fully-insured offerings continue to beat conforming
30-year FRMs by almost a quarter percentage point.
Finally, the overall 5/1 Hybrid ARM rose by five basis
points, closing HSH's survey week at 3.14%, its high-est
value since early April.
Spending for new construction slumped in June,
pulled down 1.8 percent from May, as outlays for
residential projects eased by 0.3 percent, commercial
building subtracted 1.6 percent and public expendi-tures
slumped by a full 4 percent at the end of the
fiscal (and school) year in many places.
The accumulation of news of an improving economy
is good news, and as the evidence mounts that the
economy no longer needs the Fed, interest rates will
begin to rise at some point. For at least the moment,
we continue to have sufficient global troubles to keep
investors on the defensive, helping to keep the lid on
any increases, but those can only do so much for so
long. Once stock market players come to the realiza-tion
that a growing economy will be better for equity
prices and their holdings in the long haul than is a
loose Fed, they will also begin to shun low-yielding
bonds to some degree, helping yields and interest
rates to rise. While that day is eventually coming, it's
not likely to be tomorrow or even next week at this
point, but it will come.
350
300
250
200
150
100
50
0
$1,700
$1,500
$1,300
$1,100
$900
$700
$500
$300
0
9
FMAMJ J ASOND 1
0
FMAMJ J ASOND 1
1
FMAMJ J ASOND 1
2
FMAMJ J ASOND 1
3
FMAMJ J ASOND 1
4
FMAMJ J
San Francisco Homes: Sold Prices Unit Sales
(3-month moving average —$000's)
Ave Med Units
3. July Sales Statistics
(Single-family Homes)
Unit
Prices Yearly Change Monthly Change
Median Average Sales DOM SP/LP Median Average Sales Median Average Sales
San Francisco $1 ,073,500 $1 ,415,184 212 30 110.7% 20.6% 8.5% -18.1% -10.5% -12.5% 12.2%
D1: Northwest $ 1,462,000 $1 ,697,690 19 23 112.9% 12.5% 18.0% -17.4% -10.0% 3.4% 11.8%
D2: Central West $1 ,061,000 $1 ,149,093 42 26 115.1% 21.6% 27.0% -30.0% 8.3% 0.1% 35.5%
D3: Southwest $ 705,000 $ 7 67,853 19 39 115.2% -0.7% 1.8% 0.0% -36.4% -25.4% 90.0%
D4: Twin Peaks $1 ,115,000 $1 ,314,310 21 20 117.2% 7.2% 15.0% -32.3% -20.4% -12.4% -27.6%
D5: Central $ 1,890,000 $1 ,863,948 28 31 109.9% 14.3% 3.7% -12.5% -18.7% -18.5% 0.0%
D6: Central North $ 2,452,000 $2 ,426,000 4 15 113.6% 37.6% 54.1% -20.0% -15.8% -6.1% 0.0%
D7: North $ 4,200,000 $5 ,372,778 9 61 98.4% -15.5% -13.8% -30.8% 9.4% 31.1% -35.7%
D8: Northeast $1 ,425,000 $1 ,425,000 1 15 110.0% -32.1% -23.1% -66.7% -48.3% -66.8% -66.7%
D9: Central East $1 ,300,000 $1 ,374,932 25 25 116.9% 40.5% 35.5% 19.0% 17.6% 19.0% 150.0%
D10: Southeast $ 7 09,000 $ 7 10,531 44 38 109.8% 15.1% 18.5% -20.0% -0.1% -5.1% 2.3%
01-06
4. Table Definitions
_______________
Median Price
The price at which 50% of
prices were higher and
50%were lower.
Average Price
Add all prices and divide by the
number of sales.
SP/LP
Sales price to list price ratio or
the price paid for the property
divided by the asking price.
DOI
Days of Inventory, or how many
days it would take to sell all the
property for sale at the current
rate of sales.
Pend
Property under contract to sell
that hasn’t closed escrow.
Inven
Number of properties actively
for sale as of the last day of the
month.
40.0%
30.0%
20.0%
10.0%
0.0%
-10.0%
-20.0%
FORECLOSURE STATISTICS
Notices of default, the first step in the foreclosure proc-ess,
in San Francisco continues to drop. They plum-meted
30% in June from May. Year-over-year, notices
were down 26.3%. There were 28 notices in June.
Notices of sale, which set the date and time of an auc-tion,
and serve as the homeowner's final notice before
sale, 24.3% from May, and they were down 37.8%
year-over-year. There were 28.
After the filing of a Notice of Trustee Sale, there are
only three possible outcomes. First, the sale can be
cancelled for reasons that include a successful loan
modification or short sale, a filing error, or a legal re-quirement
to re-file the notice after extended postpone-ments.
Alternatively, if the property is taken to sale, the bank
will place the opening bid. If a third party, typically an
investor, bids more than the bank's opening bid, the
property will be sold to the third party; if not, it will go
back to the bank.
There were 20 sales cancelled last month.
Seven homes went back to the bank in June.
There are currently 119 properties scheduled for sale.
With the recent surge in prices, many of them will
probably be cancelled.
The total number of properties owned by the banks was
down 19.2% year-over-year. The banks now own ap-proximately
231 properties in the city.
350
300
250
200
150
100
50
0
$1,300
$1,100
$900
$700
$500
$300
0
9
FMAM J J ASOND 1
0
FMAM J J ASOND 1
1
FMAM J J ASOND 1
2
FMAMJ J ASOND 1
3
FMAMJ J ASOND 1
4
FMAMJ J
San Francisco Condos: Sold Prices Unit Sales
(3-month moving average —$000's)
Ave Med Units