Toronto real estate statistics august 2011
•
0 gostou•450 visualizações

Toronto Real Estate Market Statistics for August 2011. Focus on East End Toronto Homes and East End Toronto Real Estate. The Beaches, Riverdale, Leslieville, Danforth Village, East Danforth, Danforth Mosaic

Recomendados
Recomendados
Mais conteúdo relacionado
Mais procurados
Mais procurados (13)
Semelhante a Toronto real estate statistics august 2011
Semelhante a Toronto real estate statistics august 2011 (20)
Mais de John Helfrich
Mais de John Helfrich (20)
Último
Último (20)
Toronto real estate statistics august 2011
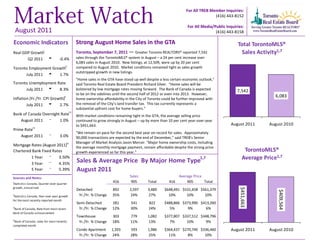
- 1. For All TREB Member Inquiries: (416) 443-8152 For All Media/Public Inquiries: August 2011 (416) 443-8158 Economic Indicators Strong August Home Sales in the GTA Total TorontoMLS® Real GDP Growthi Toronto, September 7, 2011 — Greater Toronto REALTORS® reported 7,542 Sales Activity1,7 Q2 2011 u -0.4% sales through the TorontoMLS® system in August – a 24 per cent increase over 6,083 sales in August 2010. New listings, at 12,509, were up by 20 per cent Toronto Employment Growthi i compared to August 2010. Market conditions remained tight as sales growth outstripped growth in new listings. July 2011 t 1.7% "Home sales in the GTA have stood up well despite a less certain economic outlook," Toronto Unemployment Rate said Toronto Real Estate Board President Richard Silver. "Home sales will be July 2011 u 8.3% bolstered by low mortgage rates moving forward. The Bank of Canada is expected 7,542 to be on the sidelines until the second half of 2012 or even into 2013. However, ii 6,083 Inflation (Yr./Yr. CPI Growth) home ownership affordability in the City of Toronto could be further improved with July 2011 u 2.7% the removal of the City’s land transfer tax. This tax currently represents a substantial upfront cost for home buyers.” iii Bank of Canada Overnight Rate With market conditions remaining tight in the GTA, the average selling price August 2011 q 1.0% continued to grow strongly in August – up by more than 10 per cent year-over-year to $451,663. August 2011 August 2010 iv Prime Rate "We remain on pace for the second best year on record for sales. Approximately August 2011 q 3.0% 90,000 transactions are expected by the end of December," said TREB's Senior iv Manager of Market Analysis Jason Mercer. "Major home ownership costs, including Mortgage Rates (August 2011) the average monthly mortgage payment, remain affordable despite the strong price Chartered Bank Fixed Rates growth experienced so far this year." TorontoMLS® 1 Year q 3.50% Sales & Average Price By Major Home Type 1,7 Average Price1,7 3 Year q 4.35% 5 Year q 5.39% August 2011 Sources and Notes: Sales Average Price i Statistics Canada, Quarter-over-quarter 416 905 Total 416 905 Total growth, annualized $451,663 Detached 892 2,597 3,489 $648,491 $531,458 $561,379 $409,564 ii Statistics Canada, Year-over-year growth Yr./Yr. % Change 35% 24% 27% 10% 10% 10% for the most recently reported month Semi-Detached 281 541 822 $488,866 $373,990 $413,260 iii Bank of Canada, Rate from most recent Yr./Yr. % Change 12% 30% 24% 5% 9% 6% Bank of Canada announcement Townhouse 303 779 1,082 $377,807 $337,512 $348,796 iv Bank of Canada, rates for most recently Yr./Yr. % Change 18% 11% 13% 7% 10% 9% completed month Condo Apartment 1,393 593 1,986 $364,437 $270,740 $336,460 August 2011 August 2010 Yr./Yr. % Change 24% 28% 25% 11% 8% 10%
- 2. Toronto Real Estate Board SALES BY PRICE RANGE AND HOUSE TYPE1,7 Industrial Leasing AUGUST 2011 Price Range Detached Semi-Detached Att/Row/Twnhouse Condo Townhouse Condo Apt Link Co-op Apt Det Condo Co-ownership Apt Total $0 to $99,999 3 0 0 3 16 0 0 0 0 22 $100,000 to $199,999 79 11 3 76 260 1 5 0 1 436 $200,000 to $299,999 318 88 100 214 709 30 1 3 3 1,466 $300,000 to $399,999 652 349 188 226 570 33 3 2 1 2,024 $400,000 to $499,999 701 253 134 38 250 54 1 3 0 1,434 $500,000 to $599,999 608 64 35 21 101 17 0 0 0 846 $600,000 to $699,999 428 26 12 10 25 5 0 0 0 506 $700,000 to $799,999 244 16 7 3 20 0 0 0 0 290 $800,000 to $899,999 159 4 3 4 6 0 0 0 0 176 $900,000 to $999,999 86 2 1 1 3 0 0 0 0 93 $1,000,000 to $1,249,999 97 5 2 0 9 0 0 0 0 113 $1,250,000 to $1,499,999 55 4 0 0 8 0 0 0 0 67 $1,500,000 to $1,749,999 26 0 0 1 4 0 0 0 0 31 $1,750,000 to $1,999,999 5 0 0 0 0 0 0 0 0 5 $2,000,000 + 28 0 0 0 5 0 0 0 0 33 Total Sales 3,489 822 485 597 1,986 140 10 8 5 7,542 Share of Total Sales 46.3% 10.9% 6.4% 7.9% 26.3% 1.9% 0.1% 0.1% 0.1% - Average Price $561,379 $413,260 $391,818 $313,846 $336,460 $400,206 $240,500 $354,169 $243,500 $451,663 SALES BY PRICE RANGE AND HOUSE TYPE1,7 YEAR-TO-DATE, 2011 Price Range Detached Semi-Detached Att/Row/Twnhouse Condo Townhouse Condo Apt Link Co-op Apt Det Condo Co-ownership Apt Total $0 to $99,999 24 1 5 36 155 0 11 0 4 236 $100,000 to $199,999 561 161 60 619 2,311 15 40 2 15 3,784 $200,000 to $299,999 2,697 802 940 1,815 5,222 263 17 22 27 11,805 $300,000 to $399,999 5,798 2,762 1,805 1,779 4,592 256 13 20 5 17,030 $400,000 to $499,999 6,249 1,935 1,050 391 1,777 374 6 16 0 11,798 $500,000 to $599,999 5,042 591 379 155 731 124 4 6 1 7,033 $600,000 to $699,999 3,315 342 152 96 278 19 0 0 0 4,202 $700,000 to $799,999 1,891 175 72 36 150 2 0 2 0 2,328 $800,000 to $899,999 1,208 87 37 20 64 0 0 2 0 1,418 $900,000 to $999,999 717 30 14 12 42 0 0 0 0 815 $1,000,000 to $1,249,999 969 45 13 10 69 0 1 0 0 1,107 $1,250,000 to $1,499,999 577 21 8 6 27 0 0 0 0 639 $1,500,000 to $1,749,999 291 14 4 2 26 0 0 0 0 337 $1,750,000 to $1,999,999 169 9 2 0 9 0 0 1 0 190 $2,000,000 + 391 14 0 0 30 0 0 0 0 435 Total Sales 29,899 6,989 4,541 4,977 15,483 1,053 92 71 52 63,157 Share of Total Sales 47.3% 11.1% 7.2% 7.9% 24.5% 1.7% 0.1% 0.1% 0.1% - Average Price $581,139 $428,940 $393,944 $315,865 $329,588 $387,813 $228,330 $401,288 $221,492 $464,029 Page 3 July 2010 Market Watch, August 2011 2
- 3. Toronto Real Estate Board ALL HOME TYPES, AUGUST 2011 SUMMARY OF EXISTING HOME TRANSACTIONS ALL TREB AREAS Sales1 Average Selling Price1 1 Number of Sales Yr./Yr. % Change Dollar Volume Avg. Price Level Yr./Yr. % Change Median Price1 New Listings2 Active Listings3 Avg. SP/LP 4 Avg. DOM5 TREB Total 7,542 24.0% $3,406,442,822 $451,663 10.3% $389,275 12,509 17,258 98% 27 Halton Region 438 34.8% $226,061,614 $516,122 12.0% $443,500 683 986 97% 27 Burlington 61 41.9% $24,858,350 $407,514 -5.7% $360,000 88 143 98% 30 Halton Hills 87 47.5% $40,384,350 $464,188 12.8% $432,500 107 184 98% 34 Milton 139 31.1% $62,081,664 $446,631 12.1% $428,000 223 224 98% 18 Oakville 151 29.1% $98,737,250 $653,889 18.4% $552,250 265 435 96% 29 Peel Region 1,692 20.3% $695,856,560 $411,263 8.5% $376,000 2,898 3,498 98% 23 Brampton 692 24.7% $271,775,041 $392,738 13.2% $372,750 1,298 1,447 97% 23 Caledon 66 26.9% $33,637,450 $509,658 -6.1% $492,000 132 278 97% 36 Mississauga 934 16.9% $390,444,069 $418,034 7.0% $375,000 1,468 1,773 98% 23 City of Toronto 2,898 25.0% $1,347,172,255 $464,863 10.6% $387,000 4,831 6,611 99% 26 ! TURN PAGE FOR CITY OF TORONTO TABLES OR CLICK HERE: York Region 1,477 26.2% $805,113,845 $545,101 13.0% $488,000 2,343 3,046 98% 25 Aurora 82 30.2% $41,246,350 $503,004 3.3% $441,900 108 156 99% 27 E. Gwillimbury 17 -46.9% $8,960,500 $527,088 28.8% $505,000 46 100 98% 40 Georgina 82 51.9% $25,286,311 $308,370 9.1% $280,000 109 308 97% 50 King 21 61.5% $15,201,800 $723,895 -14.0% $720,000 40 168 96% 48 Markham 421 26.0% $236,740,624 $562,329 10.3% $515,000 715 669 99% 18 Newmarket 123 41.4% $51,526,950 $418,918 10.2% $390,000 147 162 98% 26 Richmond Hill 401 36.9% $247,888,976 $618,177 25.9% $559,000 613 656 98% 23 Vaughan 269 12.1% $145,611,834 $541,308 11.3% $487,000 438 598 98% 23 Whitchurch-Stouffville 61 13.0% $32,650,500 $535,254 -5.4% $464,500 127 229 97% 37 Durham Region 815 20.7% $258,304,278 $316,938 1.1% $294,000 1,401 2,251 98% 33 Ajax 163 66.3% $54,463,240 $334,130 -0.5% $325,500 260 317 98% 24 Brock 21 40.0% $6,126,900 $291,757 30.0% $219,000 39 139 95% 58 Clarington 129 18.3% $39,004,073 $302,357 7.3% $271,000 241 394 98% 38 Oshawa 245 18.9% $65,154,805 $265,938 -4.0% $245,000 424 653 98% 33 Pickering 92 4.5% $34,350,340 $373,373 2.1% $347,500 166 236 98% 28 Scugog 21 -8.7% $6,879,400 $327,590 -1.5% $297,000 32 127 97% 53 Uxbridge 30 66.7% $14,686,300 $489,543 14.4% $460,000 57 138 97% 72 Whitby 114 -3.4% $37,639,220 $330,169 -2.8% $312,500 182 247 98% 26 Dufferin County 46 -20.7% $15,143,100 $329,198 8.0% $288,000 76 139 98% 45 Orangeville 46 -20.7% $15,143,100 $329,198 8.0% $288,000 76 139 98% 45 Simcoe County 176 34.4% $58,791,170 $334,041 8.2% $284,000 277 727 98% 53 Adjala-Tosorontio 21 110.0% $10,026,800 $477,467 34.1% $470,000 22 105 98% 72 Bradford West Gwillimbury 46 109.1% $17,752,500 $385,924 16.3% $327,500 76 132 98% 43 Essa 28 180.0% $7,377,300 $263,475 -20.3% $239,000 33 93 97% 58 Innisfil 34 -15.0% $9,437,900 $277,585 -1.2% $258,950 76 227 97% 61 New Tecumseth 47 -4.1% $14,196,670 $302,057 -1.6% $275,000 70 170 97% 46 Page 3 July 2010 Market Watch, August 2011 3
- 4. Toronto Real Estate Board ALL HOME TYPES, AUGUST 2011 SUMMARY OF EXISTING HOME TRANSACTIONS CITY OF TORONTO Industrial Leasing MUNICIPAL BREAKDOWN Sales1 Average Selling Price1 1 1 2 3 4 5 Number of Sales Yr./Yr. % Change Dollar Volume Avg. Price Level Yr./Yr. % Change Median Price New Listings Active Listings Avg. SP/LP Avg. DOM TREB Total 7,542 24.0% $3,406,442,822 $451,663 10.3% $389,275 12,509 17,258 98% 27 City of Toronto Total 2,898 25.0% $1,347,172,255 $464,863 10.6% $387,000 4,831 6,611 99% 26 Toronto West 685 36.5% $285,188,427 $416,333 8.8% $374,000 1,228 1,947 99% 29 Toronto W01 47 74.1% $23,091,300 $491,304 0.4% $394,000 68 99 101% 27 Toronto W02 61 52.5% $32,151,400 $527,072 0.2% $505,000 89 81 101% 21 Toronto W03 67 31.4% $24,241,719 $361,817 16.9% $347,500 121 160 99% 24 Toronto W04 65 66.7% $22,201,900 $341,568 14.2% $329,000 132 225 98% 36 Toronto W05 92 17.9% $31,743,900 $345,042 15.2% $353,000 171 375 98% 33 Toronto W06 80 5.3% $32,196,028 $402,450 2.5% $378,000 170 284 98% 31 Toronto W07 23 -43.9% $15,390,500 $669,152 54.2% $649,000 31 37 99% 26 Toronto W08 122 103.3% $60,835,480 $498,651 -11.5% $476,000 189 262 99% 29 Toronto W09 46 76.9% $17,964,100 $390,524 7.8% $374,500 87 145 99% 27 Toronto W10 82 28.1% $25,372,100 $309,416 21.9% $329,250 170 279 98% 28 Toronto Central 1,395 24.4% $745,168,785 $534,171 10.2% $415,000 2,250 3,014 99% 26 Toronto C01 413 24.4% $179,058,689 $433,556 17.4% $378,900 721 1,060 100% 30 Toronto C02 42 -23.6% $34,520,200 $821,910 -16.3% $612,500 84 152 97% 24 Toronto C03 55 44.7% $36,531,088 $664,202 4.2% $577,500 81 102 98% 23 Toronto C04 57 16.3% $43,719,068 $767,001 10.7% $815,000 91 132 100% 23 Toronto C06 25 -19.4% $13,582,898 $543,316 10.4% $540,000 48 57 99% 24 Toronto C07 108 20.0% $53,108,328 $491,744 22.5% $417,450 170 203 99% 24 Toronto C08 166 26.7% $65,691,325 $395,731 5.5% $362,250 228 280 99% 24 Toronto C09 21 31.3% $21,391,030 $1,018,620 5.7% $885,000 31 44 99% 26 Toronto C10 43 -23.2% $31,898,795 $741,832 20.9% $625,000 56 70 100% 21 Toronto C11 45 114.3% $23,909,124 $531,314 1.7% $298,000 61 70 99% 29 Toronto C12 39 50.0% $50,740,188 $1,301,030 -7.1% $848,000 55 123 95% 34 Toronto C13 64 25.5% $26,854,488 $419,601 6.6% $377,950 107 131 100% 25 Toronto C14 182 25.5% $96,758,674 $531,641 27.8% $410,500 320 361 99% 21 Toronto C15 135 68.8% $67,404,890 $499,295 30.2% $430,000 197 229 99% 25 Toronto East 818 17.7% $316,815,043 $387,304 12.7% $370,000 1,353 1,650 100% 23 Toronto E01 54 12.5% $30,130,227 $557,967 21.3% $511,000 95 110 102% 20 Toronto E02 59 28.3% $34,389,000 $582,864 11.3% $483,000 89 75 101% 18 Toronto E03 57 -17.4% $23,514,952 $412,543 11.5% $410,000 101 134 100% 27 Toronto E04 107 48.6% $38,418,029 $359,047 33.5% $375,000 155 188 100% 22 Toronto E05 107 21.6% $40,042,177 $374,226 9.4% $338,000 160 133 101% 20 Toronto E06 32 -23.8% $14,396,400 $449,888 10.2% $410,500 59 61 99% 26 Toronto E07 102 30.8% $38,694,318 $379,356 22.1% $370,900 178 210 100% 21 Toronto E08 51 -12.1% $19,407,600 $380,541 17.2% $340,000 86 155 98% 24 Toronto E09 112 16.7% $33,266,890 $297,026 9.7% $298,250 190 277 98% 28 Toronto E10 47 27.0% $19,362,700 $411,972 5.7% $410,000 76 91 98% 20 Toronto E11 90 47.5% $25,192,750 $279,919 0.4% $258,500 164 216 98% 29 Page 3 July 2010 Market Watch, August 2011 4
- 5. Toronto Real Estate Board ALL HOME TYPES, YEAR-TO-DATE 2011 SUMMARY OF EXISTING HOME TRANSACTIONS IndustrialAREAS ALL TREB Leasing Sales1 Average Selling Price1 Number of Sales Yr./Yr. % Change Dollar Volume1 Avg. Price Level Yr./Yr. % Change Median Price1 New Listings2 Avg. SP/LP 4 Avg. DOM5 TREB Total 63,157 0.8% $29,306,683,753 $464,029 8.0% $390,000 105,803 99% 25 Halton Region 3,723 11.0% $1,937,789,290 $520,491 9.8% $439,900 5,984 98% 26 Burlington 451 13.0% $197,640,695 $438,228 10.3% $364,000 682 97% 30 Halton Hills 675 2.7% $291,444,541 $431,770 4.4% $397,000 1,015 98% 30 Milton 1,115 11.2% $474,865,828 $425,889 3.8% $399,000 1,777 99% 20 Oakville 1,482 14.5% $973,838,226 $657,111 13.7% $549,450 2,510 97% 29 Peel Region 13,448 -4.8% $5,477,699,008 $407,324 6.2% $370,000 22,358 98% 23 Brampton 5,436 -4.9% $2,055,875,122 $378,196 7.5% $360,000 9,197 98% 22 Caledon 566 1.6% $291,666,111 $515,311 1.8% $455,500 1,034 97% 30 Mississauga 7,446 -5.1% $3,130,157,775 $420,381 5.7% $375,200 12,127 98% 23 City of Toronto 25,081 0.4% $12,549,448,543 $500,357 7.5% $398,000 42,535 100% 24 ! TURN PAGE FOR CITY OF TORONTO TABLES OR CLICK HERE: York Region 12,182 6.7% $6,557,449,433 $538,290 9.3% $480,150 19,568 99% 23 Aurora 681 8.1% $349,579,069 $513,332 6.0% $440,000 1,023 98% 25 E. Gwillimbury 186 -12.3% $82,325,478 $442,610 2.5% $386,000 360 97% 39 Georgina 577 -1.4% $163,704,178 $283,716 -2.0% $270,000 1,096 97% 42 King 156 -13.8% $118,746,577 $761,196 8.9% $681,500 427 94% 54 Markham 3,278 7.1% $1,830,305,819 $558,361 7.0% $504,950 5,075 100% 19 Newmarket 1,022 2.0% $422,263,365 $413,174 8.5% $381,500 1,421 98% 23 Richmond Hill 3,161 10.3% $1,882,925,731 $595,674 15.0% $543,000 5,132 99% 20 Vaughan 2,593 6.5% $1,416,995,629 $546,470 8.1% $492,500 4,075 98% 23 Whitchurch-Stouffville 528 18.9% $290,603,587 $550,386 4.9% $460,000 959 97% 33 Durham Region 6,988 -2.0% $2,217,333,465 $317,306 4.4% $292,000 12,242 98% 30 Ajax 1,256 -3.3% $432,209,017 $344,115 3.5% $328,000 2,142 98% 25 Brock 135 23.9% $33,494,280 $248,106 -6.4% $220,000 350 96% 69 Clarington 1,010 -7.5% $281,228,152 $278,444 3.4% $261,000 1,896 98% 32 Oshawa 2,038 1.6% $546,072,533 $267,945 4.6% $245,500 3,591 98% 31 Pickering 918 -3.2% $347,501,089 $378,541 6.8% $345,000 1,484 98% 25 Scugog 201 -23.3% $72,098,859 $358,701 6.4% $326,900 432 97% 50 Uxbridge 251 5.9% $118,030,010 $470,239 12.6% $430,000 475 97% 54 Whitby 1,179 0.3% $386,699,525 $327,989 3.1% $312,500 1,872 98% 23 Dufferin County 430 -3.2% $138,325,131 $321,686 3.0% $298,750 660 98% 35 Orangeville 430 -3.2% $138,325,131 $321,686 3.0% $298,750 660 98% 35 Simcoe County 1,305 6.0% $428,638,883 $328,459 5.7% $294,000 2,456 97% 50 Adjala-Tosorontio 102 -5.6% $43,963,200 $431,012 12.1% $388,750 232 97% 72 Bradford West Gwillimbury 349 13.7% $123,761,677 $354,618 5.6% $332,500 561 98% 35 Essa 178 19.5% $49,735,689 $279,414 -7.9% $250,000 371 97% 54 Innisfil 322 4.2% $102,259,905 $317,577 13.5% $277,750 689 96% 59 New Tecumseth 354 -1.1% $108,918,412 $307,679 3.6% $284,000 603 97% 50 Page 3 July 2010 Market Watch, August 2011 5
- 6. Toronto Real Estate Board Industrial Leasing ALL HOME TYPES, YEAR-TO-DATE 2011 SUMMARY OF EXISTING HOME TRANSACTIONS CITY OF TORONTO MUNICIPAL BREAKDOWN Sales1 Average Selling Price1 1 1 2 4 5 Number of Sales Yr./Yr. % Change Dollar Volume Avg. Price Level Yr./Yr. % Change Median Price New Listings Avg. SP/LP Avg. DOM TREB Total 63,157 0.8% $29,306,683,753 $464,029 8.0% $390,000 105,803 99% 25 City of Toronto Total 25,081 0.4% $12,549,448,543 $500,357 7.5% $398,000 42,535 100% 24 Toronto West 5,981 -2.4% $2,616,214,944 $437,421 5.0% $380,000 10,621 99% 27 Toronto W01 516 12.9% $275,860,051 $534,613 1.8% $428,500 883 102% 21 Toronto W02 593 -0.3% $316,868,457 $534,348 4.5% $478,000 833 102% 17 Toronto W03 504 0.0% $173,768,922 $344,780 4.8% $344,500 908 99% 26 Toronto W04 527 0.0% $177,940,559 $337,648 6.2% $330,000 956 98% 33 Toronto W05 749 -5.7% $255,080,556 $340,561 8.0% $342,000 1,516 97% 33 Toronto W06 767 -10.9% $328,623,921 $428,454 5.1% $400,000 1,529 99% 28 Toronto W07 431 -17.4% $236,569,100 $548,884 10.1% $539,000 589 100% 22 Toronto W08 850 -3.3% $516,938,759 $608,163 3.9% $515,000 1,451 99% 25 Toronto W09 368 9.5% $145,120,353 $394,349 3.0% $412,500 709 99% 34 Toronto W10 676 3.5% $189,444,266 $280,243 7.0% $284,500 1,247 97% 30 Toronto Central 12,002 3.9% $7,089,627,585 $590,704 7.2% $426,100 20,225 99% 24 Toronto C01 3,331 10.8% $1,432,231,312 $429,970 5.4% $377,900 6,250 99% 27 Toronto C02 573 -6.7% $514,167,457 $897,325 14.2% $658,900 1,004 99% 25 Toronto C03 395 -6.0% $330,836,865 $837,562 1.7% $571,500 671 99% 26 Toronto C04 710 -13.0% $630,373,879 $887,851 8.2% $810,750 1,146 100% 21 Toronto C06 260 15.0% $137,515,485 $528,906 -3.1% $522,750 428 99% 21 Toronto C07 998 9.0% $490,002,639 $490,985 12.5% $403,850 1,499 99% 23 Toronto C08 1,202 -6.1% $513,909,716 $427,546 9.8% $379,900 1,976 99% 24 Toronto C09 275 12.7% $345,567,495 $1,256,609 6.2% $925,000 402 99% 24 Toronto C10 666 -0.1% $536,858,185 $806,093 12.5% $585,000 939 100% 22 Toronto C11 294 13.1% $179,130,520 $609,287 11.6% $491,250 466 102% 25 Toronto C12 285 -8.7% $444,806,743 $1,560,725 9.1% $1,325,000 539 97% 28 Toronto C13 513 1.0% $246,120,638 $479,767 14.1% $396,300 842 101% 22 Toronto C14 1,499 12.4% $797,893,370 $532,284 13.5% $400,800 2,452 100% 20 Toronto C15 1,001 5.4% $490,213,281 $489,724 10.0% $420,000 1,611 100% 22 Toronto East 7,098 -2.9% $2,843,606,014 $400,621 7.9% $375,000 11,689 100% 21 Toronto E01 626 -0.6% $342,168,444 $546,595 13.1% $520,500 1,028 103% 14 Toronto E02 612 2.7% $385,158,679 $629,344 3.8% $540,661 990 101% 14 Toronto E03 828 -6.1% $364,929,435 $440,736 6.7% $430,000 1,338 101% 20 Toronto E04 702 8.7% $229,015,691 $326,233 11.3% $345,000 1,167 100% 22 Toronto E05 788 2.7% $286,821,150 $363,986 6.1% $324,950 1,134 101% 18 Toronto E06 400 -1.0% $181,204,055 $453,010 10.5% $404,300 657 99% 21 Toronto E07 680 2.3% $255,408,641 $375,601 12.1% $378,000 1,153 100% 19 Toronto E08 562 -8.6% $200,347,549 $356,490 11.8% $346,500 936 98% 29 Toronto E09 851 -11.0% $245,836,575 $288,880 5.7% $275,000 1,493 98% 27 Toronto E10 375 -7.4% $153,781,817 $410,085 2.0% $406,000 596 99% 21 Toronto E11 674 -9.2% $198,933,978 $295,154 -1.4% $285,000 1,197 99% 29 Page 3 July 2010 Market Watch, August 2011 6
- 7. Toronto Real Estate Board DETACHED HOUSES,Industrial Leasing AUGUST 2011 SUMMARY OF EXISTING HOME TRANSACTIONS ALL TREB AREAS Sales1 Dollar Volume1 Average Price1 Median Price1 New Listings2 Active Listings3 Avg. SP/LP 4 Avg. DOM5 TREB Total 3,489 - $1,958,650,767 - $561,379 - $499,000 - 6,005 - 8,695 - 98% - 27 - Halton Region 264 $164,967,414 $624,877 $545,250 443 716 96% 29 Burlington 23 $12,956,000 $563,304 $537,000 53 97 98% 31 Halton Hills 72 $36,287,950 $503,999 $481,750 82 152 97% 35 Milton 78 $40,268,264 $516,260 $483,250 139 164 98% 20 Oakville 91 - $75,455,200 - $829,178 - $670,000 - 169 - 303 - 95% - 32 - Peel Region 745 $399,486,943 $536,224 $492,000 1,428 1,815 97% 23 Brampton 397 $183,479,551 $462,165 $449,000 786 912 97% 23 Caledon 52 $28,757,050 $553,020 $531,000 107 254 97% 42 Mississauga 296 - $187,250,342 - $632,603 - $565,000 - 535 - 649 - 98% - 20 - City of Toronto 892 $578,453,772 $648,491 $535,500 1,452 1,664 99% 20 ! TURN PAGE FOR CITY OF TORONTO TABLES OR CLICK HERE: - - - - - - - - York Region 845 $554,029,077 $655,656 $605,000 1,382 2,048 98% 26 Aurora 38 $23,595,500 $620,934 $563,500 62 114 99% 23 E. Gwillimbury 17 $8,960,500 $527,088 $505,000 42 96 98% 40 Georgina 74 $23,336,811 $315,362 $291,000 104 300 97% 51 King 21 $15,201,800 $723,895 $720,000 39 155 96% 48 Markham 189 $140,163,698 $741,607 $688,000 339 315 99% 18 Newmarket 84 $38,888,850 $462,963 $443,500 92 110 98% 27 Richmond Hill 228 $177,984,944 $780,636 $698,000 361 399 98% 21 Vaughan 145 $97,614,474 $673,203 $595,000 234 351 97% 21 Whitchurch-Stouffville 49 - $28,282,500 - $577,194 - $501,000 - 109 - 208 - 96% - 40 - Durham Region 583 $203,647,711 $349,310 $329,000 1,012 1,713 98% 36 Ajax 104 $39,048,990 $375,471 $368,500 165 217 98% 26 Brock 19 $5,842,000 $307,474 $220,000 35 131 95% 52 Clarington 95 $31,882,550 $335,606 $300,000 189 314 97% 40 Oshawa 186 $53,615,131 $288,253 $265,450 316 485 98% 35 Pickering 59 $25,532,740 $432,758 $390,000 108 155 98% 29 Scugog 19 $6,319,400 $332,600 $297,000 30 124 97% 56 Uxbridge 28 $14,196,900 $507,032 $463,500 46 120 97% 73 Whitby 73 - $27,210,000 - $372,740 - $359,000 - 123 - 167 - 98% - 26 - Dufferin County 32 $11,725,750 $366,430 $311,000 59 96 98% 36 Orangeville 32 - $11,725,750 - $366,430 - $311,000 - 59 - 96 - 98% - 36 - Simcoe County 128 $46,340,100 $362,032 $307,000 229 643 97% 61 Adjala-Tosorontio 21 $10,026,800 $477,467 $470,000 22 105 98% 72 Bradford West Gwillimbury 25 $11,794,300 $471,772 $435,000 58 119 98% 60 Essa 21 $5,765,400 $274,543 $238,000 28 82 97% 64 Innisfil 31 $8,791,900 $283,610 $267,000 69 216 97% 64 New Tecumseth 30 $9,961,700 $332,057 $287,950 52 121 97% 48 Page 3 July 2010 Market Watch, August 2011 7
- 8. Toronto Real Estate Board DETACHED HOUSES, AUGUST 2011 Industrial Leasing SUMMARY OF EXISTING HOME TRANSACTIONS CITY OF TORONTO MUNICIPAL BREAKDOWN Sales1 Dollar Volume1 Average Price1 Median Price1 New Listings2 Active Listings3 Avg. SP/LP 4 Avg. DOM5 TREB Total 3,489 $1,958,650,767 $561,379 $499,000 6,005 8,695 98% 27 City of Toronto Total 892 $578,453,772 $648,491 $535,500 1,452 1,664 99% 20 Toronto West 293 $158,423,508 $540,695 $490,000 474 578 100% 23 Toronto W01 10 $8,945,000 $894,500 $817,000 16 12 101% 15 Toronto W02 21 $14,377,000 $684,619 $688,000 36 31 103% 14 Toronto W03 30 $10,937,000 $364,567 $333,500 69 100 98% 27 Toronto W04 36 $15,347,000 $426,306 $402,500 67 83 99% 25 Toronto W05 32 $14,865,350 $464,542 $443,500 37 62 99% 26 Toronto W06 28 $13,230,128 $472,505 $477,500 48 53 100% 16 Toronto W07 18 $12,951,000 $719,500 $655,000 21 21 100% 26 Toronto W08 54 $38,680,330 $716,302 $650,500 78 98 99% 28 Toronto W09 22 $12,211,500 $555,068 $509,500 29 38 99% 19 Toronto W10 42 $16,879,200 $401,886 $381,250 73 80 98% 26 Toronto Central 255 $248,853,373 $975,896 $824,000 389 530 99% 22 Toronto C01 1 $700,000 $700,000 $700,000 2 8 88% 40 Toronto C02 8 $6,574,000 $821,750 $658,000 14 24 98% 15 Toronto C03 21 $15,873,000 $755,857 $651,000 41 59 98% 21 Toronto C04 38 $36,610,568 $963,436 $858,600 67 97 100% 21 Toronto C06 15 $10,514,418 $700,961 $650,000 31 33 100% 19 Toronto C07 32 $25,221,188 $788,162 $692,500 46 63 99% 25 Toronto C08 - - - - 1 5 - - Toronto C09 5 $7,243,000 $1,448,600 $1,113,000 8 18 100% 22 Toronto C10 14 $13,351,000 $953,643 $844,500 13 13 100% 26 Toronto C11 11 $14,087,350 $1,280,668 $1,125,000 9 10 100% 20 Toronto C12 21 $40,431,688 $1,925,318 $1,288,000 35 95 95% 43 Toronto C13 14 $10,104,600 $721,757 $660,550 21 24 102% 14 Toronto C14 38 $38,555,388 $1,014,615 $890,000 57 49 101% 17 Toronto C15 37 $29,587,173 $799,653 $770,000 44 32 99% 16 Toronto East 344 $171,176,891 $497,607 $440,000 589 556 100% 17 Toronto E01 15 $10,795,888 $719,726 $635,000 24 26 105% 21 Toronto E02 18 $15,121,000 $840,056 $692,750 33 28 101% 21 Toronto E03 32 $16,045,397 $501,419 $433,572 71 81 101% 20 Toronto E04 62 $26,518,399 $427,716 $399,000 80 62 101% 15 Toronto E05 31 $17,326,477 $558,919 $537,500 62 39 103% 10 Toronto E06 23 $9,950,400 $432,626 $405,000 45 41 99% 19 Toronto E07 37 $19,727,940 $533,188 $510,000 54 38 100% 11 Toronto E08 26 $14,093,800 $542,069 $437,400 47 62 98% 18 Toronto E09 47 $17,766,840 $378,018 $365,000 72 69 99% 17 Toronto E10 32 $15,099,000 $471,844 $455,000 49 53 99% 16 Toronto E11 21 $8,731,750 $415,798 $427,000 52 57 99% 23 Page 3 July 2010 Market Watch, August 2011 8
- 9. Toronto Real Estate Board SEMI-DETACHED HOUSES,Industrial Leasing AUGUST 2011 SUMMARY OF EXISTING HOME TRANSACTIONS ALL TREB AREAS Sales1 Dollar Volume1 Average Price1 Median Price1 New Listings2 Active Listings3 Avg. SP/LP 4 Avg. DOM5 TREB Total 822 - $339,700,085 - $413,260 - $389,000 - 1,200 - 1,066 - 99% - 19 - Halton Region 46 $17,872,300 $388,528 $398,750 55 45 99% 19 Burlington 9 $3,505,000 $389,444 $411,500 9 7 98% 29 Halton Hills 3 $673,500 $224,500 $175,000 3 3 98% 45 Milton 25 $9,800,800 $392,032 $395,000 28 17 99% 16 Oakville 9- $3,893,000 - $432,556 - $451,500 - 15 - 18 - 98% - 11 - Peel Region 309 $114,206,278 $369,600 $365,000 461 381 99% 19 Brampton 156 $52,775,790 $338,306 $336,700 231 203 98% 19 Caledon 10 $3,569,400 $356,940 $356,500 14 8 99% 17 Mississauga 143 - $57,861,088 - $404,623 - $406,000 - 216 - 170 - 99% - 19 - City of Toronto 281 $137,371,286 $488,866 $438,000 403 411 100% 21 ! TURN PAGE FOR CITY OF TORONTO TABLES OR CLICK HERE: - - - - - - - - York Region 125 $54,832,596 $438,661 $430,000 175 119 100% 15 Aurora 11 $4,029,450 $366,314 $368,500 15 11 99% 16 E. Gwillimbury - - - - 1 2 - - Georgina - - - - - 3 - - King - - - - - - - - Markham 41 $18,884,046 $460,586 $437,500 53 26 101% 12 Newmarket 14 $4,964,700 $354,621 $359,000 20 21 100% 23 Richmond Hill 27 $13,087,900 $484,737 $490,000 37 18 99% 12 Vaughan 23 $10,441,500 $453,978 $458,000 40 31 99% 18 Whitchurch-Stouffville 9- $3,425,000 - $380,556 - $377,000 - 9- 7- 98% - 21 - Durham Region 46 $11,571,075 $251,545 $241,250 89 95 99% 17 Ajax 16 $4,856,400 $303,525 $307,000 21 14 98% 17 Brock - - - - - - - - Clarington 4 $834,500 $208,625 $209,250 4 7 97% 14 Oshawa 18 $3,561,175 $197,843 $199,750 40 46 99% 17 Pickering 4 $1,222,000 $305,500 $308,750 12 16 100% 19 Scugog 1 $215,000 $215,000 $215,000 2 2 98% 40 Uxbridge - - - - 3 2 - - Whitby 3- $882,000 - $294,000 - $297,000 - 7- 8- 102% - 6- Dufferin County 6 $1,399,850 $233,308 $233,375 11 12 98% 19 Orangeville 6 - $1,399,850 - $233,308 - $233,375 - 11 - 12 - 98% - 19 - Simcoe County 9 $2,446,700 $271,856 $255,000 6 3 99% 20 Adjala-Tosorontio - - - - - - - - Bradford West Gwillimbury 6 $1,769,700 $294,950 $298,350 6 2 99% 14 Essa - - - - - - - - Innisfil - - - - - - - - New Tecumseth 3 $677,000 $225,667 $225,000 - 1 97% 32 Page 3 July 2010 Market Watch, August 2011 9
- 10. Toronto Real Estate Board SEMI-DETACHED HOUSES, AUGUST 2011 Industrial Leasing SUMMARY OF EXISTING HOME TRANSACTIONS CITY OF TORONTO MUNICIPAL BREAKDOWN Sales1 Dollar Volume1 Average Price1 Median Price1 New Listings2 Active Listings3 Avg. SP/LP 4 Avg. DOM5 TREB Total 822 $339,700,085 $413,260 $389,000 1,200 1,066 99% 19 City of Toronto Total 281 $137,371,286 $488,866 $438,000 403 411 100% 21 Toronto West 88 $37,411,969 $425,136 $385,000 140 183 99% 24 Toronto W01 4 $2,766,000 $691,500 $710,500 5 3 111% 11 Toronto W02 18 $9,397,500 $522,083 $523,000 22 13 100% 17 Toronto W03 27 $10,712,219 $396,749 $387,000 38 43 99% 21 Toronto W04 3 $1,169,000 $389,667 $355,000 7 18 97% 70 Toronto W05 26 $9,472,050 $364,310 $349,500 51 87 96% 30 Toronto W06 1 $383,000 $383,000 $383,000 2 3 101% 10 Toronto W07 - - - - 1 1 - - Toronto W08 2 $1,037,500 $518,750 $518,750 3 2 100% 9 Toronto W09 4 $1,434,700 $358,675 $353,000 4 4 99% 16 Toronto W10 3 $1,040,000 $346,667 $358,000 7 9 97% 20 Toronto Central 79 $49,353,784 $624,731 $538,000 104 89 100% 22 Toronto C01 11 $7,060,786 $641,890 $612,000 20 19 101% 40 Toronto C02 8 $7,629,000 $953,625 $916,250 8 14 99% 25 Toronto C03 11 $6,555,000 $595,909 $480,000 10 10 98% 21 Toronto C04 2 $1,861,000 $930,500 $930,500 4 3 100% 7 Toronto C06 - - - - - - - - Toronto C07 8 $3,879,000 $484,875 $479,500 7 4 100% 19 Toronto C08 2 $1,669,000 $834,500 $834,500 7 9 103% 5 Toronto C09 3 $3,240,000 $1,080,000 $1,205,000 4 4 97% 55 Toronto C10 7 $4,326,410 $618,059 $601,000 4 1 101% 18 Toronto C11 2 $1,362,888 $681,444 $681,444 2 - 105% 7 Toronto C12 3 $1,584,500 $528,167 $526,500 1 - 101% 17 Toronto C13 12 $5,185,500 $432,125 $425,000 12 4 100% 19 Toronto C14 - - - - 1 2 - - Toronto C15 10 $5,000,700 $500,070 $493,400 24 19 103% 13 Toronto East 114 $50,605,533 $443,908 $414,500 159 139 100% 18 Toronto E01 22 $11,367,900 $516,723 $511,500 47 41 100% 22 Toronto E02 29 $14,662,100 $505,590 $471,000 33 18 102% 14 Toronto E03 11 $5,026,055 $456,914 $445,000 16 23 99% 30 Toronto E04 9 $2,939,500 $326,611 $328,500 15 17 99% 21 Toronto E05 9 $3,947,000 $438,556 $438,000 5 1 100% 16 Toronto E06 2 $1,134,000 $567,000 $567,000 4 6 99% 30 Toronto E07 12 $4,729,278 $394,107 $388,400 11 7 99% 16 Toronto E08 - - - - - 1 - - Toronto E09 2 $587,600 $293,800 $293,800 6 8 102% 14 Toronto E10 4 $1,098,000 $274,500 $282,500 5 3 98% 8 Toronto E11 14 $5,114,100 $365,293 $387,450 17 14 99% 14 Page 3 July 2010 Market Watch, August 2011 10
- 11. Toronto Real Estate Board CONDOMINIUM TOWNHOUSES,Industrial Leasing AUGUST 2011 SUMMARY OF EXISTING HOME TRANSACTIONS ALL TREB AREAS Sales1 Dollar Volume1 Average Price1 Median Price1 New Listings2 Active Listings3 Avg. SP/LP 4 Avg. DOM5 TREB Total 597 - $187,365,908 - $313,846 - $302,000 - 884 - 1,145 - 98% - 25 - Halton Region 25 $7,400,362 $296,014 $280,000 43 52 98% 29 Burlington 9 $2,492,362 $276,929 $267,500 10 17 99% 37 Halton Hills 5 $1,226,000 $245,200 $252,000 11 12 99% 24 Milton 1 $240,000 $240,000 $240,000 3 2 100% 17 Oakville 10 - $3,442,000 - $344,200 - $305,000 - 19 - 21 - 98% - 24 - Peel Region 209 $63,854,440 $305,524 $315,000 316 371 98% 20 Brampton 39 $9,167,350 $235,060 $237,000 79 91 98% 21 Caledon - - - - - 1 - - Mississauga 170 - $54,687,090 - $321,689 - $327,500 - 237 - 279 - 99% - 20 - City of Toronto 225 $75,240,880 $334,404 $315,300 330 446 99% 26 ! TURN PAGE FOR CITY OF TORONTO TABLES OR CLICK HERE: - - - - - - - - York Region 76 $28,259,533 $371,836 $351,500 105 132 98% 29 Aurora 10 $5,141,000 $514,100 $490,000 12 15 97% 36 E. Gwillimbury - - - - - - - - Georgina 2 $294,000 $147,000 $147,000 - 2 91% 71 King - - - - - 2 - - Markham 33 $11,966,245 $362,613 $351,000 56 63 98% 23 Newmarket 5 $1,259,900 $251,980 $254,000 8 10 99% 17 Richmond Hill 18 $6,363,888 $353,549 $384,500 17 22 98% 33 Vaughan 7 $3,004,500 $429,214 $422,000 12 16 98% 35 Whitchurch-Stouffville 1- $230,000 - $230,000 - $230,000 - - - 2- 100% - 14 - Durham Region 55 $11,182,693 $203,322 $205,000 85 136 98% 34 Ajax 12 $2,492,350 $207,696 $204,500 18 21 97% 25 Brock 2 $284,900 $142,450 $142,450 4 6 98% 111 Clarington 5 $947,723 $189,545 $204,000 7 12 98% 24 Oshawa 16 $2,551,100 $159,444 $153,000 21 32 96% 40 Pickering 11 $2,828,300 $257,118 $224,000 20 35 99% 32 Scugog 1 $345,000 $345,000 $345,000 - - 99% 4 Uxbridge - - - - 3 8 - - Whitby 8- $1,733,320 - $216,665 - $213,910 - 12 - 22 - 98% - 32 - Dufferin County 2 $382,000 $191,000 $191,000 2 4 98% 21 Orangeville 2 - $382,000 - $191,000 - $191,000 - 2 - 4 - 98% - 21 - Simcoe County 5 $1,046,000 $209,200 $208,000 3 4 98% 48 Adjala-Tosorontio - - - - - - - - Bradford West Gwillimbury 3 $636,000 $212,000 $214,000 3 2 98% 26 Essa - - - - - - - - Innisfil - - - - - - - - New Tecumseth 2 $410,000 $205,000 $205,000 - 2 97% 82 Page 3 July 2010 Market Watch, August 2011 11