13. 1. Price $12.50 - 22.50 53%
2. Age Ideal Age = 7.0 24%
3. Ideal Position Pfmn 4.2 Size 15.8 16%
4. Reliability MTBF 12000-17000 7%
Top Products in Low End Segment
Name
Market
Share
Units
Sold to
Seg
Revision
Date
Stock
Out
Pfmn
Coord
Size
Coord
List
Price MTBF
Age
Dec.31
Promo
Budget
15. 74% $1,350 42% 0
CAPSTONE® COURIER Page 6
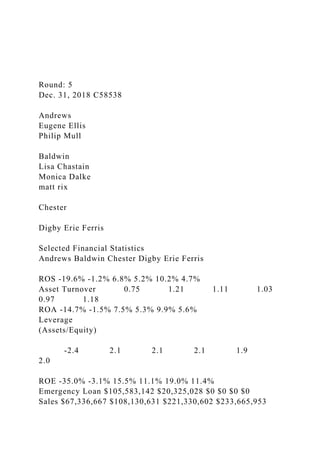
High End Segment Analysis C58538 Round: 5Dec. 31, 2018
High End Statistics
Total Industry Unit Demand 5,410
Actual Industry Unit Sales 5,410
Segment % of Total Industry 13.0%
Next Year's Segment Growth Rate 16.2%
High End Customer Buying Criteria
Expectations Importance
1. Ideal Position Pfmn 13.4 Size 6.6 43%
2. Age Ideal Age = 0.0 29%
3. Reliability MTBF 20000-25000 19%
4. Price $27.50 - 37.50 9%
Top Products in High End Segment
Name
Market
Share
Units
Sold to
Seg
Revision
Date
20. Expectations Importance
1. Ideal Position Pfmn 7.5 Size 5.6 43%
2. Age Ideal Age = 1.5 29%
3. Reliability MTBF 16000-21000 19%
4. Price $22.50 - 32.50 9%
Top Products in Size Segment
Name
Market
Share
Units
Sold to
Seg
Revision
Date
Stock
Out
Pfmn
Coord
Size
Coord
List
Price MTBF
Age
Dec.31
Promo
26. Benefits
Profit Sharing
Annual Raise
Strike Days
TQM SUMMARY
Andrews Baldwin Chester Digby Erie Ferris
Process Mgt Budgets Last Year
CPI Systems $0 $0 $0 $0 $0 $0
Vendor/JIT $0 $0 $0 $0 $0 $0
Quality Initiative Training $0 $0 $0 $0 $0 $0
Channel Support Systems $0 $0 $0 $0 $0 $0
Concurrent Engineering $0 $0 $0 $0 $0 $0
UNEP Green Programs $0 $0 $0 $0 $0 $0
TQM Budgets Last Year
Benchmarking $0 $0 $0 $0 $0 $0
Quality Function Deployment Effort $0 $0 $0 $0 $0 $0
CCE/6 Sigma Training $0 $0 $0 $0 $0 $0
GEMI TQEM Sustainability Initiatives $0 $0 $0 $0 $0 $0
Total Expenditures $0 $0 $0 $0 $0 $0
Cumulative Impacts
Material Cost Reduction 0.00% 0.00% 0.00% 0.00% 0.00%
0.00%
Labor Cost Reduction 0.00% 0.00% 0.00% 0.00% 0.00% 0.00%
Reduction R&D Cycle Time 0.00% 0.00% 0.00% 0.00% 0.00%
0.00%
Reduction Admin Costs 0.00% 0.00% 0.00% 0.00% 0.00%
0.00%
Demand Increase 0.00% 0.00% 0.00% 0.00% 0.00% 0.00%
CAPSTONE® COURIER Page 12
27. Ethics Report C58538 Round: 5Dec. 31, 2018
ETHICS SUMMARY
Other (Fees, Writeoffs, etc.) The actual dollar impact. Example,
$120 means Other increased by $120.
Demand Factor The % of normal. 98% means demand fell 2%.
Material Cost Impact The % of normal. 104% means matieral
costs rose 4%.
Admin Cost Impact The % of normal. 103% means admin costs
rose 3%.
Productivity Impact The % of normal. 104% means productivity
increased by 4%.
Awareness Impact The % of normal. 105% means normal
awareness was multiplied by 1.05.
Accessibility Impact The % of normal. 98% means normal
accessiblity was multiplied by 0.98.
Normal means the value that would have been produced if the
problem had not been presented.
No Impact Andrews Baldwin Chester Digby Erie Ferris
Total
Other (Fees, Writeoffs, etc.) $0 $0 $0 $0 $0 $0 $0
Demand Factor 100% 100% 100% 100% 100% 100% 100%
Material Cost Impact 100% 100% 100% 100% 100% 100%
100%
Admin Cost Impact 100% 100% 100% 100% 100% 100% 100%
Productivity Impact 100% 100% 100% 100% 100% 100% 100%
Awareness Impact 100% 100% 100% 100% 100% 100% 100%
Accessibility Impact 100% 100% 100% 100% 100% 100% 100%
CAPSTONE® COURIER Page 13
28. Annual Report
Annual Report Andrews C58538 Round: 5Dec. 31, 2018
Balance Sheet
DEFINITIONS:
Common Size: The common size
column simply represents each item as a
percentage of total assets for that year.
Cash: Your end-of-year cash position.
Accounts Receivable: Reflects the lag
between delivery and payment of your
products. Inventories: The current
value of your inventory across all products. A
zero indicates your company stocked out.
Unmet demand would, of course, fall to your
competitors. Plant & Equipment: The
current value of your plant. Accum
Deprec: The total accumulated
depreciation from your plant. Accts
Payable: What the company currently
owes suppliers for materials and services.
Current Debt: The debt the company
is obligated to pay during the next year of
operations. It includes emergency loans used
to keep your company solvent should you run
out of cash during the year. Long
Term Debt: The company's
long term debt is in the form of bonds, and this
represents the total value of your bonds.
Common Stock: The amount of
capital invested by shareholders in the
company. Retained Earnings:
The profits that the company chose to keep
instead of paying to shareholders as dividends.
29. ASSETS 2018
Common
Size
2017
Cash $0 0.0% $0
Account Receivable $5,535 6.2% $6,105
Inventory $61,098 68.2% $107,012
Total Current Assets $66,633 74.4% $113,117
Plant & Equipment $68,822 76.8% $108,400
Accumulated Depreciation ($45,881) -51.2% ($65,040)
Total Fixed Assets $22,941 25.6% $43,360
Total Assets $89,573 100.0% $156,477
LIABILITIES & OWNER'S
EQUITY
Accounts Payable $776 0.9% $4,760
Current Debt $105,583 118.0% $155,312
Long Term Debt $20,850 23.3% $20,850
Total Liabilities $127,209 142.0% $180,922
Common Stock $28,360 31.7% $28,360
Retained Earnings ($65,996) -73.7% ($52,805)
Total Equity ($37,636) -42.0% ($24,445)
Total Liab. & O. Equity $89,573 100.0% $156,477
Cash Flow Statement
The Cash Flow Statement examines what happened in the Cash
Account during the year. Cash injections appear as positive
numbers and
cash withdrawals as negative numbers. The Cash Flow
Statement is an
excellent tool for diagnosing emergency loans. When negative
30. cash flows
exceed positives, you are forced to seek emergency funding. For
example,
if sales are bad and you find yourself carrying an abundance of
excess
inventory, the report would show the increase in inventory as a
huge
negative cash flow. Too much unexpected inventory could
outstrip your
inflows, exhaust your starting cash and force you to beg for
money to keep
your company afloat.
Cash Flows from Operating Activities 2018 2017
NetIncome(Loss) ($13,191) ($28,964)
Depreciation $4,588 $7,227
Extraordinary gains/losses/writeoffs ($9,895) $0
Accounts Payable ($3,984) ($171)
Inventory $45,914 $3,669
Accounts Receivable $571 ($355)
Net cash from operation $24,003 ($18,594)
Cash Flows from Investing Activities
Plant Improvements $25,726 $0
Cash Flows from Financing Activities
Dividends Paid $0 $0
Sales of Common Stock $0 $0
Purchase of Common Stock $0 $0
Cash from long term debt $0 $0
Retirement of long term debt $0 ($10,925)
Change in current debt(net) ($49,728) $29,518
Net Cash from financing activities ($49,728) $18,594
Net Change in cash position $0 $0
Closing cash position $0 $0
32. Admin $912 $1,067 $326 $112 $308 $0 $0 $0 $2,725 4.0%
Total Period $1,826 $4,423 $2,203 $1,104 $1,873 $269 $134
$249 $12,080 17.9%
Net Margin ($3,744) ($467) ($775) ($696) ($1,101) ($269)
($134) ($249) ($7,434) -11.0%
Definitions: Sales: Unit Sales times list price. Direct Labor:
Labor costs incurred to produce the
product that was sold. Inventory Carry Cost: the cost unsold
goods in inventory. Depreciation:
Calculated on straight-line. 15-year depreciation of plant value.
R&D Costs: R&D department
expenditures for each product. Admin: Administration overhead
is estimated at 1.5% of sales.
Promotions: The promotion budget for each product. Sales: The
sales force budget for each
product. Other: Chargs not included in other categories such as
Fees, Write offs, and TQM. The fees
include money paid to investment bankers and brokerage firms
to issue new stocks or bonds plus consulting
fees your instructor might assess. Write-offs include the loss
you might experience when you sell capacity or
liquidate inventory as the result of eliminating a production
line. If the amount appears as a negative amount,
then you actually made money on the liquidation of capacity or
inventory. EBIT: Earnings Before Interest
and Taxes. Short Term Interest: Interest expense based on last
year''s current debt, including short term
debt, long term notes that have become due, and emergency
loans, Long Term Interest: Interest paid on
outstanding bonds. Taxes: Income tax based upon a 35% tax
rate. Profit Sharing: Profits shared
with employees under the labor contract. Net Profit: EBIT
minus interest, taxes, and profit sharing.
33. Other ($9,895) -14.7%
EBIT $2,461 3.7%
Short Term Interest $19,836 29.5%
Long Term Interest $2,919 4.3%
Taxes ($7,103) -10.5%
Profit Sharing $0 0.0%
Net Profit ($13,191) -19.6%
Annual Report Page 15
C58538Front PageStock & BondsFinancial SummaryProduction
AnalysisTraditional Segment AnalysisLow End Segment
AnalysisHigh End Segment AnalysisPerformance Segment
AnalysisSize Segment AnalysisMarket SharePerceptual
MapHR/TQM ReportEthics ReportAnnual
ReportAndrewsBalance SheetIncome Statement
Round: 4
Dec. 31, 2017 C58538
Andrews
Eugene Ellis
Philip Mull
Baldwin
Lisa Chastain
Monica Dalke
matt rix
Chester
Digby Erie Ferris
Selected Financial Statistics
Andrews Baldwin Chester Digby Erie Ferris
39. Production Analysis C58538 Round: 4Dec. 31, 2017
Name
Primary
Segment
Units
Sold
Unit
Inven
tory Revision Date
Age
Dec.31 MTBF
Pfmn
Coord
Size
Coord Price
Material
Cost
Labor
Cost
Contr.
Marg.
2nd
Shift
&
45. Next Year's Segment Growth Rate 11.7%
Low End Customer Buying Criteria
Expectations Importance
1. Price $13.00 - 23.00 53%
2. Age Ideal Age = 7.0 24%
3. Ideal Position Pfmn 3.7 Size 16.3 16%
4. Reliability MTBF 12000-17000 7%
Top Products in Low End Segment
Name
Market
Share
Units
Sold to
Seg
Revision
Date
Stock
Out
Pfmn
Coord
Size
Coord
List
Price MTBF
47. Fast 4% 499 1/29/2017 5.5 14.5 $21.00 12000 4.08 $900
57% $710 53% 6
Able 1% 97 10/4/2016 6.4 13.5 $23.50 17000 3.05 $500
31% $500 17% 1
Baker 0% 30 12/23/2016 6.5 12.8 $25.00 17500 2.56
$1,000 63% $1,000 34% 0
CAPSTONE® COURIER Page 6
High End Segment Analysis C58538 Round: 4Dec. 31, 2017
High End Statistics
Total Industry Unit Demand 4,656
Actual Industry Unit Sales 4,656
Segment % of Total Industry 12.6%
Next Year's Segment Growth Rate 16.2%
High End Customer Buying Criteria
Expectations Importance
1. Ideal Position Pfmn 12.5 Size 7.5 43%
2. Age Ideal Age = 0.0 29%
3. Reliability MTBF 20000-25000 19%
4. Price $28.00 - 38.00 9%
Top Products in High End Segment
Name
Market
Share
Units
Sold to
50. 3. Price $23.00 - 33.00 19%
4. Age Ideal Age = 1.0 9%
Top Products in Performance Segment
Name
Market
Share
Units
Sold to
Seg
Revision
Date
Stock
Out
Pfmn
Coord
Size
Coord
List
Price MTBF
Age
Dec.31
Promo
Budget
Cust.
Aware-
52. Segment % of Total Industry 10.5%
Next Year's Segment Growth Rate 18.3%
Size Customer Buying Criteria
Expectations Importance
1. Ideal Position Pfmn 6.8 Size 6.6 43%
2. Age Ideal Age = 1.5 29%
3. Reliability MTBF 16000-21000 19%
4. Price $23.00 - 33.00 9%
Top Products in Size Segment
Name
Market
Share
Units
Sold to
Seg
Revision
Date
Stock
Out
Pfmn
Coord
Size
Coord
List
Price MTBF
58. Annual Raise
Adjusted Labor Demands
Wages
Benefits
Profit Sharing
Annual Raise
Strike Days
TQM SUMMARY
Andrews Baldwin Chester Digby Erie Ferris
Process Mgt Budgets Last Year
CPI Systems $0 $0 $0 $0 $0 $0
Vendor/JIT $0 $0 $0 $0 $0 $0
Quality Initiative Training $0 $0 $0 $0 $0 $0
Channel Support Systems $0 $0 $0 $0 $0 $0
Concurrent Engineering $0 $0 $0 $0 $0 $0
UNEP Green Programs $0 $0 $0 $0 $0 $0
TQM Budgets Last Year
Benchmarking $0 $0 $0 $0 $0 $0
Quality Function Deployment Effort $0 $0 $0 $0 $0 $0
CCE/6 Sigma Training $0 $0 $0 $0 $0 $0
GEMI TQEM Sustainability Initiatives $0 $0 $0 $0 $0 $0
Total Expenditures $0 $0 $0 $0 $0 $0
Cumulative Impacts
Material Cost Reduction 0.00% 0.00% 0.00% 0.00% 0.00%
0.00%
Labor Cost Reduction 0.00% 0.00% 0.00% 0.00% 0.00% 0.00%
Reduction R&D Cycle Time 0.00% 0.00% 0.00% 0.00% 0.00%
0.00%
Reduction Admin Costs 0.00% 0.00% 0.00% 0.00% 0.00%
0.00%
59. Demand Increase 0.00% 0.00% 0.00% 0.00% 0.00% 0.00%
CAPSTONE® COURIER Page 12
Ethics Report C58538 Round: 4Dec. 31, 2017
ETHICS SUMMARY
Other (Fees, Writeoffs, etc.) The actual dollar impact. Example,
$120 means Other increased by $120.
Demand Factor The % of normal. 98% means demand fell 2%.
Material Cost Impact The % of normal. 104% means matieral
costs rose 4%.
Admin Cost Impact The % of normal. 103% means admin costs
rose 3%.
Productivity Impact The % of normal. 104% means productivity
increased by 4%.
Awareness Impact The % of normal. 105% means normal
awareness was multiplied by 1.05.
Accessibility Impact The % of normal. 98% means normal
accessiblity was multiplied by 0.98.
Normal means the value that would have been produced if the
problem had not been presented.
No Impact Andrews Baldwin Chester Digby Erie Ferris
Total
Other (Fees, Writeoffs, etc.) $0 $0 $0 $0 $0 $0 $0
Demand Factor 100% 100% 100% 100% 100% 100% 100%
Material Cost Impact 100% 100% 100% 100% 100% 100%
100%
Admin Cost Impact 100% 100% 100% 100% 100% 100% 100%
Productivity Impact 100% 100% 100% 100% 100% 100% 100%
Awareness Impact 100% 100% 100% 100% 100% 100% 100%
Accessibility Impact 100% 100% 100% 100% 100% 100% 100%
60. CAPSTONE® COURIER Page 13
Annual Report
Annual Report Andrews C58538 Round: 4Dec. 31, 2017
Balance Sheet
DEFINITIONS:
Common Size: The common size
column simply represents each item as a
percentage of total assets for that year.
Cash: Your end-of-year cash position.
Accounts Receivable: Reflects the lag
between delivery and payment of your
products. Inventories: The current
value of your inventory across all products. A
zero indicates your company stocked out.
Unmet demand would, of course, fall to your
competitors. Plant & Equipment: The
current value of your plant. Accum
Deprec: The total accumulated
depreciation from your plant. Accts
Payable: What the company currently
owes suppliers for materials and services.
Current Debt: The debt the company
is obligated to pay during the next year of
operations. It includes emergency loans used
to keep your company solvent should you run
out of cash during the year. Long
Term Debt: The company's
long term debt is in the form of bonds, and this
represents the total value of your bonds.
Common Stock: The amount of
capital invested by shareholders in the
61. company. Retained Earnings:
The profits that the company chose to keep
instead of paying to shareholders as dividends.
ASSETS 2017
Common
Size
2016
Cash $0 0.0% $0
Account Receivable $6,105 3.9% $5,750
Inventory $107,012 68.4% $110,681
Total Current Assets $113,117 72.3% $116,431
Plant & Equipment $108,400 69.3% $108,400
Accumulated Depreciation ($65,040) -41.6% ($57,813)
Total Fixed Assets $43,360 27.7% $50,587
Total Assets $156,477 100.0% $167,018
LIABILITIES & OWNER'S
EQUITY
Accounts Payable $4,760 3.0% $4,931
Current Debt $155,312 99.3% $125,793
Long Term Debt $20,850 13.3% $31,775
Total Liabilities $180,922 116.0% $162,499
Common Stock $28,360 18.1% $28,360
Retained Earnings ($52,805) -33.7% ($23,841)
Total Equity ($24,445) -15.6% $4,519
Total Liab. & O. Equity $156,477 100.0% $167,018
Cash Flow Statement
The Cash Flow Statement examines what happened in the Cash
Account during the year. Cash injections appear as positive
62. numbers and
cash withdrawals as negative numbers. The Cash Flow
Statement is an
excellent tool for diagnosing emergency loans. When negative
cash flows
exceed positives, you are forced to seek emergency funding. For
example,
if sales are bad and you find yourself carrying an abundance of
excess
inventory, the report would show the increase in inventory as a
huge
negative cash flow. Too much unexpected inventory could
outstrip your
inflows, exhaust your starting cash and force you to beg for
money to keep
your company afloat.
Cash Flows from Operating Activities 2017 2016
NetIncome(Loss) ($28,964) ($32,474)
Depreciation $7,227 $7,227
Extraordinary gains/losses/writeoffs $0 $0
Accounts Payable ($171) ($6,042)
Inventory $3,669 ($1,387)
Accounts Receivable ($355) ($2,261)
Net cash from operation ($18,594) ($34,937)
Cash Flows from Investing Activities
Plant Improvements $0 $0
Cash Flows from Financing Activities
Dividends Paid $0 $0
Sales of Common Stock $0 $0
Purchase of Common Stock $0 $0
Cash from long term debt $0 $0
Retirement of long term debt ($10,925) $0
Change in current debt(net) $29,518 $34,937
63. Net Cash from financing activities $18,594 $34,937
Net Change in cash position $0 $0
Closing cash position $0 $0
Annual Report Page 14
Annual Report Andrews C58538 Round: 4Dec. 31, 2017
2017 Income Statement
(Product Name) Able Acre Adam Aft Agape Abum Ajoy Apps
2017
Total
Common
Size
Sales $25,501 $23,581 $6,782 $10,362 $8,054 $0 $0 $0 $74,279
100.0%
Variable Costs:
Direct Labor $9,677 $10,444 $2,023 $3,815 $2,827 $0 $0 $0
$28,786 38.8%
Direct Material $11,609 $9,662 $3,026 $5,003 $3,502 $0 $0 $0
$32,802 44.2%
Inventory Carry $7,902 $2,521 $1,227 $0 $1,192 $0 $0 $0
$12,841 17.3%
Total Variable $29,188 $22,627 $6,276 $8,817 $7,520 $0 $0 $0
$74,429 100.2%
Contribution Margin ($3,688) $954 $506 $1,545 $533 $0 $0 $0
($150) -0.2%
Period Costs:
Depreciation $2,640 $2,427 $1,080 $360 $720 $0 $0 $0 $7,227
64. 9.7%
SG&A: R&D $0 $0 $0 $0 $0 $0 $0 $0 $0 0.0%
Promotions $500 $500 $600 $600 $600 $0 $0 $0 $2,800 3.8%
Sales $500 $500 $660 $600 $600 $0 $0 $0 $2,860 3.9%
Admin $197 $182 $52 $80 $62 $0 $0 $0 $573 0.8%
Total Period $3,837 $3,609 $2,392 $1,640 $1,982 $0 $0 $0
$13,460 18.1%
Net Margin ($7,524) ($2,655) ($1,886) ($95) ($1,449) $0 $0 $0
($13,610) -18.3%
Definitions: Sales: Unit Sales times list price. Direct Labor:
Labor costs incurred to produce the
product that was sold. Inventory Carry Cost: the cost unsold
goods in inventory. Depreciation:
Calculated on straight-line. 15-year depreciation of plant value.
R&D Costs: R&D department
expenditures for each product. Admin: Administration overhead
is estimated at 1.5% of sales.
Promotions: The promotion budget for each product. Sales: The
sales force budget for each
product. Other: Chargs not included in other categories such as
Fees, Write offs, and TQM. The fees
include money paid to investment bankers and brokerage firms
to issue new stocks or bonds plus consulting
fees your instructor might assess. Write-offs include the loss
you might experience when you sell capacity or
liquidate inventory as the result of eliminating a production
line. If the amount appears as a negative amount,
then you actually made money on the liquidation of capacity or
inventory. EBIT: Earnings Before Interest
and Taxes. Short Term Interest: Interest expense based on last
year''s current debt, including short term
debt, long term notes that have become due, and emergency
loans, Long Term Interest: Interest paid on
outstanding bonds. Taxes: Income tax based upon a 35% tax
65. rate. Profit Sharing: Profits shared
with employees under the labor contract. Net Profit: EBIT
minus interest, taxes, and profit sharing.
Other $0 0.0%
EBIT ($13,610) -18.3%
Short Term Interest $28,032 37.7%
Long Term Interest $2,919 3.9%
Taxes ($15,596) -21.0%
Profit Sharing $0 0.0%
Net Profit ($28,964) -39.0%
Annual Report Page 15
C58538Front PageStock & BondsFinancial SummaryProduction
AnalysisTraditional Segment AnalysisLow End Segment
AnalysisHigh End Segment AnalysisPerformance Segment
AnalysisSize Segment AnalysisMarket SharePerceptual
MapHR/TQM ReportEthics ReportAnnual
ReportAndrewsBalance SheetIncome Statement
Round: 3
Dec. 31, 2016 C58538
Andrews
Eugene Ellis
Philip Mull
Baldwin
Lisa Chastain
Monica Dalke
matt rix
Chester
71. CAPSTONE® COURIER Page 3
Production Analysis C58538 Round: 3Dec. 31, 2016
Name
Primary
Segment
Units
Sold
Unit
Inven
tory Revision Date
Age
Dec.31 MTBF
Pfmn
Coord
Size
Coord Price
Material
Cost
Labor
Cost
Contr.
Marg.
74. $8.85 28% 72% 6.0 1,050 171%
Egg Trad 1,280 0 5/18/2016 2.0 16000 7.1 12.9 $26.50 $10.02
$12.18 15% 100% 4.0 600 198%
Fast Trad 1,243 167 4/22/2015 3.1 14000 5.5 14.5 $21.50 $8.00
$10.66 10% 100% 4.0 600 198%
Feat Low 1,386 0 7/27/2018 7.6 13000 3.0 17.0 $21.50 $5.49
$7.61 38% 100% 6.0 1,150 198%
Fist High 927 130 12/13/2016 1.1 25000 11.3 8.6 $38.50 $16.48
$11.40 28% 50% 3.0 850 149%
Foam Pfmn 788 135 9/18/2016 1.4 27000 12.8 13.5 $33.40
$16.08 $9.97 21% 50% 4.5 800 149%
Fume Size 870 155 12/11/2016 1.3 16000 6.1 7.2 $33.50 $12.68
$10.12 30% 58% 4.0 850 157%
Fox High 983 8 12/11/2016 0.5 25000 12.0 8.0 $38.50 $17.05
$8.37 35% 100% 5.5 500 198%
CAPSTONE® COURIER Page 4
Traditional Segment Analysis C58538 Round: 3Dec. 31, 2016
Traditional Statistics
Total Industry Unit Demand 9,619
Actual Industry Unit Sales 9,619
Segment % of Total Industry 29.4%
Next Year's Segment Growth Rate 9.2%
Traditional Customer Buying Criteria
Expectations Importance
1. Age Ideal Age = 2.0 47%
2. Price $18.50 - 28.50 23%
3. Ideal Position Pfmn 7.1 Size 12.9 21%
75. 4. Reliability MTBF 14000-19000 9%
Top Products in Traditional Segment
Name
Market
Share
Units
Sold to
Seg
Revision
Date
Stock
Out
Pfmn
Coord
Size
Coord
List
Price MTBF
Age
Dec.31
Promo
Budget
Cust.
Aware-
ness
77. CAPSTONE® COURIER Page 5
Low End Segment Analysis C58538 Round: 3Dec. 31, 2016
Low End Statistics
Total Industry Unit Demand 12,488
Actual Industry Unit Sales 12,488
Segment % of Total Industry 38.2%
Next Year's Segment Growth Rate 11.7%
Low End Customer Buying Criteria
Expectations Importance
1. Price $13.50 - 23.50 53%
2. Age Ideal Age = 7.0 24%
3. Ideal Position Pfmn 3.2 Size 16.8 16%
4. Reliability MTBF 12000-17000 7%
Top Products in Low End Segment
Name
Market
Share
Units
Sold to
Seg
Revision
Date
Stock
Out
80. 1. Ideal Position Pfmn 11.6 Size 8.4 43%
2. Age Ideal Age = 0.0 29%
3. Reliability MTBF 20000-25000 19%
4. Price $28.50 - 38.50 9%
Top Products in High End Segment
Name
Market
Share
Units
Sold to
Seg
Revision
Date
Stock
Out
Pfmn
Coord
Size
Coord
List
Price MTBF
Age
Dec.31
Promo
Budget
82. Performance Segment Analysis C58538 Round: 3Dec. 31, 2016
Performance Statistics
Total Industry Unit Demand 3,293
Actual Industry Unit Sales 3,293
Segment % of Total Industry 10.1%
Next Year's Segment Growth Rate 19.8%
Performance Customer Buying Criteria
Expectations Importance
1. Reliability MTBF 22000-27000 43%
2. Ideal Position Pfmn 12.4 Size 13.9 29%
3. Price $23.50 - 33.50 19%
4. Age Ideal Age = 1.0 9%
Top Products in Performance Segment
Name
Market
Share
Units
Sold to
Seg
Revision
Date
Stock
Out
Pfmn
90. Total HR Admin Cost $2,953 $176 $426 $213 $346 $264
Labor Contract Next Year
Wages $24.31 $24.31 $24.31 $24.31 $24.31 $24.31
Benefits 2,500 2,500 2,500 2,500 2,500 2,500
Profit Sharing 2.0% 2.0% 2.0% 2.0% 2.0% 2.0%
Annual Raise 5.0% 5.0% 5.0% 5.0% 5.0% 5.0%
Starting Negotiation Position
Wages
Benefits
Profit Sharing
Annual Raise
Ceiling Negotiation Position
Wages
Benefits
Profit Sharing
Annual Raise
Adjusted Labor Demands
Wages
Benefits
Profit Sharing
Annual Raise
Strike Days
TQM SUMMARY
Andrews Baldwin Chester Digby Erie Ferris
Process Mgt Budgets Last Year
CPI Systems $0 $0 $0 $0 $0 $0
Vendor/JIT $0 $0 $0 $0 $0 $0
Quality Initiative Training $0 $0 $0 $0 $0 $0
Channel Support Systems $0 $0 $0 $0 $0 $0
91. Concurrent Engineering $0 $0 $0 $0 $0 $0
UNEP Green Programs $0 $0 $0 $0 $0 $0
TQM Budgets Last Year
Benchmarking $0 $0 $0 $0 $0 $0
Quality Function Deployment Effort $0 $0 $0 $0 $0 $0
CCE/6 Sigma Training $0 $0 $0 $0 $0 $0
GEMI TQEM Sustainability Initiatives $0 $0 $0 $0 $0 $0
Total Expenditures $0 $0 $0 $0 $0 $0
Cumulative Impacts
Material Cost Reduction 0.00% 0.00% 0.00% 0.00% 0.00%
0.00%
Labor Cost Reduction 0.00% 0.00% 0.00% 0.00% 0.00% 0.00%
Reduction R&D Cycle Time 0.00% 0.00% 0.00% 0.00% 0.00%
0.00%
Reduction Admin Costs 0.00% 0.00% 0.00% 0.00% 0.00%
0.00%
Demand Increase 0.00% 0.00% 0.00% 0.00% 0.00% 0.00%
CAPSTONE® COURIER Page 12
Ethics Report C58538 Round: 3Dec. 31, 2016
ETHICS SUMMARY
Other (Fees, Writeoffs, etc.) The actual dollar impact. Example,
$120 means Other increased by $120.
Demand Factor The % of normal. 98% means demand fell 2%.
Material Cost Impact The % of normal. 104% means matieral
costs rose 4%.
Admin Cost Impact The % of normal. 103% means admin costs
rose 3%.
Productivity Impact The % of normal. 104% means productivity
increased by 4%.
92. Awareness Impact The % of normal. 105% means normal
awareness was multiplied by 1.05.
Accessibility Impact The % of normal. 98% means normal
accessiblity was multiplied by 0.98.
Normal means the value that would have been produced if the
problem had not been presented.
No Impact Andrews Baldwin Chester Digby Erie Ferris
Total
Other (Fees, Writeoffs, etc.) $0 $0 $0 $0 $0 $0 $0
Demand Factor 100% 100% 100% 100% 100% 100% 100%
Material Cost Impact 100% 100% 100% 100% 100% 100%
100%
Admin Cost Impact 100% 100% 100% 100% 100% 100% 100%
Productivity Impact 100% 100% 100% 100% 100% 100% 100%
Awareness Impact 100% 100% 100% 100% 100% 100% 100%
Accessibility Impact 100% 100% 100% 100% 100% 100% 100%
CAPSTONE® COURIER Page 13
Annual Report
Annual Report Andrews C58538 Round: 3Dec. 31, 2016
Balance Sheet
DEFINITIONS:
Common Size: The common size
column simply represents each item as a
percentage of total assets for that year.
Cash: Your end-of-year cash position.
Accounts Receivable: Reflects the lag
between delivery and payment of your
products. Inventories: The current
value of your inventory across all products. A
93. zero indicates your company stocked out.
Unmet demand would, of course, fall to your
competitors. Plant & Equipment: The
current value of your plant. Accum
Deprec: The total accumulated
depreciation from your plant. Accts
Payable: What the company currently
owes suppliers for materials and services.
Current Debt: The debt the company
is obligated to pay during the next year of
operations. It includes emergency loans used
to keep your company solvent should you run
out of cash during the year. Long
Term Debt: The company's
long term debt is in the form of bonds, and this
represents the total value of your bonds.
Common Stock: The amount of
capital invested by shareholders in the
company. Retained Earnings:
The profits that the company chose to keep
instead of paying to shareholders as dividends.
ASSETS 2016
Common
Size
2015
Cash $0 0.0% $0
Account Receivable $5,750 3.4% $3,489
Inventory $110,681 66.3% $109,294
Total Current Assets $116,431 69.7% $112,783
Plant & Equipment $108,400 64.9% $108,400
Accumulated Depreciation ($57,813) -34.6% ($50,587)
94. Total Fixed Assets $50,587 30.3% $57,813
Total Assets $167,018 100.0% $170,597
LIABILITIES & OWNER'S
EQUITY
Accounts Payable $4,931 3.0% $10,973
Current Debt $125,793 75.3% $90,856
Long Term Debt $31,775 19.0% $31,775
Total Liabilities $162,499 97.3% $133,604
Common Stock $28,360 17.0% $28,360
Retained Earnings ($23,841) -14.3% $8,633
Total Equity $4,519 2.7% $36,993
Total Liab. & O. Equity $167,018 100.0% $170,597
Cash Flow Statement
The Cash Flow Statement examines what happened in the Cash
Account during the year. Cash injections appear as positive
numbers and
cash withdrawals as negative numbers. The Cash Flow
Statement is an
excellent tool for diagnosing emergency loans. When negative
cash flows
exceed positives, you are forced to seek emergency funding. For
example,
if sales are bad and you find yourself carrying an abundance of
excess
inventory, the report would show the increase in inventory as a
huge
negative cash flow. Too much unexpected inventory could
outstrip your
inflows, exhaust your starting cash and force you to beg for
money to keep
your company afloat.
Cash Flows from Operating Activities 2016 2015
95. NetIncome(Loss) ($32,474) ($14,820)
Depreciation $7,227 $7,227
Extraordinary gains/losses/writeoffs $0 $0
Accounts Payable ($6,042) $3,651
Inventory ($1,387) ($75,921)
Accounts Receivable ($2,261) $135
Net cash from operation ($34,937) ($79,728)
Cash Flows from Investing Activities
Plant Improvements $0 $0
Cash Flows from Financing Activities
Dividends Paid $0 $0
Sales of Common Stock $0 $0
Purchase of Common Stock $0 $0
Cash from long term debt $0 $0
Retirement of long term debt $0 $0
Change in current debt(net) $34,937 $79,728
Net Cash from financing activities $34,937 $79,728
Net Change in cash position $0 $0
Closing cash position $0 $0
Annual Report Page 14
Annual Report Andrews C58538 Round: 3Dec. 31, 2016
2016 Income Statement
(Product Name) Able Acre Adam Aft Agape Abum Ajoy Apps
2016
Total
Common
Size
96. Sales $19,157 $20,181 $9,356 $10,609 $10,659 $0 $0 $0
$69,962 100.0%
Variable Costs:
Direct Labor $7,248 $8,912 $2,704 $3,727 $3,711 $0 $0 $0
$26,302 37.6%
Direct Material $9,032 $9,053 $4,296 $5,156 $4,769 $0 $0 $0
$32,306 46.2%
Inventory Carry $8,391 $2,575 $1,108 $0 $1,208 $0 $0 $0
$13,282 19.0%
Total Variable $24,671 $20,539 $8,109 $8,883 $9,688 $0 $0 $0
$71,890 102.8%
Contribution Margin ($5,514) ($358) $1,247 $1,726 $971 $0 $0
$0 ($1,928) -2.8%
Period Costs:
Depreciation $2,640 $2,427 $1,080 $360 $720 $0 $0 $0 $7,227
10.3%
SG&A: R&D $771 $859 $904 $801 $586 $297 $337 $304
$4,858 6.9%
Promotions $500 $500 $600 $600 $600 $0 $0 $0 $2,800 4.0%
Sales $500 $500 $660 $600 $600 $0 $0 $0 $2,860 4.1%
Admin $943 $993 $460 $522 $525 $0 $0 $0 $3,443 4.9%
Total Period $5,353 $5,279 $3,704 $2,883 $3,031 $297 $337
$304 $21,188 30.3%
Net Margin ($10,868) ($5,636) ($2,457) ($1,157) ($2,060)
($297) ($337) ($304) ($23,116) -33.0%
Definitions: Sales: Unit Sales times list price. Direct Labor:
Labor costs incurred to produce the
product that was sold. Inventory Carry Cost: the cost unsold
goods in inventory. Depreciation:
Calculated on straight-line. 15-year depreciation of plant value.
R&D Costs: R&D department
97. expenditures for each product. Admin: Administration overhead
is estimated at 1.5% of sales.
Promotions: The promotion budget for each product. Sales: The
sales force budget for each
product. Other: Chargs not included in other categories such as
Fees, Write offs, and TQM. The fees
include money paid to investment bankers and brokerage firms
to issue new stocks or bonds plus consulting
fees your instructor might assess. Write-offs include the loss
you might experience when you sell capacity or
liquidate inventory as the result of eliminating a production
line. If the amount appears as a negative amount,
then you actually made money on the liquidation of capacity or
inventory. EBIT: Earnings Before Interest
and Taxes. Short Term Interest: Interest expense based on last
year''s current debt, including short term
debt, long term notes that have become due, and emergency
loans, Long Term Interest: Interest paid on
outstanding bonds. Taxes: Income tax based upon a 35% tax
rate. Profit Sharing: Profits shared
with employees under the labor contract. Net Profit: EBIT
minus interest, taxes, and profit sharing.
Other $0 0.0%
EBIT ($23,116) -33.0%
Short Term Interest $22,559 32.2%
Long Term Interest $4,285 6.1%
Taxes ($17,486) -25.0%
Profit Sharing $0 0.0%
Net Profit ($32,474) -46.4%
Annual Report Page 15
C58538Front PageStock & BondsFinancial SummaryProduction
AnalysisTraditional Segment AnalysisLow End Segment
AnalysisHigh End Segment AnalysisPerformance Segment
AnalysisSize Segment AnalysisMarket SharePerceptual
107. Traditional Statistics
Total Industry Unit Demand 8,809
Actual Industry Unit Sales 8,809
Segment % of Total Industry 30.4%
Next Year's Segment Growth Rate 9.2%
Traditional Customer Buying Criteria
Expectations Importance
1. Age Ideal Age = 2.0 47%
2. Price $19.00 - 29.00 23%
3. Ideal Position Pfmn 6.4 Size 13.6 21%
4. Reliability MTBF 14000-19000 9%
Top Products in Traditional Segment
Name
Market
Share
Units
Sold to
Seg
Revision
Date
Stock
Out
Pfmn
Coord
Size
109. $1,050 57% $775 54% 29
Fast 13% 1,146 4/22/2015 5.5 14.5 $29.00 14000 2.08 $900
59% $1,235 48% 24
Able 6% 536 5/3/2015 6.0 12.5 $29.50 19000 2.88 $500
46% $500 35% 12
Acre 2% 198 4/3/2015 4.5 16.0 $24.50 16000 3.67 $500
42% $500 35% 3
Buddy 1% 115 5/9/2015 YES 4.7 10.8 $31.00 19000 1.93
$800 44% $800 43% 6
Bold 0% 8 9/15/2015 10.5 15.1 $31.50 24000 2.39 $800
44% $800 43% 0
Dell 0% 1 5/25/2009 YES 3.0 17.0 $21.50 14000 6.60
$1,100 64% $1,512 53% 0
Ebb 0% 1 1/15/2015 YES 3.0 17.0 $19.50 12000 6.60
$1,050 62% $1,085 54% 0
CAPSTONE® COURIER Page 5
Low End Segment Analysis C58538 Round: 2Dec. 31, 2015
Low End Statistics
Total Industry Unit Demand 11,180
Actual Industry Unit Sales 11,180
Segment % of Total Industry 38.6%
Next Year's Segment Growth Rate 11.7%
Low End Customer Buying Criteria
Expectations Importance
1. Price $14.00 - 24.00 53%
2. Age Ideal Age = 7.0 24%
3. Ideal Position Pfmn 2.7 Size 17.3 16%
4. Reliability MTBF 12000-17000 7%
110. Top Products in Low End Segment
Name
Market
Share
Units
Sold to
Seg
Revision
Date
Stock
Out
Pfmn
Coord
Size
Coord
List
Price MTBF
Age
Dec.31
Promo
Budget
Cust.
Aware-
ness
112. High End Statistics
Total Industry Unit Demand 3,448
Actual Industry Unit Sales 3,448
Segment % of Total Industry 11.9%
Next Year's Segment Growth Rate 16.2%
High End Customer Buying Criteria
Expectations Importance
1. Ideal Position Pfmn 10.7 Size 9.3 43%
2. Age Ideal Age = 0.0 29%
3. Reliability MTBF 20000-25000 19%
4. Price $29.00 - 39.00 9%
Top Products in High End Segment
Name
Market
Share
Units
Sold to
Seg
Revision
Date
Stock
Out
Pfmn
Coord
Size
115. Top Products in Performance Segment
Name
Market
Share
Units
Sold to
Seg
Revision
Date
Stock
Out
Pfmn
Coord
Size
Coord
List
Price MTBF
Age
Dec.31
Promo
Budget
Cust.
Aware-
ness
117. Segment % of Total Industry 9.6%
Next Year's Segment Growth Rate 18.3%
Size Customer Buying Criteria
Expectations Importance
1. Ideal Position Pfmn 5.4 Size 8.6 43%
2. Age Ideal Age = 1.5 29%
3. Reliability MTBF 16000-21000 19%
4. Price $24.00 - 34.00 9%
Top Products in Size Segment
Name
Market
Share
Units
Sold to
Seg
Revision
Date
Stock
Out
Pfmn
Coord
Size
Coord
List
Price MTBF