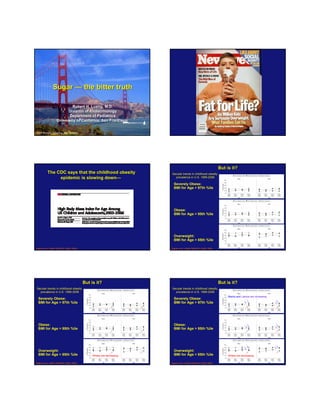
1. Sugar — the bitter truth
Robert H. Lustig, M.D.
Division of Endocrinology
Department of Pediatrics
University of California, San Francisco
UCSF Pediatric Advances, May 29, 2009
But is it?
The CDC says that the childhood obesity Secular trends in childhood obesity
epidemic is slowing down—
down— prevalence in U.S. 1999-2006
Severely Obese:
BMI for Age > 97th %ile
Obese:
BMI for Age > 95th %ile
Overweight:
BMI for Age > 85th %ile
Ogden et al. JAMA 299:2401-2405, 2008 Ogden et al. JAMA 299:2401-2405, 2008
But is it? But is it?
Secular trends in childhood obesity Secular trends in childhood obesity
prevalence in U.S. 1999-2006 prevalence in U.S. 1999-2006
Blacks and Latinos are increasing
Severely Obese: Severely Obese:
BMI for Age > 97th %ile BMI for Age > 97th %ile
Obese: Obese:
BMI for Age > 95th %ile BMI for Age > 95th %ile
Overweight: Overweight:
BMI for Age > 85th %ile Whites are decreasing BMI for Age > 85th %ile Whites are decreasing
Ogden et al. JAMA 299:2401-2405, 2008 Ogden et al. JAMA 299:2401-2405, 2008
2. So is the epidemic of childhood obesity really slowing down? So is the epidemic of childhood obesity really slowing down?
• The prevalence of obesity amongst Whites is decreasing, but • Despite the economic downturn of 2008,
amongst Blacks and Latinos (and Asians) is increasing McDonald’s revenues and stock price continues to rise;
and Coke and Pepsi still fared better than the S&P 500
• Minorities compose an increasing percentage of American children
annually McD
• This JAMA paper analyzed mean data from all ages 2-19; Coke
but in the 2-5 year old age range, things are just getting worse
Pepsi
S&P 500
The First Law of Thermodynamics Total Caloric Intake
Cheap food?
↑ 275 kcal in teen boys
Weight Gain
Calories
Calories In
Out
Children 2-17 yrs, CSFII (USDA) 1989-91 vs. 1994-95
http://www.usda.gov/cnpp/FENR%20V11N3/fenrv11n3p44.PDF
Prevalence of Obesity Compared to Percent
Fat Intake: Grams Calories from Fat Among US Adults
↑ 5 g (45 cal) in teen boys
Percent
Children 2-17 yrs, CSFII (USDA) 1989-91 vs. 1994-95 Year
3. Beverage Intake
Carbohydrate Intake: Grams
↑41% soft drinks
↑ 57 g (228 cal) in teen boys
↑35%
fruit drinks
Children 2-17 yrs, CSFII (USDA) 1989-91 vs. 1994-95
Children 2-17 yrs, CSFII (USDA) 1989-91 vs. 1994-95
Beverage Intake Meta-Analysis of Soft Drinks and Obesity
Meta-
↑41% soft drinks
88 cross-sectional and longitudinal studies regressing
soft drink consumption with —
↑35%
fruit drinks • energy intake r = 0.16 (P < 0.001)
• body weight r = 0.08 (P < 0.001)
• milk and calcium intake r = -0.12 (P < 0.001)
• adequate nutrition r = -0.10 (P < 0.001)
Those studies funded by the beverage industry demonstrated
smaller effects than independent studies
Children 2-17 yrs, CSFII (USDA) 1989-91 vs. 1994-95
One can of soda/day = 150 cal x 365 d/yr 3500 cal/lb = 15.6 lbs/yr!
Vartanian et al. Am J Public Health epub March 2007; 10.2105/AJPH.2005.083782
Curtailing soft drinks limits childhood obesity High Fructose Corn Syrup
Current US annual
consumption of
Obesity Prevalence (%)
HFCS
• 63 pounds per
person
James et al. BMJ 328:1237, 2004
4. High Fructose Corn Syrup is 42-55% Fructose;
42- USA Today, Dec 9, 2008 P. 7D
Sucrose is 50% Fructose
Glucose Fructose
Sucrose
Press Release, February 6, 2008 Secular trend in fructose consumption
Unlikely Duo Opposes San Francisco Soft Drink Tax Plan
Corn Refiners and CSPI Agree High-Fructose Corn Syrup No Worse Than Sugar
Natural consumption of fruits and vegetables
WASHINGTON—The nonprofit Center for Science in the Public Interest has long supported • 15 gm/day
small taxes on soft drinks to help pay for bike paths, nutrition education, and other obesity-
prevention programs. But CSPI opposes a measure proposed by San Francisco Mayor Gavin
Prior to WWII (estimated):
Newsom because it would tax only drinks made with high-fructose corn syrup and not drinks
made with other forms of sugar. Less surprisingly, the Corn Refiners Association also opposes • 16-24 gm/day
the measure, but the two groups cosigned an unusual joint letter to Mayor Newsom urging him
to reconsider his plan. 1977-1978 (USDA Nationwide Food Consumption Survey):
• 37 gm/day (8% of total caloric intake)
“We respectfully urge that the proposal be revised as soon as possible to reflect the scientific
evidence that demonstrates no material differences in the health effects of high-fructose corn
syrup and sugar,” wrote CSPI executive director Michael F. Jacobson and Corn Refiners 1994 (NHANES III):
Association president Audrae Erickson. “The real issue is that excessive consumption of any • 54.7 gm/day (10.2% of total caloric intake)
sugars may lead to health problems.”
The letter goes on to explain that high-fructose corn syrup and sucrose, or table sugar, are
Adolescents:
similar in composition and that several studies have shown that the two types of sugars are • 72.8 gm/day (12.1% of total caloric intake)
similarly metabolized by the body. • 25% consumed at least 15% of calories from fructose
Bray, Am J Clin Nutr 86:895, 2007; Vos et al. Medscape Med J 10:160, 2008
The perfect storm from three political winds The perfect storm from three political winds
1. Richard Nixon and USDA Secretary Earl Butz (1973)
• food should never be an issue in a presidential election
5. The perfect storm from three political winds
1. Richard Nixon and USDA Secretary Earl Butz (1973)
• food should never be an issue in a presidential election
2. The advent of High Fructose Corn Syrup
• invented in 1966 in Japan
• introduced to the American market in 1975
Juice is sucrose:
Change in BMI z-score in lower socioeconomic status
z-
children versus number of fruit juice servings per day
Sucrose
High Fructose Corn Syrup
Faith MS et al. Pediatrics 118:2066, 2006
The perfect storm from three political winds
MOST FRUCTOSE ITEMS
1. Richard Nixon and USDA Secretary Earl Butz (1973)
• food should never be an issue in a presidential election
2. The advent of High Fructose Corn Syrup
• invented in 1966 in Japan
Sucrose
• introduced to the American market in 1975
JUICE
3. The USDA, AMA, and AHA call for dietary fat reduction
High Fructose Corn Syrup • Early 1970’s: discovery of LDL
• Mid 1970’s: Dietary fat raises LDL (A B)
• Late 1970’s: LDL correlated with CVD (B C)
• 1982: If A B, and B C, then A C,
therefore no A, no C
6. Seven Countries
The macronutrient wars 1970-1980
1970-
Correlation of CHD with dietary fat
1972, 1986
Seven Countries
The low-fat craze
low-
Correlation of CHD with dietary fat
The content of low-fat home-cooked food can be controlled
But low-fat processed food means substitution with carbohydrate
Which carbohydrate?
Either
• High fructose corn syrup (55% fructose)
• Sucrose (50% fructose)
e.g. Nabisco Snackwells® Oreos
Page 262: (—2g fat, +13g CHO (+4g sugars))
Diet
Fructose is not glucose
Adulteration of our food supply
Addition of fructose • Fructose is 7 times more likely than glucose
to form Advanced Glycation End-Products (AGE’s)
• palatability (esp. with decreased fat)
• browning agent • Fructose does not suppress ghrelin
Removal of fiber • Acute fructose does not stimulate insulin (or leptin)
• shelf life
• Hepatic fructose metabolism is different
• freezing
• Chronic fructose exposure promotes the
Substitution of trans-fats Metabolic Syndrome
• hardening agent, shelf life Elliot et al. Am J Clin Nutr, 2002
Nutr, Le and Tappy, Curr Opin Clin Nutr Metab Care, 2006
Tappy,
Bray et al. Am J Clin Nutr, 2004
Nutr, Wei et al. J Nutr Biochem, 2006
Biochem,
• now being removed due to CVD risk Teff et al. J Clin Endocrinol Metab, 2004
Metab, Johnson et al. Am J Clin Nutr 2007
Gaby, Alt Med Rev, 2005 Rutledge and Adeli, Nutr Rev, 2007
Adeli,
Brown et al. Int. J. Obes, 2008
Obes,
8. Ethanol is a carbohydrate Ethanol is a carbohydrate
CH3-CH2-OH
Acute ethanol exposure Acute fructose exposure
Ethanol is a carbohydrate • CNS depression
• Vasodilatation, decreased BP
• Hypothermia
• Tachycardia
CH3-CH2-OH • Myocardial depression
• Variable pupillary responses
• Respiratory depression
• Diuresis
But ethanol is also a toxin • Hypoglycemia
• Loss of fine motor control
11. Relations between fructose, uric acid and
hypertension in NHANES IV adolescents
P = 0.01
S Nguyen et al. J Pediatr (in press)
Relations between fructose, uric acid and
hypertension in NHANES IV adolescents
P = 0.0495
S Nguyen et al. J Pediatr (in press)
12.
13. Fructose increases de novo lipogenesis, triglycerides
lipogenesis,
Fructose increases de novo lipogenesis in normal adults and free fatty acids in normal adults
Hellerstein et al. Ann Rev Nutr 16:523, 1996 Faeh and Schwarz, Diabetes 54:1907, 2005
ALT (U/ml)
Sugar sweetened beverages (kcal/day)
14.
15. Why is exercise important in obesity?
Because it burns calories?
So what’s with Colorado?
what’
Why is exercise important in obesity?
Because it burns calories?
Because it improves skeletal muscle insulin sensitivity
Because it reduces stress, and resultant cortisol release
Because it makes the TCA cycle run faster, and
detoxifies fructose, improving hepatic insulin sensitivity
So what’s with Colorado?
what’ Why is fiber important in obesity?
Four factors increase the hepatic TCA cycle
Cold Thyroid hormone
Altitude Exercise
16. Why is fiber important in obesity? Why is fiber important in obesity?
“When G-d made the poison, he packaged it with the antidote.” “When G-d made the poison, he packaged it with the antidote.”
Fiber:
1. Reduces rate of intestinal carbohydrate absorption,
reducing insulin response
2. Increases speed of transit of intestinal contents to ileum,
to raise PYY3-36, and induce satiety
3. Inhibits absorption of some free fatty acids to the colon,
which are metabolized by colonic bacteria to short-
chain fatty acids (SCFA), which suppress insulin
Chronic ethanol exposure Chronic ethanol exposure Chronic fructose exposure
• Hematologic disorders • Hematologic disorders
• Electrolyte abnormalities • Electrolyte abnormalities
• Hypertension • Hypertension • Hypertension
• Cardiac dilatation • Cardiac dilatation
• Cardiomyopathy • Cardiomyopathy • Myocardial infarction
• Dyslipidemia • Dyslipidemia • Dyslipidemia
• Pancreatitis • Pancreatitis • Pancreatitis (2o dyslipidemia)
• Malnutrition • Malnutrition
• Obesity • Obesity • Obesity
• Hepatic dysfunction (ASH) • Hepatic dysfunction (ASH) • Hepatic dysfunction (NASH)
• Fetal alcohol syndrome • Fetal alcohol syndrome • Fetal insulin resistance
• Addiction • Addiction • Habituation, if not addiction
What’s the difference?
What’ What’s the difference?
What’
Calories 150 150 Calories 150 150
Percent CHO 10.5% (sucrose) 3.6% (alcohol) Percent CHO 10.5% (sucrose) 3.6% (alcohol)
Calories from Calories from
fructose 75 (4.1 kcal/gm) fructose 75 (4.1 kcal/gm)
other carbs 75 (glucose) 60 (maltose) other carbs 75 (glucose) 60 (maltose)
alcohol 90 (7 kcal/gm) alcohol 90 (7 kcal/gm)
1st pass GI metabolism 0% 10% 1st pass GI metabolism 0% 10%
Calories reaching liver 90 92 Calories reaching liver 90 92
17. What’s the difference?
What’
Fructose is a carbohydrate
Calories 150 150
Percent CHO 10.5% (sucrose) 3.6% (alcohol)
Calories from
fructose 75 (4.1 kcal/gm)
other carbs 75 (glucose) 60 (maltose)
alcohol 90 (7 kcal/gm)
1st pass GI metabolism 0% 10%
Calories reaching liver 90 92
Fructose is a carbohydrate Fructose is a carbohydrate
Fructose is metabolized like fat Fructose is metabolized like fat
(corollary: a low fat diet isn’t really low fat,
because the fructose/sucrose doubles as fat)
Summary
• Fructose (sucrose vs. HFCS) consumption has increased
Fructose is a carbohydrate in the past 30 years, coinciding with the obesity epidemic
• A calorie is not a calorie, and fructose is not glucose
• You are not what you eat, you are what you DO with what you eat
• Hepatic fructose metabolism leads to all the manifestations of the
Fructose is metabolized like fat Metabolic Syndrome:
hypertension
de novo lipogenesis, dyslipidemia, and hepatic steatosis
inflammation
hepatic insulin resistance
obesity
Fructose is also a toxin hyperglycemia
CNS leptin resistance, promoting reward and
continuous consumption
• Fructose is a dose-dependent chronic hepatotoxin
(it’s “alcohol without the buzz”)
18. Collaborators
Childhood Obesity 2010:
The next generation in prevention and UCSF Dept. of Pediatrics
Chaluntorn Preeyasombat, M.D.
management Elvira Isganaitis, M.D.
Michele Mietus-Snyder, M.D.
Andrea Garber, Ph.D., R.D.
• SF Childhood Obesity Task Force Joan Valente, Ph.D.
• Sponsored by SF Dept. of Public Health Cam-Tu Tran, M.D.
Kristine Madsen, M.D., M.P.H.
• Training Day for Childhood Obesity Stephanie Nguyen, M.D.
• Saturday, Feb. 27, 2010, 8AM-5PM Carolyn Jasik, M.D., M.P.H.
UCSF Dept. of Epidemiology and Biostatistics
• Milton Marks Auditorium (Civic Center) Ann Lazar, Ph.D.
Peter Bacchetti, Ph.D.
• State of the art Saunak Sen, Ph.D.
• Theory, and tools to use in practice UC Berkeley Dept. of Nutritional Sciences
Jean-Marc Schwarz, Ph.D.
• CME offered Sharon Fleming, Ph.D.
Lorene Ritchie, Ph.D.