
Recomendados
Recomendados
Mais conteúdo relacionado
Mais procurados
Mais procurados (18)
Semelhante a Ret Conf Surv 2010
Semelhante a Ret Conf Surv 2010 (20)
Ret Conf Surv 2010
- 1. March 2010 • No. 340 The 2010 Retirement Confidence Survey: Confidence Stabilizing, But Preparations Continue to Erode By Ruth Helman, Mathew Greenwald and Associates, and Craig Copeland and Jack VanDerhei, Employee Benefit Research Institute E X E C U T I V E S U M M A R Y th 20TH ANNUAL RCS: The 2010 Retirement Confidence Survey—the 20 annual wave of this survey—finds that the record-low confidence levels measured during the past two years of economic decline appear to have bottomed out. The percentage of workers very confident about having enough money for a comfortable retirement has stabilized at 16 percent, which is statistically equivalent to the 20-year low of 13 percent measured in 2009 (Fig. 1, pg. 7). Retiree confidence about having a financially secure retirement has also stabilized, with 19 percent saying now they are very confident (statistically equivalent to the 20 percent measured in 2009) (Fig. 2, pg. 8). Worker confidence about paying for basic expenses in retirement has rebounded slightly, with 29 percent now saying they are very confident about having enough money to pay for basic expenses during retirement (up from 25 percent in 2009, but still down from 34 percent in 2008) (Fig. 3, pg. 9). PREPARATIONS STILL ERODING: Fewer workers report that they and/or their spouse have saved for retirement (69 percent, down from 75 percent in 2009 but statistically equivalent to 72 percent in 2008) (Fig. 11, page 14). Moreover, fewer workers say that they and/or their spouse are currently saving for retirement (60 percent, down from 65 percent in 2009 but statistically equivalent to percentages measured in other years) (Fig. 13, pg. 15). MORE PEOPLE HAVE NO SAVINGS AT ALL: An increased percentage of workers report they have virtually no savings and investments. Among RCS workers providing this type of information, 27 percent say they have less than $1,000 in savings (up from 20 percent in 2009). In total, more than half of workers (54 percent) report that the total value of their household’s savings and investments, excluding the value of their primary home and any defined benefit plans, is less than $25,000 (Fig. 14, pg. 16). CLUELESS ABOUT SAVINGS GOALS: Many workers continue to be unaware of how much they need to save for retirement. Less than half of workers (46 percent) report they and/or their spouse have tried to calculate how much money they will need to have saved for a comfortable retirement by the time they retire (Fig. 23, pg. 22). AMERICANS EXPECTING TO WORK LONGER: Although the age at which workers report they expect to retire shows little change from 2009, a longer-term look finds significant change. In particular, the percentage of workers who expect to retire after age 65 has increased over time, from 11 percent in 1991 to 14 percent in 1995, 19 percent in 2000, 24 percent in 2005, and 33 percent in 2010 (Fig. 29, pg. 28). INSTITUTIONAL CONFIDENCE LAGGING: Americans continue to lack confidence in institutions. They are most likely to express confidence in private employers (23 percent of workers and 27 percent of retirees very confident) and least likely to feel confidence in the federal government (11 percent of workers and 8 percent of retirees) (Fig. 20, pg. 20). Just 19 percent of workers and 22 percent of retirees report they are very confident about banks, while 12 percent of workers and 13 percent of retirees say they are very confident about insurance companies (Fig. 19, pg. 19). A research report from the EBRI Education and Research Fund © 2010 Employee Benefit Research Institute
- 2. Ruth Helman is research director for Mathew Greenwald & Associates. Craig Copeland is senior research associate at the Employee Benefit Research Institute (EBRI). Jack VanDerhei is the research director at EBRI. This Issue Brief was written with assistance from the Institute’s research and editorial staffs. Any views expressed in this report are those of the authors and should not be ascribed to the officers, trustees, or other sponsors of EBRI, EBRI-ERF, or their staffs. Neither EBRI nor EBRI-ERF lobbies or takes positions on specific policy proposals. EBRI invites comment on this research. Copyright Information: This report is copyrighted by the Employee Benefit Research Institute (EBRI). It may be used without permission but citation of the source is required. Recommended Citation: Ruth Helman, Craig Copeland, and Jack VanDerhei, “The 2010 Retirement Confidence Survey: Confidence Stabilizing, But Preparations Continue to Erode,” EBRI Issue Brief, no. 340, March 2010. Report availability: This report, along with six related 2010 RCS Fact Sheets, is available on the Internet at www.ebri.org The RCS Fact Sheets cover such topics as changing expectations about retirement, age, and gender, and are available online at www.ebri.org/surveys/rcs/2010/ The 2010 Retirement Confidence Survey was underwritten by more than 30 organizations, listed on pg. 4. Table of Contents Introduction ................................................................................................................................................................ 5 Retirement Confidence .............................................................................................................................................. 6 Overall Retirement Confidence ............................................................................................................................. 6 Confidence in Other Financial Aspects of Retirement .......................................................................................... 8 Preparing for Retirement ......................................................................................................................................... 13 Saving for Retirement.......................................................................................................................................... 13 Retirement Savings ............................................................................................................................................. 15 Employer Plans ................................................................................................................................................... 18 Retirement Savings Needs ................................................................................................................................. 22 Financial Advice .................................................................................................................................................. 25 Overconfidence? ................................................................................................................................................. 26 Changing Expectations About Retirement .............................................................................................................. 26 Retirement Age ................................................................................................................................................... 26 Working for Pay in Retirement ............................................................................................................................ 30 Spending in Retirement ....................................................................................................................................... 31 Sources of Retirement Income ............................................................................................................................ 34 Confidence in Entitlement Programs................................................................................................................... 38 Use of Guaranteed-Income Products .................................................................................................................. 42 Length of Retirement ........................................................................................................................................... 43 RCS Methodology.................................................................................................................................................... 43 Endnotes .................................................................................................................................................................. 43 Figures Figure 1, Worker Confidence in Having Enough Money Enough Money to Live Comfortably Throughout Their Retirement Years ........................................................................................................................................... 7 Figure 2, Retiree Confidence in Having Enough Money to Live Comfortably Throughout Their Retirement Years ............................................................................................................................................................. 8 ebri.org Issue Brief • March 2010 • No. 340 2
- 3. Figure 3, Worker Confidence in Having Enough Money to Pay for Basic Expenses in Retirement ............................ 9 Figure 4, Worker Confidence in Having Enough Money to Pay for Medical Expenses in Retirement ........................ 9 Figure 5, Worker Confidence in Having Enough Money to Pay for Long-term Care Expenses in Retirement ......... 10 Figure 6, Worker Confidence in Doing a Good Job of Preparing Financially for Retirement .................................... 10 Figure 7, Retiree Confidence in Having Enough Money to Pay for Basic Expenses in Retirement .......................... 11 Figure 8, Retiree Confidence in Having Enough Money to Pay for Medical Expenses in Retirement ...................... 12 Figure 9, Retiree Confidence in Having Enough Money to Pay for Long-term Care Expenses in Retirement ......... 12 Figure 10, Retiree Confidence in Having Done a Good Job of Preparing Financially for Retirement ....................... 13 Figure 11, Workers Having Saved Money for Retirement.......................................................................................... 14 Figure 12, Retirees Having Saved Money for Retirement.......................................................................................... 14 Figure 13, Workers Currently Saving Money for Retirement ..................................................................................... 15 Figure 14, Total Savings and Investments Reported by Workers, Among Those Providing a Response ................. 16 Figure 15, Total Savings and Investments Reported by Retirees, Among Those Providing a Response .................. 17 Figure 16, Worker Confidence That Retirement Savings are Invested Wisely, Among Those Having Saved for Retirement .............................................................................................................................................. 17 Figure 17, Retiree Confidence That Retirement Savings are Invested Wisely, Among Those Having Saved for Retirement .............................................................................................................................................. 18 Figure 18, Attitude About Stocks as a Sound Investment .......................................................................................... 19 Figure 19, Worker Confidence in Institutions ............................................................................................................. 19 Figure 20, Retiree Confidence in Institutions ............................................................................................................. 20 Figure 21, Reported Offer and Take Up of Employer-Sponsored Retirement Savings Plans, Among Employed Workers ....................................................................................................................................................... 20 Figure 22, Favor/Oppose Changes to Withdrawals Permitted From Employer-Sponsored Retirement Savings Plans, Among Workers ................................................................................................................................ 21 Figure 23, Workers Having Tried to Calculate How Much Money They Need to Save for a Comfortable Retirement ................................................................................................................................................... 22 Figure 24, Method of Determining Savings Needed for Retirement, by Doing a Retirement Needs Calculation ...... 23 Figure 25, Amount of Savings Workers Think They Need for Retirement, by Household Income ............................ 23 Figure 26, Amount of Savings Workers Think They Need for Retirement, Among Those Doing a Retirement Needs Calculation........................................................................................................................................ 24 Figure 27, Worker Confidence in Ability to Accumulate Need Retirement Savings, by Doing a Retirement Needs Calculation........................................................................................................................................ 25 Figure 28, Workers Reporting They Postponed their Expected Retirement Age in Past 12 Months ........................ 27 Figure 29, Trend in Workers’ Expected Retirement Age............................................................................................ 28 Figure 30, Trend in Retirees’ Actual Retirement Age................................................................................................. 29 Figure 31, Comparison of Expected (Workers) and Actual (Retirees) Retirement Age ............................................. 29 Figure 32, Timing of Retirement, Among Retirees ..................................................................................................... 30 Figure 33, Comparison of Planned (Workers) and Actual (Retirees) Work for Pay in Retirement ............................ 31 Figure 34, Reasons for Working for Pay in Retirement, Among Retirees Who Worked for Pay ............................... 32 Figure 35, Trend in Post-Retirement vs. Pre-Retirement Spending, Among Workers .............................................. 33 Figure 36, Trend in Post-Retirement vs. Pre-Retirement Spending, Among Retirees .............................................. 33 ebri.org Issue Brief • March 2010 • No. 340 3
- 4. Figure 37, Expected (Workers) vs. Actual (Retirees) Participation in Employer-Provided Retiree Health Insurance ..................................................................................................................................................... 34 Figure 38, Expected (Worker) vs. Actual (Retiree) Sources of Income in Retirement ............................................... 35 Figure 39, Workers Expecting Retirement Income from Social Security and Defined Benefit Plans ........................ 36 Figure 40, Workers Expecting Retirement Income from Social Security and Defined Benefit Plans ........................ 36 Figure 41, Workers Expecting Retirement Income from Savings and Employment .................................................. 37 Figure 42, Retirees Receiving Retirement Income from Savings and Employment .................................................. 37 Figure 43, Worker Confidence That Social Security Will Continue to Provide Benefits of at Least Equal Value to Benefits Received by Retirees Today ........................................................................................... 38 Figure 44, Retiree Confidence That Social Security Will Continue to Provide Benefits of at Least Equal Value to Benefits Received by Retirees Today ........................................................................................... 39 Figure 45, Worker Confidence That Medicare Will Continue to Provide Benefits of at Least Equal Value to Benefits Received by Retirees Today ......................................................................................................... 39 Figure 46, Retiree Confidence That Medicare Will Continue to Provide Benefits of at Least Equal Value to Benefits Received by Retirees Today ......................................................................................................... 40 Figure 47, Favor/Oppose Changes to Social Security ............................................................................................... 41 Figure 48, Favor/Oppose Changes to Medicare ........................................................................................................ 41 Figure 49, Likelihood of Purchasing a Guaranteed-Income Product or Selecting a Guaranteed-Income Option from an Employer-Sponsored Retirement Plan, Among Workers .............................................. 42 2010 Retirement Confidence Survey Underwriters This survey was made possible by the financial support of the following organizations: AALU/MDRT Financial Literacy Program Natixis Global Associates AARP PIMCO American Express Principal Financial Group Bank of America Prudential Retirement Capital Research and Management Company Russell Investment Group Deere & Company Schering-Plough Corp Fidelity Investments Schwab FINRA Investor Education Foundation Securian Financial Group Genworth Financial Segal Company IBM TIAA-CREF Institute Hewitt Associates Towers Watson InCharge Education Foundation T. Rowe Price MassMutual Financial Group The Vanguard Group MetLife USAA MFS Investment Management Wells Fargo Institutional Retirement and Trust Morgan Stanley Smith Barney ebri.org Issue Brief • March 2010 • No. 340 4
- 5. The 2010 Retirement Confidence Survey: Confidence Stabilizing, But Preparations Continue to Erode By Ruth Helman, Mathew Greenwald and Associates, and Craig Copeland and Jack VanDerhei, Employee Benefit Research Institute Introduction The 20th wave of the Retirement Confidence Survey (RCS) finds that Americans’ confidence in their ability to afford a comfortable retirement, which had dropped sharply over the past two years, has stabilized now that the economic volatility of the recession has abated. The steep declines in other retirement confidence indicators also appear to be slowing. However, the retirement preparations reported by some workers1 are eroding, leaving them less prepared for retirement. Findings in this year’s RCS include: • The percentage of workers very confident about having enough money for a comfortable retirement remains steady at 16 percent, which is statistically equivalent to the 20-year low of 13 percent measured in 2009 (Figure 1, page 7). Retiree confidence about having a financially secure retirement has also stabilized, with 19 percent saying now they are very confident (statistically equivalent to the 20 percent measured in 2009) (Figure 2, page 8). • Worker confidence about paying for basic expenses in retirement has rebounded slightly, with 29 percent now saying they are very confident about having enough money to pay for basic expenses during retirement (up from 25 percent in 2009, but still down from 34 percent in 2008) (Figure 3, page 9). The percentage of retirees indicating they are very confident about paying for basic expenses has stayed level at 33 percent (statistically equivalent to the 34 percent observed in 2009) (Figure 7, page 11). • The percentages of workers very confident about other financial aspects of retirement have held steady at 12 percent for medical expenses, 10 percent for long-term care expenses, and 21 percent for doing a good job of preparing for retirement. However, the percentages not confident continue to creep upward, from 44 percent in 2009 to 51 percent in 2010 for medical expenses, from 56 percent to 61 percent for long-term care expenses, and from 30 percent to 35 percent for doing a good job of preparing for retirement (Figures 4–6, pages 9–10). • Fewer workers report that they and/or their spouse have saved for retirement (69 percent, down from 75 per- cent in 2009 but statistically equivalent to 72 percent in 2008) (Figure 11, page 14). Moreover, fewer workers say that they and/or their spouse are currently saving for retirement (60 percent, down from 65 percent in 2009 but statistically equivalent to percentages measured in other years) (Figure 13, page 15). • An increased percentage of workers report they have virtually no savings and investments. Among RCS workers providing this type of information, 27 percent say they have less than $1,000 in savings (up from 20 percent in 2009). In total, more than half of workers (54 percent) report that the total value of their household’s savings and investments, excluding the value of their primary home and any defined benefit plans, is less than $25,000 (Figure 14, page 16). • Those who have saved for retirement have recovered some confidence in their ability to invest their savings wisely. Thirty-two percent of workers indicate they are very confident (up from 24 percent in 2009) and another 54 percent are somewhat confident (Figure 16, page 17). Retirees who have saved for retirement show a similar rebound in confidence that they are investing their savings wisely, with 82 percent saying they are very or somewhat confident (up from 70 percent in 2009) (Figure 17, page 18). ebri.org Issue Brief • March 2010 • No. 340 5
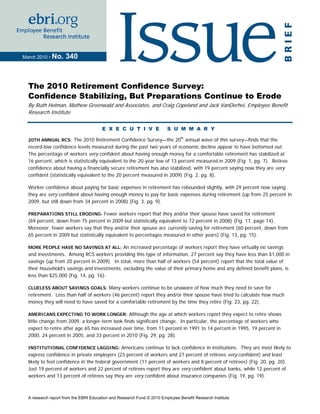
- 6. • Many workers continue to be unaware of how much they need to save for retirement. Less than half of workers (46 percent) report they and/or their spouse have tried to calculate how much money they will need to have saved by the time they retire so that they can live comfortably in retirement (Figure 23, page 22). • The savings goals cited by workers who have done a retirement needs calculation have increased over time. In the 2000 RCS, 31 percent said they needed to accumulate at least $500,000 for retirement. This percentage gradually increased to 43 percent in 2005 and 54 percent in 2010 (Figure 27, page 25). • One-quarter of workers (24 percent) report they have postponed their planned retirement age in the past year (Figure 28, page 27). Among the reasons cited for delaying retirement are the poor economy (29 percent of those postponing retirement), a change in their employment situation (22 percent), inadequate finances (16 per- cent), and the need to make up for losses in the stock market (12 percent). • Although the age at which workers report they expect to retire shows little change from 2009, a longer-term look finds significant change. In particular, the percentage of workers who expect to retire after age 65 has increased over time, from 11 percent in 1991 to 14 percent in 1995, 19 percent in 2000, 24 percent in 2005, and 33 percent in 2010 (Figure 29, page 28). • Americans continue to lack confidence in institutions. They are most likely to express confidence in private employers (23 percent of workers and 27 percent of retirees very confident) and least likely to feel confidence in the federal government (11 percent of workers and 8 percent of retirees). Just 19 percent of workers and 22 percent of retirees report they are very confident about banks, while 12 percent of workers and 13 percent of retirees say they are very confident about insurance companies (Figure 19, page 19). Moreover, the percentages of retirees somewhat confident about banks (45 percent, down from 51 percent in 2009), insurance companies (42 percent, down from 56 percent), and the federal government (30 percent, down from 45 per- cent) are declining (Figure 20, page 20). • Over time, the RCS has observed changes in workers’ expected sources of retirement income. In particular: fewer workers are expecting to receive retirement income from Social Security (77 percent, down from 88 per- cent in 1991) and defined benefit plans (56 percent, down from 62 percent in 2005) (Figure 39, page 36). However, more workers report they will rely on employer-sponsored retirement savings plans (75 percent in 2010, up from 69 percent in 2005) and employment income (77 percent, up from 70 percent in 2005) (Figure 41, page 37). • Few workers report they are likely to purchase a financial product or select a retirement plan option that pays them guaranteed income each month for the rest of their life. Only 11 percent indicate they are very likely to do so, while 35 percent say they are somewhat likely (Figure 49, page 42). Only 14 percent of retirees report they purchased a guaranteed-income product or selected a guaranteed-income option from a retirement plan. Retirement Confidence Overall Retirement Confidence The downward trend in Americans’ confidence in their ability to retire comfortably appears to be stabilizing, now that the economic volatility of the recession has abated. Sixteen percent of workers in the 2010 RCS say they are very confident they will have enough money to live comfortably throughout their retirement years (statistically equivalent to the low of 13 percent measured in 2009). Forty-six percent are not too or not at all confident they will have enough money to live comfortably (statistically equivalent to the 44 percent observed in 2009). Overall retirement confidence has fluctuated over the 20 years of the RCS, reaching its highest levels among workers in 2007 (27 percent very confident), 2005 (25 percent) and 2000 (25 percent) and its lowest level in 2009 (Figure 1). ebri.org Issue Brief • March 2010 • No. 340 6
- 7. Figure 1 Worker Confidence in Having Enough Money to Live Comfortably Throughout Their Retirement Years Very Somewhat Not too Not at all Don't know/Refused 6% 8% 10% 10% 13% 10% 16% 17% 14% 16% 17% 22% 22% 19% 19% 18% 19% 19% 17% 18% 17% 18% 17% 21% 22% 24% 51% 47% 47% 43% 55% 45% 44% 40% 44% 41% 43% 41% 38% 25% 23% 24% 25% 24% 27% 18% 21% 22% 21% 18% 13% 16% 1993 1995 2000 2001 2002 2003 2004 2005 2006 2007 2008 2009 2010 Source: Employee Benefit Research Institute and Mathew Greenwald & Associates, Inc., 1993–2010 Retirement Confidence Surveys. Retiree confidence about having a financially secure retirement also appears to have stabilized. Nineteen percent now say they are very confident about having enough money to live comfortably throughout their retirement years (statistically equivalent to the 20 percent measured in 2009). At the same time, 39 percent are not confident about having enough money (statistically equivalent to the 32 percent observed in 2009 and 34 percent in 2008). Like worker confidence, retiree confidence in having enough money has varied over the 20 years of the RCS, but it remained fairly steady at roughly 40 percent very confident from 2001 through 2007 (Figure 2). As would be expected, worker confidence in having enough money for a comfortable retirement increases with household income. Worker confidence also increases with savings and investments, education, and improved health status. Those who have experienced increases in income (compared with those whose income in 2009 was the same or lower than in 2008) or financial assets (compared with those whose assets in January 2010 were the same or lower than in January 2008) are more likely to express confidence in having enough money for a comfortable retirement. Others more often confident are men (compared with women), married workers (compared with those not married), those who participate in a defined contribution retirement plan (compared with those who do not), those who report they or their spouse currently have benefits from a defined benefit plan (compared with those who do not), and those who expect to have access to employer-provided health insurance (compared with those who do not). ebri.org Issue Brief • March 2010 • No. 340 7
- 8. Figure 2 Retiree Confidence in Having Enough Money to Live Comfortably Throughout Their Retirement Years Very Somewhat Not too Not at all Don't Know/Refused 5% 5% 7% 6% 11% 11% 11% 11% 7% 11% 13% 13% 17% 16% 18% 12% 10% 16% 18% 14% 16% 12% 10% 16% 12% 16% 17% 21% 40% 38% 37% 32% 35% 27% 33% 41% 45% 47% 35% 47% 41% 40% 39% 42% 40% 40% 41% 34% 37% 27% 26% 29% 20% 19% 1993 1995 2000 2001 2002 2003 2004 2005 2006 2007 2008 2009 2010 Source: Employee Benefit Research Institute and Mathew Greenwald & Associates, Inc., 1993–2010 Retirement Confidence Surveys. Confidence in Other Financial Aspects of Retirement The 2010 RCS finds that the sharp declines in confidence of the past two years about other financial aspects of retirement are slowing or even reversing. Most notably, 29 percent of workers are now very confident that they will have enough money to pay for basic expenses during retirement (up from 25 percent in 2009, but still down from 34 percent in 2008 and 40 percent in 2007). Twenty-five percent say they are not too or not at all confident about their ability to pay for basic expenses (level with the 25 percent measured in 2009) (Figure 3). The declines in worker confidence about having enough money to pay for medical expenses and long-term care expenses in retirement appear to be slowing; however, they have not yet stabilized. The percentages of workers who are very confident about being able to pay for medical expenses (12 percent, statistically equivalent to 13 percent in 2009) and long-term care expenses (10 percent, level with 10 percent from 2009) show no change from the percentages measured in 2009. But while the percentages who are very confident remain the same, the percentages not confident about being able to afford these types of expenses continue to increase, from 44 percent in 2009 to 51 percent for medical expenses and from 56 percent in 2009 to 61 percent for long-term care expenses. In fact, these are the highest percentages of workers not confident regarding their ability to pay for health and long-term care expenses in retirement ever measured in the RCS (Figures 4 and 5). Worker confidence that they are doing a good job of preparing financially for their retirement follows a similar pattern. While the percentage very confident remains stable (21 percent, statistically equivalent to 20 percent in 2009 and 23 percent in 2008), the percentage not confident continued to increase, from 28 percent in 2008 and 30 percent in 2009 to 35 percent in 2010 (Figure 6). In one sense, however, the increasing lack of confidence among workers about the adequacy of their financial preparations for retirement may be good news. Workers who admit they lack confidence about their retirement preparations may be more willing to make corrections and accept advice than are those who are convinced that their retirement preparations are on track to provide them with a comfortable retirement. ebri.org Issue Brief • March 2010 • No. 340 8
- 9. Figure 3 Worker Confidence in Having Enough Money to Pay for Basic Expenses in Retirement Very Somewhat Not Too Not At All Don't Know / Refused 5% 3% 7% 6% 8% 9% 7% 10% 11% 11% 9% 11% 12% 9% 12% 9% 10% 8% 11% 9% 12% 12% 10% 11% 14% 13% 49% 44% 46% 42% 43% 47% 47% 41% 45% 42% 45% 49% 46% 38% 38% 40% 37% 38% 36% 35% 35% 40% 33% 34% 29% 25% 1993 1995 2000 2001 2002 2003 2004 2005 2006 2007 2008 2009 2010 Source: Employee Benefit Research Institute and Mathew Greenwald & Associates, Inc., 1993–2010 Retirement Confidence Surveys. Figure 4 Worker Confidence in Having Enough Money to Pay for Medical Expenses in Retirement Very Somewhat Not Too Not At All Don't Know / Refused 5% 13% 14% 17% 17% 14% 15% 19% 19% 20% 22% 20% 22% 26% 19% 21% 18% 21% 20% 26% 22% 22% 21% 23% 21% 22% 25% 42% 46% 45% 40% 42% 33% 38% 40% 38% 37% 37% 42% 37% 21% 24% 20% 20% 21% 20% 20% 17% 18% 19% 18% 13% 12% 1993 1995 2000 2001 2002 2003 2004 2005 2006 2007 2008 2009 2010 Source: Employee Benefit Research Institute and Mathew Greenwald & Associates, Inc., 1993–2010 Retirement Confidence Surveys. ebri.org Issue Brief • March 2010 • No. 340 9
- 10. Figure 5 Worker Confidence in Having Enough Money to Pay for Long-term Care Expenses in Retirement Very Somewhat Not Too Not At All Don't Know / Refused 19% 22% 22% 23% 21% 26% 28% 24% 26% 27% 30% 31% 29% 28% 26% 23% 26% 26% 28% 25% 26% 27% 26% 30% 35% 35% 36% 36% 34% 30% 34% 33% 29% 31% 32% 27% 16% 15% 13% 14% 16% 17% 15% 17% 13% 12% 10% 10% 1998 2000 2001 2002 2003 2004 2005 2006 2007 2008 2009 2010 Source: Employee Benefit Research Institute and Mathew Greenwald & Associates, Inc., 1998–2010 Retirement Confidence Surveys. Figure 6 Worker Confidence in Doing a Good Job of Preparing Financially for Retirement Very Somewhat Not Too Not At All Don't Know / Refused 12% 10% 10% 10% 12% 12% 12% 13% 14% 16% 13% 14% 16% 13% 18% 18% 14% 14% 16% 18% 16% 15% 12% 15% 16% 19% 49% 47% 43% 49% 47% 46% 50% 45% 47% 45% 48% 49% 43% 25% 28% 27% 24% 26% 26% 25% 26% 21% 23% 23% 20% 21% 1993 1995 2000 2001 2002 2003 2004 2005 2006 2007 2008 2009 2010 Source: Employee Benefit Research Institute and Mathew Greenwald & Associates, Inc., 1993–2010 Retirement Confidence Surveys. ebri.org Issue Brief • March 2010 • No. 340 10
- 11. Retirees tend to express higher levels of confidence than workers about each of these financial aspects of retirement, and the 2010 RCS finds that the marked declines of previous years have halted. After decreasing from 48 percent in 2007 to 34 percent in 2008, the percentage of retirees very confident in having enough money to pay for basic expenses has remained steady at 34 percent in 2009 and 33 percent in 2010. At the same time, 25 percent continue to be not confident about paying for basic expenses (statistically unchanged from 21 percent in 2009 and 20 percent in 2008) (Figure 7). Figure 7 Retiree Confidence in Having Enough Money to Pay for Basic Expenses in Retirement Very Somewhat Not Too Not At All Don't Know / Refused 6% 5% 9% 6% 8% 5% 7% 8% 9% 7% 7% 8% 14% 5% 10% 7% 8% 11% 7% 8% 11% 9% 11% 12% 14% 6% 18% 36% 41% 31% 40% 35% 44% 36% 42% 40% 32% 45% 45% 42% 48% 44% 49% 48% 40% 43% 44% 41% 44% 38% 34% 34% 33% 1993 1995 2000 2001 2002 2003 2004 2005 2006 2007 2008 2009 2010 Source: Employee Benefit Research Institute and Mathew Greenwald & Associates, Inc., 1993–2010 Retirement Confidence Surveys. Similarly, the declining percentages of retirees very confident about having enough money to cover medical expenses (23 percent, statistically unchanged from 25 percent in 2009) and long-term care expenses (13 percent, statistically unchanged from 15 percent in 2009) appear to have stabilized. The percentages not confident about medical (32 per- cent in 2010 and 28 percent in 2009) and long-term care (51 percent in 2010 and 55 percent in 2009) expenses also do not show any statistically meaningful changes (Figures 8 and 9). Although the percentage of retirees very confident that they had done a good job of preparing for retirement fell from 39 percent in 2007 to 26 percent in 2008, it has remained steady since then at 28 percent in 2009 and 30 percent in 2010. Likewise, approximately 3 in 10 retirees continue to be not confident about having done a good job (28 percent in 2008, 33 percent in 2009, and 27 percent in 2010) (Figure 10). Inversely related to confidence in having enough money for a comfortable retirement is worry about becoming financially dependent upon others in retirement or old age, and this appears to be a real concern for a sizable minority of Americans. Seventeen percent of workers and 18 percent of retirees report the statement “you worry about being financially dependent on others during your retirement/later years” describes them very well. Another 23 percent of workers and 22 percent of retirees indicate it describes them somewhat well. On the other hand, 36 percent of workers and 43 percent of retirees say this statement about worrying about financial dependence does not describe them at all, including 65 percent of workers who are very confident they will have enough money for a comfortable retirement, 38 percent of workers who are somewhat confident, and 23 percent of those who are not confident. ebri.org Issue Brief • March 2010 • No. 340 11
- 12. Figure 8 Retiree Confidence in Having Enough Money to Pay for Medical Expenses in Retirement Very Somewhat Not Too Not At All Don't Know / Refused 6% 4% 4% 4% 12% 9% 10% 12% 10% 11% 14% 10% 11% 15% 12% 16% 15% 17% 15% 10% 18% 15% 17% 15% 16% 21% 12% 11% 17% 19% 32% 36% 37% 31% 36% 39% 34% 38% 37% 32% 33% 46% 42% 37% 42% 41% 32% 32% 32% 35% 36% 34% 36% 30% 25% 23% 1993 1995 2000 2001 2002 2003 2004 2005 2006 2007 2008 2009 2010 Source: Employee Benefit Research Institute and Mathew Greenwald & Associates, Inc., 1993–2010 Retirement Confidence Surveys. Figure 9 Retiree Confidence in Having Enough Money to Pay for Long-term Care Expenses in Retirement Very Somewhat Not Too Not At All Don't Know / Refused 5% 4% 4% 4% 6% 24% 16% 24% 24% 26% 26% 27% 24% 28% 27% 27% 38% 25% 15% 18% 23% 18% 19% 24% 24% 17% 22% 24% 17% 23% 33% 27% 30% 33% 30% 31% 24% 28% 29% 29% 30% 26% 30% 27% 22% 21% 23% 22% 24% 19% 19% 15% 13% 1998 2000 2001 2002 2003 2004 2005 2006 2007 2008 2009 2010 Source: Employee Benefit Research Institute and Mathew Greenwald & Associates, Inc., 1998–2010 Retirement Confidence Surveys. ebri.org Issue Brief • March 2010 • No. 340 12
- 13. Figure 10 Retiree Confidence in Having Done a Good Job of Preparing Financially for Retirement Very Somewhat Not Too Not At All Don't Know / Refused 4% 10% 10% 13% 10% 7% 11% 13% 14% 11% 18% 16% 16% 17% 10% 10% 12% 14% 16% 6% 13% 16% 11% 15% 13% 11% 17% 34% 35% 41% 42% 38% 40% 38% 31% 42% 41% 42% 43% 37% 41% 38% 42% 39% 32% 35% 35% 35% 26% 30% 26% 28% 30% 1993 1995 2000 2001 2002 2003 2004 2005 2006 2007 2008 2009 2010 Source: Employee Benefit Research Institute and Mathew Greenwald & Associates, Inc., 1993–2010 Retirement Confidence Surveys. Preparing for Retirement Saving for Retirement It would be encouraging to find that Americans have bolstered their retirement confidence by improving their preparations for retirement, but that may not be the case. Although the percentage of workers who reported they and/or their spouse had saved for retirement increased briefly in 2009 (75 percent), it now stands at 69 percent. While the percentage of workers having saved for retirement increased from 1995–2000, it declined significantly in 2001 and has hovered around 70 percent throughout most of the 2000s (Figure 11). The percentage of retirees having saved for retirement climbed slowly from 48 percent in 1995 to 68 percent in 2006 and 2007 and now stands at 71 percent (up from 62 percent in 2009) (Figure 12). Not all workers who have saved for retirement are currently saving for this purpose. Sixty percent of workers in the 2010 RCS report that they and/or their spouse are currently saving for retirement (down from 65 percent in 2009, but statistically equivalent to the percentages measured in other years) (Figure 13). Not surprisingly, the likelihood of having saved for retirement among both workers and retirees is strongly related to household income. The proportion saying they have saved for retirement also increases as education levels rise or health status improves. In addition, married workers are more likely than those not married to have set money aside. Other groups of workers more likely to have saved for retirement include those age 45 and older (compared with workers age 25–44), those currently participating in a work place retirement savings plan (compared with those not participating), those having attempted a retirement savings needs calculation (compared with those who have not), and those who currently have a defined benefit plan (compared with those who do not). ebri.org Issue Brief • March 2010 • No. 340 13
- 14. Figure 11 Workers Having Saved Money for Retirement Respondent Respondent and/or Spouse 78% 75% 69% 72% 71% 70% 72% 68% 69% 69% 66% 74% 65% 67% 68% 57% 58% 1994 1995 2000 2001 2002 2003 2004 2005 2006 2007 2008 2009 2010 Source: Employee Benefit Research Institute and Mathew Greenwald & Associates, Inc., 1994–2010 Retirement Confidence Surveys. Figure 12 Retirees Having Saved Money for Retirement Respondent Respondent and/or Spouse 68% 71% 65% 66% 68% 62% 64% 64% 59% 61% 62% 59% 61% 63% 52% 54% 48% 1994 1995 2000 2001 2002 2003 2004 2005 2006 2007 2008 2009 2010 Source: Employee Benefit Research Institute and Mathew Greenwald & Associates, Inc., 1994–2010 Retirement Confidence Surveys. ebri.org Issue Brief • March 2010 • No. 340 14
- 15. Figure 13 Workers Currently Saving Money for Retirement 64% 64% 65% 61% 61% 62% 62% 60% 60% 58% 2001 2002 2003 2004 2005 2006 2007 2008 2009 2010 Source: Employee Benefit Research Institute and Mathew Greenwald & Associates, Inc., 2001–2010 Retirement Confidence Surveys. Three in 10 Americans age 25 and over report they have not saved any money for retirement (29 percent of workers and retirees). Of these, 79 percent of workers and 60 percent of retirees say this is because they cannot or could not afford to save. Less than 10 percent mention each of these other reasons for not saving: • Having other saving priorities (6 percent of both workers and retirees). • Never getting around to it (5 percent of workers, 6 percent of retirees). • Thinking they had plenty of time to save (4 percent of workers, 8 percent of retirees). • Being ignorant and not informed about retirement planning (3 percent of workers, 6 percent of retirees). • Retirement seeming too far away (2 percent of workers, 5 percent of retirees). Thirty-one percent of workers who have not saved are nevertheless very or somewhat confident that they will have enough money for a comfortable retirement. However, this percentage has steadily declined from 47 percent in 2004, suggesting that workers are increasingly recognizing the need to save at least some money themselves if they would like to achieve a financially secure retirement. Retirement Savings The percentage of workers who have virtually no money in savings and investments has increased over the past year. Among RCS workers providing this type of information, 54 percent report that the total value of their household’s savings and investments, excluding the value of their primary home and any defined benefit plans, is less than $25,000. Moreover, 27 percent say they have less than $1,000 in savings (up from 20 percent in 2009). Approximately 1 in 10 each report totals of $25,000–$49,999 (12 percent), $50,000–$99,999 (11 percent), $100,000–$249,999 (11 percent), and $250,000 or more (11 percent) (Figure 14). Retirees provide similar estimates of total household savings (Figure 15). ebri.org Issue Brief • March 2010 • No. 340 15
- 16. Figure 14 Total Savings and Investments Reported by Workers, Among Those Providing a Response (not including value of primary residence or defined benefit plans) 2002 2005 2006 2007 2008 2009 2010 Less than $1,000 20% 27% 39% 35% 36% $1,000–$9,999 50% 52% 19 16 $10,000–$24,999 14 13 13 13 11 $25,000–$49,999 13 13 12 10 12 11 12 $50,000–$99,999 15 11 12 13 12 12 11 $100,000–$249,999 15 12 11 15 15 12 11 $250,000 or more 7 11 12 14 12 12 11 Source: Employee Benefit Research Institute and Mathew Greenwald & Associates, Inc., 2002–2010 Retirement Confidence Surveys. These findings are similar to some other estimates of American household assets. Quantifiable data from the 2007 Survey of Consumer Finances (conducted by the U.S. Federal Reserve Board) found that the median (midpoint) level of household assets of all Americans who have an asset is $221,500.2 This includes the value of the primary home, which had a median value of $200,000 for those who owned a home. Since then, home values have declined nationwide. Older workers tend to report higher amounts of assets. Seventy-one percent of workers age 25–34 have total savings and investments of less than $25,000, compared with 42 percent of workers age 45 and older. At the same time, 18 percent of workers age 45 and older cite assets of $250,000 or more (versus 4 percent of workers age 25–34). As one might suspect, total savings and investments increase sharply with household income, education, and health status. Workers who have done a retirement savings needs calculation (compared with those who have not) tend to have higher levels of savings. In addition, those who have saved for retirement are more likely than those who have not saved to have substantial levels of savings. In fact, 69 percent of those who have not saved for retirement say their assets total less than $1,000. One-third of workers who have saved for retirement (32 percent) say they are very confident that they are investing their retirement savings wisely (up from 24 percent in 2009, but down from the high of 45 percent measured in 1998). Another 54 percent are somewhat confident that their savings are wisely invested (Figure 16). Retirees who have saved for retirement show a similar rebound in confidence that they are investing their savings wisely, from 70 percent very or somewhat confident in 2009 to 82 percent in 2010 (Figure 17). ebri.org Issue Brief • March 2010 • No. 340 16
- 17. Figure 15 Total Savings and Investments Reported by Retirees, Among Those Providing a Response (not including value of primary residence or defined benefit plans) 2002 2005 2006 2007 2008 2009 2010 Less than $1,000 23% 27% 30% 32% 51% $1,000–$9,999 45% 43% 17 15 $10,000–$24,999 12 13 9 16 14 $25,000–$49,999 7 20 14 10 9 13 11 $50,000–$99,999 14 7 11 12 6 9 6 $100,000–$249,999 19 11 13 20 13 10 15 $250,000 or more 15 19 21 14 12 12 12 Source: Employee Benefit Research Institute and Mathew Greenwald & Associates, Inc., 2002–2010 Retirement Confidence Surveys. Figure 16 Worker Confidence That Retirement Savings Are Invested Wisely, Among Those Having Saved for Retirement Very Somewhat Not Too Not At All Don't Know/Refused 6% 5% 6% 8% 9% 11% 15% 47% 54% 51% 54% 45% 29% 32% 24% 1998 2002 2009 2010 Source: Employee Benefit Research Institute and Mathew Greenwald & Associates, Inc., 1998–2010 Retirement Confidence Surveys. ebri.org Issue Brief • March 2010 • No. 340 17
- 18. Figure 17 Retiree Confidence That Retirement Savings Are Invested Wisely, Among Those Having Saved for Retirement Very Somewhat Not Too Not At All Don't Know/Refused 4% 9% 12% 9% 14% 46% 38% 32% 36% 2009 2010 Source: Employee Benefit Research Institute and Mathew Greenwald & Associates, Inc., 2009–2010 Retirement Confidence Surveys. One reason that confidence in their investments may have increased among retirees is that many have recovered confidence in the value of equities as a long-term investment. Forty-six percent of retirees (up from 30 percent in 2009 and statistically equivalent to the 43 percent observed in 2002) indicate that the statement “Over the long run—10 to 20 years—you believe that stocks in general will be a very good investment” describes them very or somewhat well. Overall, workers are statistically as likely as in 2009 to say this statement describes them well (52 percent in 2010 and 48 percent in 2009, down from 61 percent in 2002) (Figure 18). However, workers who have saved for retirement are now more likely to indicate the statement applies to them (64 percent, up from 54 percent in 2009). Nevertheless, Americans continue to lack confidence in institutions. Just 19 percent of workers and 22 percent of retirees report they are very confident about banks, while 12 percent of workers and 13 percent of retirees say they are very confident about insurance companies. They are most likely to express confidence in private employers (23 per- cent of workers and 27 percent of retirees very confident) and least likely to feel confidence in the federal government (11 percent of workers and 8 percent of retirees). Moreover, the percentages of retirees somewhat confident about banks (45 percent, down from 51 percent in 2009), insurance companies (42 percent, down from 56 percent), and the federal government (30 percent, down from 45 percent) are declining (Figures 19 and 20). Employer Plans One of the primary vehicles that workers use to save for retirement is an employer-sponsored retirement savings plan, such as a 401(k). Eighty-one percent of eligible workers (40 percent of all workers) say they participate in such a plan with their current employer (Figure 21). ebri.org Issue Brief • March 2010 • No. 340 18
- 19. Figure 18 Attitude About Stocks as a Sound Investment Very Well Somewhat Well 2010 17% 35% 52% 2009 17% 31% 48% Workers 2002 22% 38% 61% 2000 28% 40% 68% 2010 14% 32% 46% 2009 13% 17% 30% Retirees 2002 23% 21% 43% 2000 25% 23% 48% Source: Employee Benefit Research Institute and Mathew Greenwald & Associates, Inc., 2000–2010 Retirement Confidence Surveys. Figure 19 Worker Confidence in Institutions Very Confident Somewhat Confident 2010 23% 55% 77% Private employers 2009 NA 2010 19% 56% 75% Banks 2009 21% 56% 76% 2010 12% 50% 62% Insurance companies 2009 14% 53% 67% 2010 11% 44% 55% The federal government 2009 11% 48% 59% Source: Employee Benefit Research Institute and Mathew Greenwald & Associates, Inc., 2009–2010 Retirement Confidence Surveys. ebri.org Issue Brief • March 2010 • No. 340 19
- 20. Figure 20 Retiree Confidence in Institutions Very Confident Somewhat Confident 2010 27% 50% 77% Private employers 2009 NA 2010 22% 45% 68% Banks 2009 27% 51% 78% 2010 13% 42% 55% Insurance companies 2009 11% 56% 66% 2010 8% 30% 38% The federal government 2009 11% 45% 56% Source: Employee Benefit Research Institute and Mathew Greenwald & Associates, Inc., 2009–2010 Retirement Confidence Surveys. Figure 21 Reported Offer and Take Up of Employer-Sponsored Retirement Savings Plans, Among Employed Workers Percentage of Employed Percentage of Workers Offered Workers Offered Plan Plan Who Contribute 82% 82% 81% 78% 79% 77% 78% 76% 73% 71% 66% 59% If yes 1996 2001 2005 2008 2009 2010 1996 2001 2005 2008 2009 2010 Source: Employee Benefit Research Institute and Mathew Greenwald & Associates, Inc., 1996–2010 Retirement Confidence Surveys. ebri.org Issue Brief • March 2010 • No. 340 20
- 21. Employer-sponsored retirement savings plans may be among the most effective vehicles available for encouraging workers to save for retirement. While the RCS does not distinguish how much money is saved in each type of savings vehicle, workers who currently participate in this type of plan are almost three times as likely as those who do not participate to report total savings and investments of at least $50,000 (56 percent vs. 19 percent). Furthermore, workers are more likely to report they have money in an employer-sponsored retirement plan with a current or previous employer (57 percent) than to say they have an individual retirement account or IRA (including a rollover IRA) (46 per- cent). While many policymakers consider it to be desirable to limit access to the money contributed to retirement savings plans so that plan money lasts as long as possible and is not depleted before retirement, only a minority of workers favor changes in the way withdrawals are allowed from these accounts to help ensure lifetime income. Thirty-eight percent of workers say they favor requiring individuals to use $100,000 or half of their plan money, whichever is less, to purchase a product at retirement that will pay guaranteed income each month for life. Fewer, 32 percent, favor requiring workers to take their money in a series of withdrawals at retirement rather than withdrawing all of the money at one time. Only about one-quarter each favor changing employer-sponsored retirement savings plans so that workers could not withdraw any money at all until they reach age 66 or leave their job, whichever comes sooner (28 percent), could not take a loan against the money in the plan (25 percent), and could not make a hardship withdrawal (21 percent) (Figure 22). Figure 22 Favor/Oppose Changes to Withdrawals Permitted From Employer-Sponsored Retirement Savings Plans, Among Workers Strongly Favor Somewhat Favor Somewhat Oppose Strongly Oppose Don't Know/Refused Workers had to use $100,000 or half of their plan money, whichever is 12% 26% 23% 33% 7% less, to purchase an annuity Workers had to take money in a series of withdrawals and could not 11% 21% 26% 39% 4% withdraw all of the money at once Workers could not withdraw any money at all until they reach 12% 16% 27% 41% 4% age 66 or leave their job Workers could not take a loan 10% 15% 29% 40% 6% against their money in the plan Workers could not make a 9% 12% 25% 48% 6% hardship withdrawal Source: Employee Benefit Research Institute and Mathew Greenwald & Associates, Inc., 2010 Retirement Confidence Survey. Workers who have household income under $35,000 (compared with higher-income workers), have less than $25,000 in savings and investments (compared with those who have more), or have not done a retirement savings needs calculation (compared with those who have) are more likely to support changes requiring individuals to purchase a guaranteed-income product and take their money in a series of withdrawals rather than all at one time. This might be because they recognize they will have difficulty managing the money. Generally, those with higher income or assets think they can manage their resources without a problem. ebri.org Issue Brief • March 2010 • No. 340 21
- 22. Retirement Savings Needs Many workers continue to be unaware of how much they need to save for retirement. Less than half of workers (46 percent) report they and/or their spouse have tried to calculate how much money they will need to have saved by the time they retire so that they can live comfortably in retirement. This is comparable to the percentages measured from 2003–2009, but is lower than the high of 53 percent recorded in 2000 (Figure 23). Figure 23 Workers Having Tried to Calculate How Much Money They Need to Save for a Comfortable Retirement Respondent Respondent and/or Spouse 53% 44% 47% 44% 46% 43% 42% 42% 42% 43% 38% 51% 39% 37% 32% 32% 32% 1993 1995 2000 2001 2002 2003 2004 2005 2006 2007 2008 2009 2010 Source: Employee Benefit Research Institute and Mathew Greenwald & Associates, Inc., 1993–2010 Retirement Confidence Surveys. The likelihood of doing a retirement savings needs calculation increases with household income, education, and financial assets. In addition, married workers (compared with unmarried workers), those age 35 and older (compared with those age 25–34), retirement savers (compared with nonsavers), and participants in a defined contribution plan (compared with nonparticipants) more often report trying to do a calculation. Instead of doing a systematic retirement needs calculation, workers often guess at how much they will need to accumulate. In the 2009 RCS, 44 percent of workers reported they determined the amount they needed to save by guessing, including 14 percent of those who report having done a calculation. Approximately 2 in 10 each report doing their own estimate (26 percent) and asking a financial advisor (18 percent). Others read or hear how much is needed (9 percent), use an online calculator (7 percent), or fill out a worksheet or form (5 percent) (Figure 24). The propensity to guess or do their own calculation may help to explain why the amounts that workers say they need to accumulate for a comfortable retirement appear to be rather low. Twenty-nine percent of workers say they need to save less than $250,000, and another 17 percent mention a goal of $250,000–$499,999. Twenty-four percent think they need to save $500,000–$999,999, while about 1 in 10 each believe they need to save $1 million–$1.49 million (8 percent) or $1.5 million or more (9 percent). However, savings goals tend to increase as household income rises (Figure 25). ebri.org Issue Brief • March 2010 • No. 340 22
- 23. Figure 24 Method of Determining Savings Needed for Retirement, by Doing a Retirement Needs Calculation (multiple responses accepted) 44% Guess 14 % 70 % 26 % Do yo ur own estim ate 46 % 10% 18 % Ask a financial advisor 33% 5% 9% Read or h ear that is h ow much n eed ed 9% 9% 7% Use an o nline calcu lator 1 6% <.5% 5% Fill out a worksheet o r form 11 % 0% All worke rs 2% Did c alcula tion Ad vice of family or frien ds 1% 3% Did not do c alcula tion So urce: Empl oyee Be nefit R esea rch Ins titute an d Mathew Green wald & Associa te s, Inc., 201 0 Retireme nt C onfid ence Su rvey. Figure 25 Amount of Savings Workers Think They Need for Retirement, by Household Income All Workers Less than $35,000 $35,000-$74,999 $75,000 or More 50% 29% 30% 27% 26% 23% 24% 20% 20% 17% 16% 14% 13% 13% 13% 13% 9% 8% 9% 8% 5% 6% 4% 6% Under $250,000 $250,000- $500,000- $1,000,000- $1,500,000 or Don't know/Don't $499,999 $999,999 $1,499,999 more remember Source: Employee Benefit Research Institute and Mathew Greenwald & Associates, Inc., 2010 Retirement Confidence Survey. ebri.org Issue Brief • March 2010 • No. 340 23
- 24. Workers who have done a retirement savings needs calculation also tend to have higher savings goals than do workers who have not done the calculation. Twenty-eight percent of workers who have done a calculation, compared with just 8 percent of those who have not, estimate they need to accumulate at least $1 million for retirement. At the other extreme, 19 percent of those who have done a calculation, compared with 39 percent who have not, think they need to save less than $250,000 for retirement. The savings goals cited by workers who have done a retirement needs calculation have increased over time. In the 2000 RCS, 31 percent said they needed to accumulate at least $500,000 for retirement. This percentage increased to 43 percent in 2005 and again to 54 percent in 2010 (Figure 26). Figure 26 Amount of Savings Workers Think They Need for Retirement, Among Those Doing a Retirement Savings Needs Calculation 2000 2005 2008 2009 2010 43% 26% 24% 25% 25% 23% 21% 21% 19% 17% 18% 16% 16% 16% 15% 14% 13% 13% 13% 12% 12% 12%11% 12% 13% 11% 11% 11% 10% 7% Under $250,000- $500,000- $1,000,000- $1,500,000 Don't Know/ $250,000 $499,999 $999,999 $1,499,999 or more Refused Source: Employee Benefit Research Institute and Mathew Greenwald & Associates, Inc., 2000–2010 Retirement Confidence Surveys. Despite this, workers who have done a retirement needs calculation are more likely than those who have not to feel confident that they will be able to accumulate the amount they need for retirement. Twenty-five percent of those who have done a calculation report they are very confident that they will be able to accumulate the amount they need, compared with just 11 percent of those who have not done a calculation. At the other extreme, only 15 percent of those who have done a calculation are not at all confident they will reach their goal, compared with 24 percent of those who have not done a calculation. Overall, 18 percent of workers are very confident, 38 percent are somewhat confident, and 44 percent are not too or not at all confident that they will be able to accumulate the amount they need by the time they retire (Figure 27). The RCS provides little support for speculation that workers who do a retirement savings calculation are discouraged by the results. Those who have done a retirement needs calculation continue to be more likely than those who have not to say they are very confident about having enough money for a comfortable retirement (22 percent vs. 10 percent). Moreover, those who think they need to accumulate at least $1 million in retirement savings are six times as likely as those who think they need less than $250,000 to be very confident (36 percent vs. 6 percent). ebri.org Issue Brief • March 2010 • No. 340 24