
Recomendados
Recomendados
Mais conteúdo relacionado
Último
Último (20)
Destaque
Destaque (20)
Indian Defense Industry Market Attractiveness, Competitive Landscape and Forecasts to 2018
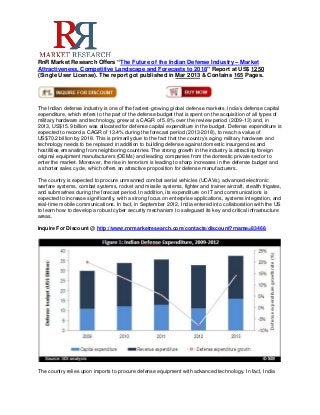
- 1. RnR Market Research Offers “The Future of the Indian Defense Industry – Market Attractiveness, Competitive Landscape and Forecasts to 2018” Report at US$ 1250 (Single User License). The report got published in Mar 2013 & Contains 165 Pages. The Indian defense industry is one of the fastest-growing global defense markets. India’s defense capital expenditure, which refers to the part of the defense budget that is spent on the acquisition of all types of military hardware and technology, grew at a CAGR of 5.8% over the review period (2009-13) and, in 2013, US$15.9 billion was allocated for defense capital expenditure in the budget. Defense expenditure is expected to record a CAGR of 13.4% during the forecast period (2013-2018), to reach a value of US$70.2 billion by 2018. This is primarily due to the fact that the country’s aging military hardware and technology needs to be replaced in addition to building defense against domestic insurgencies and hostilities emanating from neighboring countries. The strong growth in the industry is attracting foreign original equipment manufacturers (OEMs) and leading companies from the domestic private sector to enter the market. Moreover, the rise in terrorism is leading to sharp increases in the defense budget and a shorter sales cycle, which offers an attractive proposition for defense manufacturers. The country is expected to procure unmanned combat aerial vehicles (UCAVs), advanced electronic warfare systems, combat systems, rocket and missile systems, fighter and trainer aircraft, stealth frigates, and submarines during the forecast period. In addition, its expenditure on IT and communications is expected to increase significantly, with a strong focus on enterprise applications, systems integration, and real-time mobile communications. In fact, in September 2012, India entered into collaboration with the US to learn how to develop a robust cyber security mechanism to safeguard its key and critical infrastructure areas. Inquire For Discount @ http://www.rnrmarketresearch.com/contacts/discount?rname=83468 The country relies upon imports to procure defense equipment with advanced technology. In fact, India
- 2. currently procures approximately 70% of its military equipment from abroad, but the government's aim to reverse this balance and manufacture 70% or more of its defense equipment needs in India offers an immense opportunity for both domestic and foreign companies in the sector. Of the respondents from Asia-Pacific who participated in the SDI Business Outlook Survey 2012, 73% cite India as a country having the maximum defense opportunities in the next five years. Key Features and Benefits - The report provides detailed analysis of the current industry size and growth expectations from 2014 to 2018, including highlights of key growth stimulators, and also benchmarks the industry against key global markets and provides a detailed understanding of emerging opportunities in specific areas. - The report includes trend analysis of imports and exports, together with their implications and impact on the Indian defense industry. - The report covers five forces analysis to identify various power centers in the industry and how these are expected to develop in the future. - The report allows readers to identify possible ways to enter the market, together with detailed descriptions of how existing companies have entered the market, including key contracts, alliances, and strategic initiatives. - The report helps the reader to understand the competitive landscape of the defense industry in India. It provides an overview of key defense companies, both domestic and foreign, together with insights such as key alliances, strategic initiatives, and a brief financial analysis. Buy a Report Copy @ http://www.rnrmarketresearch.com/contacts/purchase?rname=83468 Table of Content 1 Introduction 1.1. What is this Report About? 1.2. Definitions 1.3. Summary Methodology 1.4. SDI Terrorism Index 1.5. About Strategic Defence Intelligence 2 Executive Summary 3 Market Attractiveness and Emerging Opportunities 3.1. Defense Market Size Historical and Forecast 3.1.1. India's total defense expenditure to grow at a CAGR of XX% over the forecast period 3.1.2. Hostile neighbors and modernization initiatives will be the industry's primary growth drivers 3.1.3. Defense budget as a percentage of GDP will remain at an average of XX% over the forecast period 3.2. Analysis of Defense Budget Allocation 3.2.1. Capital expenditure allocation expected to remain at an average of XX% during the forecast period 3.2.2. Army gets the largest share of the defense budget 3.2.3. Defense ministry will spend US$XX billion on its army over the forecast period 3.2.4. Defense ministry will spend US$XX billion on its air force over the forecast period 3.2.5. Expenditure for the navy is expected to grow at a CAGR of XX% over the forecast period 3.3. Homeland Security Market Size and Forecast 3.3.1. India's Homeland security market estimated at US$XX billion for 2013 3.3.2. Cross-border terrorism and domestic insurgency to be the main factors driving homeland security 3.3.3. India falls under "worst affected" of terrorism category 3.3.4. India has terrorism index score of 5.1 3.4. Benchmarking with Key Global Markets 3.4.1. India's defense budget expected to grow at a CAGR of XX%, which is one of the largest among the key global defense spenders
- 3. 3.4.2. The US and China dominate the global defense industry 4 Defense Procurement Market Dynamics 4.1. Import Market Dynamics 4.1.1. India was the largest arms importer during 2007-2011 4.1.2. Russia dominates Indian arms imports 4.1.3. Aircraft accounted for the majority of defense imports during 2007-2011 4.2. Export Market Dynamics 4.2.1. India's low profile in defense exports is set to change over the forecast period 4.2.2. Underdeveloped nations across Asia, Africa and Latin America are the main importers of Indian defense goods 5 Industry Dynamics 5.1. Five Forces Analysis 5.1.1. Bargaining power of supplier: low to high 5.1.2. Bargaining power of buyer: high 5.1.3. Barrier to entry: medium to high 5.1.4. Intensity of rivalry: high 5.1.5. Threat of substitution: medium to high 6 Market Entry Strategy 6.1. Market Regulation 6.1.1. Defense Procurement Procedure (DPP) - 2011: A significant improvement 6.1.2. Offset policy to drive defense industrial modernization 6.1.3. Main features of revised Defense Offset Guidelines (DOG) - 2012 6.1.4. Private sectors permitted to produce arms and ammunition under the new Draft Arms and Ammunitions Manufacturing Policy (DAAM) 6.1.5. Payment to foreign technology partners does not require governmental approval 6.1.6. Foreign direct investment limited to XX% in the Indian defense sector 6.2. Market Entry Route 6.2.1. Foreign OEMs are forming joint ventures in order to enter the market 6.2.2. India emerges as a key outsourcing hub for global defense companies 6.3. Key Challenges 6.3.1. Offset policy with restricted FDI of XX% is biased towards the domestic public and private sectors 6.3.2. Insufficient information and transparency on future plans 6.3.3. Bureaucracy, corruption, and long project delays 6.3.4. Developing advanced low-cost solutions is essential to gain market share 7 Competitive landscape and Strategic Insights 7.1. Competitive landscape Overview 7.1.1. Domestic public companies have a strong presence in the Indian defense industry 7.2. Key Foreign Companies 7.2.1. Lockheed Martin Corporation - overview 7.2.2. Lockheed Martin Corporation - main products 7.2.3. Lockheed Martin Corporation - recent announcements and strategic initiatives 7.2.4. Lockheed Martin Corporation - alliances 7.2.5. Lockheed Martin Corporation - recent contract wins 7.2.6. BAE Systems Plc. - overview 7.2.7. BAE Systems Plc. - main products and services 7.2.8. BAE Systems Plc. - recent announcements and strategic initiatives 7.2.9. BAE Systems Plc. - alliances 7.2.10. BAE Systems Plc. - recent contract wins 7.2.11. Thales - overview 7.2.12. Thales - main products and services 7.2.13. Thales - recent announcements and strategic initiatives 7.2.14. Thales - alliances
- 4. 7.2.15. Thales - recent contract wins 7.3. Key Public Sector Companies 7.3.1. Mazagon Docks Limited - overview 7.3.2. Mazagon Docks Limited - main products and services 7.3.3. Mazagon Docks Limited - recent announcements and strategic initiatives 7.3.4. Mazagon Docks Limited - alliances 7.3.5. Mazagon Docks Limited - recent contract wins 8 Business Environment and Country Risk 8.1. Demographics and Social Statistics 8.1.1. Population - Total rural population 8.1.2. Population - Total urban population 8.1.3. Population - Number of Households 8.2. Economic Performance 8.2.1. GDP Per Capita, USD 8.2.2. GDP (current USD Billion) 8.2.3. Exports of goods and services (current USD Billion) 8.2.4. Imports of goods and services (current USD Billion) 8.2.5. Gross National Disposable Income (USD Billion) 8.2.6. Manufacturing Output (USD Billion) 8.2.7. Consumer Price Index 8.2.8. Wholesale Price Index 8.2.9. LCU per USD (period average) 8.2.10. LCU per EUR (period average) 8.2.11. Lending Rate (%) 8.2.12. Real Interest Rate (%) 8.2.13. Market Capitalization of Listed Companies (USD Billion) 8.2.14. Market Capitalization of Listed Companies (% of GDP) 8.2.15. Total Government Cash Surplus/Deficit (LCU Billion) 8.2.16. Total Government cash surplus/deficit as % of GDP (LCU) 8.2.17. Central Government Debt (LCU Billion) 8.2.18. Central Government Debt as a percentage of GDP (LCU) 8.2.19. Goods exports as a percentage of GDP 8.2.20. Goods imports as a percentage of GDP 8.2.21. Goods balance as a percentage of GDP 8.2.22. Services imports as a percentage of GDP 8.2.23. Services Exports as a percentage of GDP 8.2.24. Services balance as a percentage of GDP 8.2.25. Foreign direct investment, net (BoP, current US$ Billion) 8.2.26. Net Foreign direct investment as a percentage of GDP 8.2.27. International reserves, including gold (USD Billion) 8.2.28. External Debt (USD Billion) 8.2.29. External debt as percentage of GDP 8.3. Energy and Utilities 9 Appendix 9.1. About SDI 9.2. Disclaimer For more details contact Mr. Priyank Tiwari: sales@rnrmarketresearch.com / +18883915441 Website: http://www.rnrmarketresearch.com/