Integrating Lean Manufacturingand Six Sigma The Challengesand Benefits Garcia Lawton
•
2 gostaram•1,098 visualizações

The document discusses integrating Six Sigma and Lean manufacturing techniques. It provides an overview of Lean, which focuses on eliminating waste to reduce lead times, and Six Sigma, which aims to reduce process variation. Both approaches are needed to maximize benefits. The document outlines some challenges to integrating the two approaches and provides examples of how to effectively combine Lean and Six Sigma tools and methods through a joint implementation strategy and culture.

Recomendados
Recomendados
Mais conteúdo relacionado
Mais procurados
Mais procurados (19)
Destaque
Destaque (11)
Semelhante a Integrating Lean Manufacturingand Six Sigma The Challengesand Benefits Garcia Lawton
Semelhante a Integrating Lean Manufacturingand Six Sigma The Challengesand Benefits Garcia Lawton (20)
Último
Último (20)
Integrating Lean Manufacturingand Six Sigma The Challengesand Benefits Garcia Lawton
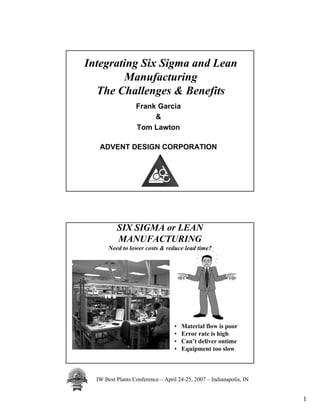
- 1. Integrating Six Sigma and Lean Manufacturing The Challenges & Benefits Frank Garcia & Tom Lawton ADVENT DESIGN CORPORATION SIX SIGMA or LEAN MANUFACTURING Need to lower costs & reduce lead time? • Material flow is poor • Error rate is high • Can’t deliver ontime • Equipment too slow IW Best Plants Conference – April 24-25, 2007 – Indianapolis, IN 1
- 2. Six Sigma or Lean Manufacturing? LEAN MANUFACTURING: Reduce Lead Time by eliminating waste in the Value Stream Provides the Game Plan and Plays SIX SIGMA: Reduce process variation Provides the Play by Play Analysis and Instant Replay Six Sigma or Lean Manufacturing? LEAN MANUFACTURING: Flow Focused Lean cannot bring a process under statistical control SIX SIGMA: Problem Focused Can not dramatically improve process speed or reduce invested capital NEED BOTH! IW Best Plants Conference – April 24-25, 2007 – Indianapolis, IN 2
- 3. Integrating Six Sigma with Lean Manufacturing Increases customer satisfaction Improves profitability & competitive position Has historical integration problems Requires a different system model Requires implementation & sustaining plans Lean Manufacturing System Goals are Highest quality Lowest cost Shortest lead time Achieved by eliminating waste in the value stream Industry benchmark: Toyota Production System (TPS) TPS is applied I.E. and common sense Principle: organization supports the value adder IW Best Plants Conference – April 24-25, 2007 – Indianapolis, IN 3
- 4. Value -Added Definition of Value is added any time the product is physically changed towards what the customer is intending to purchase. Value is also added when a service is provided for which the customer is willing to pay (i.e. design, engineering, etc.). If we are not adding value, we are adding cost or waste. 90% of lead time is non-value added! Value Stream The value stream is the set of all the specific actions required to bring a specific product (good or service) through the critical management tasks of any business: 1. Information Management 2. Transformation IW Best Plants Conference – April 24-25, 2007 – Indianapolis, IN 4
- 5. The EIGHT Wastes Inventory (more than one piece flow) Overproduction (more or sooner than needed) Correction (inspection and rework) Material Movement Waiting Motion Non-Value Added Processing Underutilized People Six Sigma System A defined management process and CTQ goal (3.4 ppm) 3 sigma is 66,807 ppm! Driven from the top Focused on Voice of the Customer A data analysis and problem solving methodology Strong focus on variation reduction Supported by highly trained problem solvers IW Best Plants Conference – April 24-25, 2007 – Indianapolis, IN 5
- 6. Uncovering Quality’s Hidden Costs Traditional (Tip of the Iceberg) 5 to 8 % 15 to 20 % Warranty Scrap Rejects Rework Late Delivery Lost Engineering Change Orders Opportunities More Set-ups Long Cycle Times Lost Sales Expediting Costs Excess Inventory Excessive Material Orders/Planning Working Capital Allocations Additional Costs of Poor Quality Six Sigma Variation Reduction Process Variation Should be Less Than Specs Variation Reduction is Cost Reduction IW Best Plants Conference – April 24-25, 2007 – Indianapolis, IN 6
- 7. Six Sigma’s (σ) Focus: Reducing Variance “ You have heard us talk about Reducing span, the “evil” variance our the variance customers feel in our response provides to their requests for better delivery, service or control of financing.” the process. A process mean tells us how the process is performing while the variance gives us an indication of process control. What is Six Sigma (σ) Quality? Population mean (µ) One (1) σ represents or average 68% of the population Two (2) σ represents 95% of the population Six (6) σ represents 99.999997% of With 6 σ Quality, approximately 3.4 items in a the population population of 1,000,000 items would be unacceptable. IW Best Plants Conference – April 24-25, 2007 – Indianapolis, IN 7
- 8. Six Sigma System Improving Profitability A 1 Sigma Improvement Yields….. 20% margin improvement 12 to 18% increase in capacity 12% reduction in number of employees 10 to 30% reduction in capital Source: Six Sigma - Harry & Schroeder Six Sigma Financial Impact Areas: The Savings Categories Cost Reduction (including 1. cost at standard and costs not included in standard cost) Cost Avoidance (can be 2. difficult to document) Inventory Reduction 3. Revenue Enhancement 4. Receivables Reduction 5. IW Best Plants Conference – April 24-25, 2007 – Indianapolis, IN 8
- 9. Six Sigma System A culture characterized by….. Customer centricity: What do they value? Financial results Management engagement & involvement Resource commitment: 1 to 3% of staff full time Execution infrastructure: black & green belts, teams Six Sigma Problem Solving Steps Process Breakthrough Define & Measure Strategy Validate Data Collected Characterization Analyze Vital Few Factors For Root Cause of Problem Improve Identify appropriate operating conditions Optimization Control Sustain - Insure Results to Bottom Line IW Best Plants Conference – April 24-25, 2007 – Indianapolis, IN 9
- 10. The DMAIC Cycle Six Sigma In Action SDCA Measure & Plan-Do-Study-Act Define Teams Analyze Benchmark Analysis tools Management ID variability SDCA Commitment Employee Involvement Improve Design of Control Plan-Do-Study-Act Experiments SDCA = Standardize-Do-Check-Adjust Six Sigma Tools Check Sheets: Checklists of what is to be accomplished,etc.. Scatter Diagrams: A graphical representation between two measurements (variables). Fishbone or Cause and Effect Diagrams: Provides a starting point for problem analysis. Problems are diagrammed into categories of Machinery, Material, Methods and Labor (Manpower). Pareto Charts: A method for organizing errors based on the number of errors created by a particular attribute (ex. Machine, Supplier, Product, Individual, etc.). IW Best Plants Conference – April 24-25, 2007 – Indianapolis, IN 10
- 11. Six Sigma Tools Process Maps or Flowcharts: Graphical representation of a process or system showing process or product transformation. In other words, what is being done, by who and what choices are being made. Ideally process maps should include cycle times, defect information, etc. X-Y Matrix: A ranking method used to prioritize process inputs (X’s) to process outputs (Y’s). FMEA’s (Potential Failure Mode and Effects Analysis): A detailed document which identifies ways in which a process or product can fail to meet critical requirements. Six Sigma Tools - Process Maps or Flowcharts What are the X’s (Input variables) at each process step? What are the Y’s (Output Variables) at each process step? Remember Y = f (x) Remember Valued Added versus Non-Value Added Remember Cycle Times and Defects IW Best Plants Conference – April 24-25, 2007 – Indianapolis, IN 11
- 12. Traditional Six Sigma Implementation- Who is Involved Technical Trainers, Mentors: Black Belts Full-Time Commitment Project Leaders- Full-Time Senior Management Commitment Master Green Belts Champions and Leaders Black Belts Project Leaders- Provides direction, removes Part-Time obstacles, reviews progress Commitment The Bad News: Six Sigma Program: Implementation Issues Some of the facts: 80% of Six Sigma Implementations fail. Traditional Six Sigma implementations have largely been attempted at large Fortune 500 Companies due to the large investment in people, training and overall support. Training costs alone for a “wave” of 25 people can cost $250,000 for this 4 to 6 month training period. Training costs and personnel requirements can overwhelm many smaller organizations. IW Best Plants Conference – April 24-25, 2007 – Indianapolis, IN 12
- 13. Need for Six Sigma & Lean External - Satisfying Customers….. Quality, Warranty, and Cost Customers Require Six Sigma Customers Require Lean Manufacturing Competitors are implementing Lean & Six Sigma Staying in business Need for Six Sigma & Lean Internal - Improving Profitability through….. Operational Cost Reduction Improve Productivity Reduce Scrap and Rework Reduce Inventory & WIP Engineering Design Cost Reduction Define-Measure-Analyze-Design-Verify (DMADV) Stabilize & Quantify Process Capability Input for Product and Design Process IW Best Plants Conference – April 24-25, 2007 – Indianapolis, IN 13
- 14. You Can Apply Six Sigma Techniques to Complement Existing Lean Capabilities Lean Training & Implementation VSM Six Sigma Analysis, Lean Waste Process Problem Techniques Reduction variation Solving & Training Inventory Reduction & Control Supply Chain Management Lean Six Sigma Implementation Historical Implementation Problems Only Six Sigma or Lean Implemented - big $ savings but money left on the table Separate Six Sigma & Lean initiatives competing for best resources Difficulty in sustaining the gain IW Best Plants Conference – April 24-25, 2007 – Indianapolis, IN 14
- 15. Lean Six Sigma Implementation Some Solutions……. Need to implement in the correct order Policy deployment to align business objectives (Flow, Waste & Variation Reduction) Focus on shop floor results, not class room skills Experienced teachers & coaches Standardized work to institutionalize the gains The Lean Six Sigma Strategy Lean 6σ is a CHANGE STRATEGY for accelerating improvements in processes, products, and services to improve a company’s performance leading to improved financial performance and competitiveness of the organization. Goals: Improved Customer Satisfaction Increased Profits Improved Process Capability by Reducing Variance Increased Market Share Support Continuous Improvement Sustained Gains for Completed Projects IW Best Plants Conference – April 24-25, 2007 – Indianapolis, IN 15
- 16. Lean and the 6 σ Structure FULL TIME COMMITMENT Problem solver, Teacher, Mentor. Expert in use of the tools M.B.B Black Problem solver,Proficient with tools Belt Problem solver, assists Black Belt. Yellow and Working Knowledge of tools 25-50% Green Belt Functional 6Sigma Team Member. Familiar with tools Problem Solving Problem Solving Team Members LEAN Manufacturing Waste reduction and Practices Continuous Improvement Training Costs- up to $2,500 Week (excludes lodging, travel and salary) Why Not Rent a Belt (Black, Yellow or Green) Pay for only What You Need to Solve Real Business Problems? Easier for Small Business to Justify Focused on Solving Companies’ Problems Joint Problem Solving and Knowledge/Skill Transfer Easier to Meet Customer Mandates to Use Lean Six Sigma Techniques Provides Evolutionary Approach to Lean/Six Sigma Implementation and Training IW Best Plants Conference – April 24-25, 2007 – Indianapolis, IN 16
- 17. How Do We Use Lean Six Sigma Techniques Get Management commitment Assess the operation & understand the Process using a Value Stream Map (Product families & Production data) Identify lean improvements & kaizens without automation Implement lean improvements using VSM plan Identify processes requiring Six Sigma analysis Analyze, eliminate, and control variation Start the cycle again! The Lean Six Sigma Cycle VSM Commitment & Recommended Set Up Assessment Solutions Layout Cells Visual Continuous Improvement Variation Reduction Implementation Information DO IT! Plan Systems IW Best Plants Conference – April 24-25, 2007 – Indianapolis, IN 17
- 18. Understanding the Process: The 1st Step and Foundation of Lean Six Sigma Y = f(X) Output(s) are a function Input(s) The Lean Six Sigma process attempts to control the outputs by controlling the inputs (those Critical to Quality or CTQ’s) Value Stream Map An Assessment Tool The value stream map follows the production path from beginning to end and shows a visual representation of every process in the material and information flows Shows how the shop floor currently operates Foundation for the future state IW Best Plants Conference – April 24-25, 2007 – Indianapolis, IN 18
- 19. Using the Value Stream Mapping Tool product family current state Understanding how the shop floor currently operates. The foundation drawing for the future state. future state Designing a lean flow drawing plan and implementation Value Stream Map Concept Production Orders Orders Customers Suppliers Control Schedules I Process I Equipment Raw Finished Cycle Materials Goods Times Change Over Reliability Error Rate Lead Time File: VSM-A1 IW Best Plants Conference – April 24-25, 2007 – Indianapolis, IN 19
- 20. Value Stream Map (Current State) Orders Every 2 Weeks Production Control New Jersey Randomly Placed Andrea Aromatics Alanx Order as Needed Various Porcelain Orders (Various Sizes) (Scented Oils) (Shaped Stones) Customers (Round Stones) Average of 6,000 Stones per Day in Various Size Orders (8 to 20 case & 200 to 400 case range mainly) 30 Cans of Oil 59,000 Stones 50,000+ Stones Every 2 Weeks Every 2 Weeks Every 2 Months (via stringer) Bi- Weekly Daily Shipping Productio Orders n Daily Schedule Shipments Existing Work Cell Soak & Dry Packaging Labeling Cartoning Case Packing Shipping APAI Multiple Ameripack Manual Manual Automatic Batch Tanks Flow Packager I I I I I I Stapler up to 0 0 125 Cans of Oil 1 Operator 4290 1 Operator 1/2 Operator 1/2 Operator 90,504 1 Operator 250 20,640 Round Stones Stones Stones stones 49,000 Shaped Stones in WIP C/T = 25 - 65 min. C/T = 1 sec. C/T = 3 sec. C/T = 2 sec. C/T = 1 sec. C/O = 10 min. C/O = 5 min. C/O = 2 min. C/O = N/A C/O = N/A Rel. = 100% Rel. = 85% Rel. = 80% Rel. = 100% Rel. = 100% 11.6 Days 0.7 Days 15.1 days 27.4 Days Lead Time 65 minutes, 7 seconds 65 min. 7 seconds Value-Added Time Value Stream Map (Future State) Orders Every Week New Jersey Randomly Placed Production Control Andrea Aromatics Alanx Monthly Order Various Porcelain Orders (Various Sizes) (Scented Oils) (Shaped Stones) Customers (Round Stones) Average of 6,000 Stones per Day in Various Size Orders (8 to 20 case & 200 to 400 case range mainly) Bi-Weekly Production 12 to 16 Cans 30,000 Stones 25,000 Stones Schedule of Oil Once a Once a Week Once a Month (large Week (via stringer) orders) Daily Shipping Orders Daily Shipments 4 Cases Existing Work Cell Soak & Dry Packaging Labeling Cartoning Case Packing Shipping APAI Multiple Ameripack Manual Manual Automatic Batch Tanks Flow Packager I I I I I Stapler up to 0 0 75 Cans of Oil 1 Operator 4290 1 Operator 1/2 Operator 1/2 Operator 30,000 1 Operator 250 40,000 Round Stones Stones Stones stones 25,000 Shaped Stones in a supermarket in WIP type arrangement with stocking levels C/T = 25 - 65 min. C/T = 1 sec. C/T = 3 sec. C/T = 2 sec. C/T = 1 sec. by shape and scent C/O = 10 min. C/O = 5 min. C/O = 2 min. C/O = N/A C/O = N/A Rel. = 100% Rel. = 85% Rel. = 80% Rel. = 100% Rel. = 100% Increase 10.8 Days 0.7 Days 5.0 days 16.5 Days Lead Time Reliability 65 minutes, 7 seconds 65 min. 7 seconds Value-Added Time IW Best Plants Conference – April 24-25, 2007 – Indianapolis, IN 20
- 21. Questions to Ask About the Value Stream Is the step valuable? Is the step capable? Is the step available? Is the step adequate (capacity)? Is the step flexible? Lean Manufacturing Concepts & Techniques Flow: Setup Reduction, Cellular Manufacturing, Batch Size Reduction, Visual Workplace, Layout Pull: Kanban Systems, Supply Chain Management, Point of Use Perfection: Quality Systems including variation reduction, Training IW Best Plants Conference – April 24-25, 2007 – Indianapolis, IN 21
- 22. Road Map to Lean Six Sigma Lean to improve flow and reduce inventory & lead time Six Sigma for Process Variation in Value Stream Value Stream Map (Current State) Stamping Orders With No Plating or Heat Treatment (Potential Future State Changes in Red) Projected requirements Phosphor Bronze Omega Precision Beryllium Copper Randomly Placed Br ass (30%) Order as Needed Production Control Various ( 30%) Order s (Various Sizes) Vista S oftware S ystem (40%) 10 Week LT Customers 6 Mos. LT 4 Weeks LT 6 Weeks Reroll In Stock- 1 Week Review Work Formal Schedule with Average of Production Suppliers 1 mm pcs per day Control in Various Sizes Orders (2 to 13) Single Point of Control Ever y Week Ever y Week Every Week Weekly Production Weekly Shipping Schedule Pressroom List Manager Daily Shipments Average order = 208,000 pcs 252,000 strokes Pre-Control for Roll Changes Combine? •Lot Control Improvement Stamping •Handling Reduction Degreasing Packing Shipping Drying 10 to 24 coils 11 Stamping Manual 3 times /w eek Presses I I I I 1 unit Shipper 6 Operators 1 Operator 2 Baskets - Strip 50 to 70 20 to 40 Bins 1 Basket - Pieces 2 Hours 1 Day Racks to Run: 200-600pcs/min C/T = 2 Hr Strips 12 Weeks C/T = .003 min/pc. 100 to 125 Max 1000/Basket C/T =10 hr Auto Coils Min 200/Basket C/O = None Visual Status Bagging C/O = 4.5 hrs. = 30 Min Pcs. Rel. = 80% of Presses Standard T ime 25,000 Pcs/Basket for Setup Setup Layout is Available: 590 min/shift C/O = None Adjustment Time a Problem Rel. = 90% Rel. = 95% 16.75 Days Lead Time 10 Days 2 Days 1 Day to 12 Weeks Reduce Sankyo + coil lead time Cycle Time Coil Feeds per average order 1.5day(avg) 2.25 Days 3.75 Days Value Added Time Low Productivity Electrical Device Assembly The Challenge in Two Steps Client wanted wave soldering and robotic pick and place Functional operational layout Reject rate 5 to 8% Extensive material staging No space Initially, 13 people in Aurora cell Low output: 300 units/day IW Best Plants Conference – April 24-25, 2007 – Indianapolis, IN 22
- 23. Lean Six Sigma Techniques Used Process mapping Cellular Manufacturing & Layout Balance Cycle Times Between Work Stations Reduce Batch Size & parts staging Quality Data Collection & Analysis (Reduce Reject Rate) Cellular Assembly Layout IW Best Plants Conference – April 24-25, 2007 – Indianapolis, IN 23
- 24. Cell Changes WORKSTATION CYCLE TIME: 25sec., 1.25 min. REJECT PER 3 UNITS DATA 2 LED TEST SOLDER 7 SAMPLES & CUT 4 5 6 8 9 ATTACH BACK ASSEMBLY CONTACTS BUTTON & GLUE COVER, #1 ASSEMBLY BATTERY SWITCH/ PACK STAKE LED COLD STAKE & ASSEMBLY ATTACH 1 STRAP & PLACEMENT TEST PCBs SOLDER LABEL STRAP ATTACH STRAP INSERT REJECT LED TEST SWITCH SOLDER PCBs DATA ACTIVATOR & CUT 3 ASSIST REJECT DATA AFTER CHANGES WORKSTATION CYCLE TIME: 25sec., 1.25 min. PER 3 UNITS TEST 4 SAMPLES 1 2 3 5 6 ATTACH BACK ASSEMBLY CONTACTS BUTTON & GLUE PCBs from COVER, #1 ASSEMBLY BATTERY SWITCH/ PACK STAKE supplier COLD STAKE & ASSEMBLY ATTACH STRAP & TEST PCBs SOLDER LABEL STRAP ATTACH STRAP INSERT REJECT SWITCH DATA ACTIVATOR Lean Six Sigma Changes Cold staking fixtures Powered screw drivers Light test & Soldering fixtures Quality data tracking via % defect control chart (p chart) IW Best Plants Conference – April 24-25, 2007 – Indianapolis, IN 24
- 25. With Lean Six Sigma The Results Balanced cell at 24 sec per work station Two U-shaped cells 3 piece flow 1000 units/day per cell vs 300 6 people per cell vs 13 Faster identification of quality problems Operating at 5 to 6 sigma Better teamwork No backlog Reducing WIP & Improving Quality Wire Extrusion & Finishing The Challenge Client wanted to reduce WIP Reduce extrusion rejects (7% of footage) Eliminate material flow problems Improve data collection and analysis IW Best Plants Conference – April 24-25, 2007 – Indianapolis, IN 25
- 26. Lean Six Sigma Techniques Used Value Stream Mapping Cellular Manufacturing & Layout Kanban Trigger Board 5S Quality Data Collection & Analysis (Reduce Extrusion Reject Rate) With Lean Six Sigma The Results 50% reduction in raw material inventory 60% reduction in raw material storage area Doubling production output in same floor area Eliminating one production shift Better teamwork Reducing extrusion reject rate to <1% IW Best Plants Conference – April 24-25, 2007 – Indianapolis, IN 26
- 27. Reducing Lead Time & Improving Quality Steel Panel Fabrication The Challenge Client wanted to reduce lead time to less than one week Automated equipment had been installed but had problems Panel rejects & rework (5%) Material flow problems Few process controls or data collection Value Stream Map (Current State) Blanket Annual Purchase Order with Daily Releases Production Control Randomly Placed (normally working Various Distributors Orders (normally Sheet Galvanized Sheet Galvanized Sheet Galvanized Sheet Galvanized 24 to 48 hours ahead (~ 24 for Smith Corp. & single unit orders) Steel (4’ by 8’ or cut) Steel (4’ by 8’ or cut) Steel (4’ by 8’ or cut) Steel (4’ by 8’ or cut) of ~ 6 for Jones Systems promised shipment) Average volume of 1000 systems per month in peak season. Customers are mainly distributors. There are a few dealers. Daily Daily Up to an average Daily Production Production of 130,000 lbs Shipping Daily Reports Reports daily in peak Schedule Shipments season In Straight Panel Dept. Shear Notch Specialty Punch Corner Punch Bend Stake & Label Add Z Brace Rack Shipping Radius & Band 1 Accurshear 1 Manual 4 Semi-Auto 3 Semi-Auto 1 Manual 1 Automated 1 Automated 1 Manual Table, Automated Notcher (S-23) Punches Punches Brake (R-7) Machine (R-8) Machine (ACR) 1 Jig-less Shear (P-3) & 1 Automated (S-1, S-2, & S-3) & 1 Automated Machine (R12), I Notcher (R-3) Brake (R-13) & 1 Jig Machine (R1) 2 to 5 days 1 Material 1 Operator 1/2 Operator 0 Operators 1 Operator 1/2 Operator 1/2 Operator 1/2 Operator 2 Operators 2 Operators depending Handler on pre-cut size C/T = 4 min. C/T = 2 min. C/T = 2 min. C/T = 2 min. C/T = 5 min. C/T = 2 min. C/T = 7 min. C/T = N/A C/T = 8 min. C/O = N/A C/O = 4 min C/O = N/A C/O = up to C/O = 30 to C/O = N/A C/O = N/A C/O = N/A (average) Rel. = 99% Rel. = 95% Rel. = 99% 30 min. 60 sec. Rel. = 99% Rel. = 98% to Rel. = 100% C/O = 2 to 30 Rel. = 99% Rel. = 90% 99% min. Rel. = 80% 2 to 5 Working Days, to 100% Lead Time 2 to 5 days 32 minutes, 4 min. 2 min. 2 min. 2 min. 5 min. 2 min. 7 min. 8 min. Value-Added Time IW Best Plants Conference – April 24-25, 2007 – Indianapolis, IN 27
- 28. Lean & Six Sigma Techniques Used Value Stream Mapping Process flow diagrams Setup time Analysis Quality Data Collection & Analysis (Reduce Reject Rate & Variability) INITIAL IMPROVEMENT CONCEPTS Improve reliability and changeover capability of R1 and R12 machines. Reduce panel reject rate. Radius & Band Work to 1 to 2 days lead time 1 Manual Table, Rack 1 Jig-less Machine (R12), & 1 Jig Machine 1 Material (R1) Handler 2 Operators C/T = 8 min. C/T = N/A (average) C/O = N/A C/O = 2 to 30 Rel. = 100% min. Reject rate = 5% Rel. = 80% to 100% 2 to 5 Working Days, Lead Time 8 min. IW Best Plants Conference – April 24-25, 2007 – Indianapolis, IN 28
- 29. 6 Foot Long Custom Radius Panel Fabrication Trumpf Area Straight Panel Dept. Notch Panel & Punch Bend Add Z Brace(s) Material Raw (Trumpf & Stake (if required) Material Stock Machine) 14 Ga. Galvanized Steel (pre-cut 53-15/16” by 6’3-15/16” sheets) Radius & Band Label Rack Ship (R12 - Jigless Machine) WIP Stock 16 Different Panels with Various Cutouts Custom Panel Dept. Band Shear Material Raw & Cut Material Stock Partially finished panels are stocked in 11 Ga. Galvanized Steel sixteen different configurations. Panels (4’ by 8’ standard sheets) are finished to order. Work is done in three different areas as noted. UNDERSTANDING ROOT CAUSES of R12 PROBLEMS CAUSE AND EFFECT DIAGRAM Red = Most Important Causes SET UP VALUES CHANGE NO SPECS OPERATORS MEASUREMENT RADIUS TEMPLATE MAINTENANCE ACCURACY PANEL CHANGES SQUARENESS SETTINGS DIFFERENT SETUP PROCEDURES NO DIMENSIONAL SPECS OR TOLERANCES DIFFERENT MEASURES USED ON OPEATOR OPERATOR R1 & R12 PREFERENCE JUDGEMENT RADIUS ANGLES NO TRUST NO SPECS DON'T MEET SEGMENT CURVATURE LENGTH TEMPLATE REQUIREMENTS AT MOUNTING SETUP WRONG (4' & 6' RADIUS DIGITAL READOUT PANEL WIDTH VARIES PANELS) USELESS SHEET DIMENSIONS 3 SUPPLIERS POOR TRANSDUCER BAD USE OF AIR vs. VARY SELECTION BEARINGS HYDRAULICS BANDS HAVE ON LOWER CAMBER FORMING INDEXES VARY TOOL GALVINIZED COATING INDEXES VARY DIFFERENT ON CRUDE INDEX INACCURATE POOR MAINT SYSTEM DESIGN CUTTING PANELS LOCATION PANEL OF SPECIALTY PUNCHES NOTCH O.D.SPACING VARIES SURFACE FINISH ON PANEL RADIUS VARIES .09 IN VARIES BACKING SHOE SIDE TO SIDE DIFFERENT ADJ.USTMENT. STEEL PROPERTIES PANEL NOTCH POSITION NO SPECS 3 SUPPLIERS VARIES PANELS CATCH AT AIR CYLINDER LAST 2 BENDS OPPOSING HYDRAULIC IN HEAD AIR PRESSURE LOW WIDTH OF STEEL BETWEEN ASSEMBLY NOTCHES VARIES 3.75 to 4.0 in. YIELD STRENGTH VARIES ACROSS RADIUS CONVEYOR NOT MAINTENANCE ADJUSTED EQUIPMENT PLATE THICKNESS NO SPECS PUNCH HOT VS COLD ROLL VARIES LOCATION PANEL NOT VARIES SQUARE. wIDTH 3 SUPPLIERS TOO LARGE NO SPECS DIFFERENT EQUIPMENT MATERIAL COATING USED (PANELS, STEEL) VARIES STRAIGHT PANEL 3 SUPPLIERS SPECIALTY PUNCH IW Best Plants Conference – April 24-25, 2007 – Indianapolis, IN 29
- 30. Process Improvements Separating Process & Machine Issues Common setup procedure Replace measurement gages Established process capability Implemented process controls for panel dimensions Identified realtime data requirements Completed identified maintenance actions Implemented PM program Why Lean Automation? “After implementing lean improvements such as cellular manufacturing and setup reduction, selective automation can add value and reduce human variability.” Richard Schonberger, June 2002 IW Best Plants Conference – April 24-25, 2007 – Indianapolis, IN 30
- 31. New Radius Bending Machine R13 • Automated band cutting • Servo driven adjustments from panel bar codes • Online radius measurement and tracking R13 Capabilities After Lean Six Sigma Operates as a cell Runs two product families Changeover in less than 5 sec. within and between product families Cycle time reduced from 5 min. to 1.8 min. Realtime auto check of each panel with data collection Operating at 6 sigma IW Best Plants Conference – April 24-25, 2007 – Indianapolis, IN 31
- 32. Lean Six Sigma in the Fast Lane! As lead time decreases………….. the need for realtime data increases! Automation Provides Realtime Data to Control Variation for Six Sigma Enhances Define-Measure- Analyze-Improve-Control methodology (DMAIC) Online measurement of Process Control process parameters Direct data input into control charts Provide realtime controls as control limits are understood IW Best Plants Conference – April 24-25, 2007 – Indianapolis, IN 32
- 33. R13 Process Controls & System Status Realtime Data Collection for Six Sigma Analysis Diagnostics for Rapid Identification of Problems Realtime Data From R13 Target Top Bot. Bend Bend Bend Bend Panel Panel Index Chord Chord Chord Delta Top Angle Angle Factor Factor Radius Length Cycle Count Height Height Height / Bot. Top Dev. Bot. Dev. Offset Factor Top Bot. (Feet) (Inches) Time Template Template V2022 V2030 V2046 V2066 V2032 V2050 V2070 V1610 V1612 V1614 V1616 V1706 V1710 V2014 Remarks Dev. Top Dev. Bot. 31 14.051 14.089 14.118 0.029 0.039 0.067 0.000 1.325 0.797 0.921 4.000 75.375 131.2 Log Data 1 14.051 14.593 14.898 0.305 0.543 0.848 0.000 1.325 0.795 0.951 4.000 75.375 139.5 formula 2 14.051 14.089 13.947 0.142 0.039 -0.104 0.000 1.325 0.781 0.880 4.000 75.375 132.9 general, using values from 3'R 3 14.051 14.008 13.748 0.259 -0.043 -0.302 0.000 1.325 0.781 0.880 4.000 75.375 131.7 4 14.051 14.014 13.803 0.211 -0.036 -0.248 0.000 1.325 0.781 0.880 4.000 75.375 131.6 5 14.051 13.960 13.652 0.307 -0.091 -0.398 0.000 1.325 0.781 0.885 4.000 75.375 132.4 6 14.051 14.055 13.844 0.211 0.005 -0.207 0.000 1.325 0.781 0.900 4.000 75.375 132.0 7 14.051 13.824 13.817 0.007 -0.227 -0.234 0.000 1.325 0.781 0.905 4.000 75.375 132.3 8 14.051 13.796 13.824 0.027 -0.254 -0.227 0.000 1.325 0.781 0.910 4.000 75.375 132.0 9 14.051 13.926 13.974 0.048 -0.125 -0.077 0.000 1.325 0.790 0.920 4.000 75.375 131.6 10 14.051 14.001 13.967 0.033 -0.050 -0.083 0.000 1.325 0.795 0.920 4.000 75.375 132.3 11 14.051 13.980 13.967 0.013 -0.070 -0.083 0.000 1.325 0.795 0.920 4.000 75.375 131.1 12 14.051 14.014 14.063 0.049 -0.036 0.013 0.000 1.325 0.795 0.920 4.000 75.375 131.3 13 14.051 13.980 13.960 0.020 -0.070 -0.090 0.000 1.325 0.795 0.920 4.000 75.375 130.9 14 14.051 14.137 14.214 0.077 0.086 0.163 0.000 1.325 0.800 0.925 4.000 75.375 132.6 15 14.051 14.117 14.173 0.056 0.066 0.122 0.000 1.325 0.800 0.925 4.000 75.375 129.2 16 14.051 14.137 14.152 0.015 0.086 0.102 0.000 1.325 0.800 0.925 4.000 75.375 131.0 17 14.051 14.103 14.118 0.015 0.052 0.067 0.000 1.325 0.798 0.922 4.000 75.375 133.0 18 14.051 14.089 14.097 0.008 0.039 0.047 0.000 1.325 0.798 0.922 4.000 75.375 131.4 19 14.051 14.178 14.104 0.074 0.127 0.054 0.000 1.325 0.798 0.922 4.000 75.375 131.0 20 14.051 14.144 14.173 0.029 0.093 0.122 0.000 1.325 0.797 0.921 4.000 75.375 132.6 21 14.051 14.130 14.104 0.026 0.079 0.054 0.000 1.325 0.797 0.921 4.000 75.375 131.0 22 14.051 14.076 14.097 0.022 0.025 0.047 0.000 1.325 0.797 0.921 4.000 75.375 130.9 23 14.051 14.123 14.070 0.053 0.073 0.019 0.000 1.325 0.797 0.921 4.000 75.375 3.9 24 14.051 14.069 14.043 0.026 0.018 -0.008 0.000 1.325 0.797 0.921 4.000 75.375 136.5 25 14.051 14.089 14.070 0.019 0.039 0.019 0.000 1.325 0.797 0.921 4.000 75.375 0.0 26 14.051 14.089 14.104 0.015 0.039 0.054 0.000 1.325 0.797 0.921 4.000 75.375 131.6 bands from stock, COE belt broken 27 14.051 14.096 14.022 0.074 0.045 -0.029 0.000 1.325 0.797 0.921 4.000 75.375 136.9 28 14.051 14.089 14.097 0.008 0.039 0.047 0.000 1.325 0.797 0.921 4.000 75.375 131.3 29 14.051 14.082 14.111 0.029 0.032 0.060 0.000 1.325 0.797 0.921 4.000 75.375 131.2 30 14.051 14.117 14.152 0.036 0.066 0.102 0.000 1.325 0.797 0.921 4.000 75.375 131.3 31 14.051 14.089 14.118 0.029 0.039 0.067 0.000 1.325 0.797 0.921 4.000 75.375 131.2 IW Best Plants Conference – April 24-25, 2007 – Indianapolis, IN 33
- 34. How Do We Use Lean Six Sigma Techniques Get Management commitment Assess the operation using a Value Stream Map (Product families & Production data) Identify lean improvements & kaizens without automation Implement lean improvements using VSM plan Identify processes requiring Six Sigma analysis Analyze, eliminate, and control variation Start the cycle again! Lean Six Sigma Methodology that maximizes shareholder value by achieving the fastest rate of improvement in….. Customer satisfaction Operating costs Process speed(lead time) Inventory & invested capital Quality Operating flexibility IW Best Plants Conference – April 24-25, 2007 – Indianapolis, IN 34
- 35. Contact Information Advent Design Corporation Canal Street and Jefferson Ave. Bristol, PA 19007 www.adventdesign.com 800-959-0310 Frank Garcia, Director Planning & Producttvity frank.garcia@adventdesign.com IW Best Plants Conference – April 24-25, 2007 – Indianapolis, IN 35