SlideShare uma empresa Scribd logo
1 de 10
Baixar para ler offline
International Journal of Humanities and Social Science Invention
ISSN (Online): 2319 – 7722, ISSN (Print): 2319 – 7714
www.ijhssi.org Volume 4 Issue 1 ǁ January. 2015 ǁ PP.92-101
www.ijhssi.org 92 | Page
Valuation of Environment: A Study on Willingness to Pay for
Improved Solid Waste Management in Paradip Town, Odisha
Economic
Simashree Subhadarsini
NCDS, Bhubaneswar
ABSTRACT : Economic valuation of environment is not an easy but controversial task. Because putting a
price tag on environment seems to be impossible. But economists are busy valuing everything in terms of money.
From economic point of view valuation studies are much more required now days to find out the priorities of the
people. Similarly this study has tried to find out how much value people put on a clean environment in terms of
their willingness to pay for improved waste management. This study uses a contingent valuation method to
estimate the willingness to pay of the households living in the township of Paradip Port Trust, Odisha. It also
uses a multiple linear regression model to find out the factors which influence the willingness to pay of the
households. The study reveals that almost 63% of the households are willing to pay which establishes a good
quantum of expected revenue from the public in the form of a fee or tax.
KEYWORDS: willingness to pay, waste, Paradip Port, waste management
I. INTRODUCTION
Environment and economic systems are closely interlinked. Basically environment provides four
services to the economy as a source of energy and inputs to production, as a source of amenity, as a provider of
global life support services and as a waste sink. But there is a limit to which environment can provide resources
and assimilate waste. This limit is known as carrying capacity of environment. But with the increase in
population this carrying capacity is adversely affected. There are so many reasons responsible for this ecological
imbalance. One of those reasons is waste generation and its management. This problem is more acute in
developing countries like India because waste generation is high in these countries due to high population.
Moreover the waste collection and disposal habits are also crude in developing countries. So it leads to problems
like accumulation of waste in open lands, in drains, in rivers etc. It also leads to pollution problems like air
pollution, water pollution, soil pollution etc. So there is a timely need for proper management of these waste
items. But in reality proper attention is not paid to this problem. Because normally developing countries are
more focused on developmental activities like creation of infrastructure, business expansion etc. So they neither
pay attention nor spend money on the issues like waste management. If we see from the other side then it is also
a fact that normally developing countries have financial constraint on their side that is why they can’t spend
much on the head like waste management. So it is the role of the society or the community to actively
participate and contribute towards the solution of the problem. If people place value on a clean environment but
the authority is unable to provide it due to financial constraint then it is the responsibility of the community
itself to pay for the solution of the problem. That means they should be willing to pay to overcome the money
problem. Here comes the role of community.
People’s participation in social and environmental activities is necessary to resolve such socially
undermining and environmentally degrading problems. In fact, tackling such a problem would require massive
investment schemes by local governments. However, the governments of developing nations usually suffer from
heavily burdened and stretched financial and economic resources and a high opportunity cost of funds.
Therefore, society’s participation is logically and realistically needed for widening infrastructure and
environmental service provisions. So households should pay for collection and disposal of waste. But how much
the households will pay that depends on how much value they place on environment. If an environmental good
is valued then households will be willing to pay more for it. This amount indicates their willingness to pay
(WTP). Hence WTP is the amount a person would be willing to pay to obtain a good or service. In the above
case households’ WTP measures the benefits to them of the increase in waste management quality. An objection
that could be made straightaway is that, if WTP is used as a measure of value to an Individual, then this measure
depends not just on their preferences but also on their income. A rich household, with the same preferences,
Valuation Of Environment: A Study…
www.ijhssi.org 93 | Page
could clearly afford to pay more than a poor household. Economic values based on WTP would
therefore always be biased in favor of the rich. Hence WTP concept is meaningless unless backed up by ability
to pay. At the level of the economy as a whole, we clearly cannot give up more than we actually have or expect
to earn. Avoiding the temptation of making the somewhat dubious assumption that the existing distribution of
income is optimal, we are therefore left with the position that value as measured by WTP, is a function of the
existing income distribution, and may change as this distribution changes.In recent years since waste
management is becoming unmanageable so most of the governments in various countries found it necessary to
engage the private sector in waste management. A willingness to pay study can generate data of interest to both
the government and the private sector. For the private sector, WTP can indicate the economic charges for waste
collection and disposal. One way the partnership between households and waste management authorities can be
forged is by first understanding the value households place on a clean environment. Therefore there is an urgent
need to motivate the households to contribute to activities such as waste collection. This paper aims at
estimating the value households place on a clean environment as well as the factors that determine the
household’s WTP for a clean environment.
II. OBJECTIVES
The objectives of the study are
 To assess the existing waste management practices in the study area,
 To estimate the WTP of households for improved waste management,
 To find out the factors those determine households’ WTP,
 To make policy recommendations for a sustainable waste management.
III. WASTE GNERATION IN PARADEEP
In recent years there has been mushroom growth of many slums within port area, like slums at
Sandhakud, Bangalipada, Noliasahi, Phandi Colony, Bhimabhoi colony etc. Most of the municipal solid waste
generated is coming from the above areas from all drains, roads, medicals, hotels and restaurant, fruits and
vegetable markets, fish and meat market, households, offices and shops and above all, the slums. Rapid
population growth, urbanization and industrial growth have led to severe problems of SWM. The management
of large quantity of solid waste requires proper system of collection, transportation and disposal, besides proper
knowledge of what the wastes are made up of, how they need to be collected and disposed off.
Basing upon the population and standard it is estimated that about 48.00 M.T. of solid waste is being generated
per day from various sectors like industry, household, market, commercial establishments and hospital waste
etc. There are three nos. of fish markets where quantity of waste generated is estimated to be 6 M.T. per day.
There are 3 hospitals with 70 beds, 17520 households, shops, offices, and other institutions around 30 nos.
THE WARD WISE ROAD LENGTHS FOR STREET SWEEPING
Figure 1
(Source: Detail Project Report by Paradeep Municipality on ICZM)
THE WARD WISE GENERATION OF SOLID WASTE
Valuation Of Environment: A Study…
www.ijhssi.org 94 | Page
Figure 2
(Source: Detail Project Report by Paradeep Municipality on ICZM)
The above figure shows quantity of solid waste generated by different wards. The horizontal axis shows the
ward number and vertical axis shows the generated waste amount.
IV. PRESENT PRACTICE OF SOLID WASTE MANAGEMENT AT PARADEEP
It is said that out of nothing comes nothing. Since Paradeep Municipality has already completed 25
years of its existence, it has done a lot of things on SWM. The collection, transportation of solid waste to the
dumping ground is the main thrust areas of the present practice Basing upon the population and standard it is
estimated that about 48 M.T. of solid waste is being generated per day from various sector like industry,
household, market, marine and hospital waste etc. Paradeep Municipality attaches highest priority to
conservancy, related to public health. It has employed 110 nos. full time and part time sanitary staffs for this
purpose to collect solid waste within a covered area of 32.40 Sq. Km. Besides this 7 nos. of vehicles have been
pressed into service i.e. one mini truck, one tipper, three tractor trailer, one J.C.B for lifting of solid waste and
carrying to the waste disposal point. Presently, central bins/ dust bins have been placed in residential, market
and commercial areas for dumping of wastes from households. Street sweeping is done through sweepers for
collection of solid waste. This is the prevalent practice of Collection of solid waste. 5 wards have been
privatized for collection and transportation of waste.Then the solid waste is transported to the dumping ground
at ward no. 10 in Bangalipada by dint of auto tippers, tractors, mini trucks, and dumpers from Central bins. They
are dumped at Landfill site at Bangalipada. At Bangalipada, a proposal was mooted to set up a processing plant
for disposal of garbage and MOU was signed with NGO VIKASH. The authorization had been also obtained
from State Pollution Control Board. The facility operated in about 2.00 acres of area. Both processing as well as
land filling is done in the same time. The wastes were mainly composted aerobically and rejects were sorted out.
The compost is dried and sieved and packed for sealing. The rejects were used for land filling. But inadequate
resources handicapped the project. Now, only dumping is done at Bangalipada.
SHORT COMINGS IN PRESENT PRACTICE
The routine and mechanical handling of solid waste suffer from numerous deficiencies such as institutional
weakness, lack of strategic planning, shortage of financial and human resources, inefficient managerial
practices, improper choice of technology etc. The service levels are far from satisfactory.
 Though wastes are collected through bun at source, most of the people have not abandoned the practice of
depositing it in open space, drains, main storm water drains, water channels etc. It poses a serious hazard
for health and sanitation.
 There is no system of door to door collection.
 The dust bins are not sufficient.
 No arrangement of primary collection from hotels and restaurants.
 Vegetable, fruit, fish markets do not have adequate storage facility.
 Concrete bins have been placed which are unhygienic and unscientific.
 Slum areas are not provided with adequate services.
Valuation Of Environment: A Study…
www.ijhssi.org 95 | Page
 The Municipality does not have adequate men power and machinery for solid waste disposal.
 The land fill site is only two acres which is inadequate.
 Monitoring and evaluation process is not efficient.
V. ANALYSIS OF DATA AND EMPIRICAL FINDINGS
SAMPLE DETAILS
This section discusses the empirical findings and interpretation of the survey data. The section is sub-
divided into two sections dealing with descriptive and regression analyses. For the descriptive analysis,
frequencies and cross tables were run to establish the relationship between willingness to pay and other socio-
economic variables. For the study, one hundred and ten households were interviewed. Sixty households from the
low income group, thirty six from the middle income group and fourteen from the high income group were
interviewed. A high proportion of households was interviewed from the low income category because most of
the people in Paradip Town belong to this category. To draw the sample firstly the study area was divided into
three different regions. In the study area residential facility has been geographically segregated depending upon
income. So in a particular region households belonging to a specific income group reside. But of course there
are exceptions. For example in this study, there are three regions. Region one or namely ‘Madhuban’ region
consists of households belonging to high income group. The second region namely ‘Nuabazar’ region consists
of households belonging to both middle income group and low income group. Because in that area both slums
and residential quarters are present. The region three or namely ‘Noliasahi’ is a slum area. So households
belonging to that region come under low income group.After dividing the study area into three regions,
secondary data was collected regarding the type and number of quarters in each region. The number of
households belonging to the slum area was also collected. Then number of households from each category to be
interviewed was determined through equal proportionate sampling. Then the sample units were interviewed
through structured questionnaire method. The detailed numbers of sample units from different type of quarters
are given below in the table.
Table I
List of Households (from quarters & Slums)
(Source: field survey results)
DESCRIPTIVE ANALYSIS OF DATA : In this section frequency distribution tables and cross-tables were
drawn to establish the relationship between willingness to pay and other socio-economic variables such as
income, years of schooling or educational level, gender and household size. These results are shown in the
following tables.
Willingness to pay vs. Income level
Table II
Income groups
Answers
High Income Middle
Income
Low Income Total
Number % Numb
er
% Number % Number %
Willing to pay 12 86 27 75 28 47 67 61
Unwilling to pay 2 14 9 25 32 53 43 39
Total 14 100 36 100 60 100 110 100
(Source: field survey results)
Income
group
Type of quarter with total
number
Units drawn as sample
units(1% of total)
Total number
of sample units
High ‘D’ Type-71
‘C’ Type-402
‘3R-B’ type-952
‘D’ Type-1
‘C’ Type-4
‘3R-B’ Type-9
14
Middle ‘2R-B’ Type-337
‘A’ Type-2574
Bachelor-861
‘2R-B’ Type-3
‘A’ Type-25
Bachelor-8
36
Low Slum-6120 60 60
Valuation Of Environment: A Study…
www.ijhssi.org 96 | Page
The above table depicts the responses regarding willingness to pay of households from different income groups.
It is clear from the table that willingness to pay and income level are positively related.
Because as income level increases percentages of households willing to pay also increase. 86% of the
households belonging to high income group are willing to pay for improved waste management. Similarly 75%
of the households belonging to the middle income group are willing to pay. Finally 47% from the low income
group are willing to pay. In total 61% of the total households are willing to pay for an improvement in waste
collection and disposal services in Paradip town. In the above table the figures are given both in numbers and in
percentages.
Willingness to pay vs. Years of schooling
Table III
Years of schooling
Answers
0-5 5-10 10-15 15-20 Total
Num % Num % Num % Num % Num %
Willing to pay 4 24 12 34 40 85 11 100 67 61
Unwilling to pay 13 76 23 66 7 15 0 0 43 39
Total 17 100 35 100 47 100 11 100 110 100
(Source: field survey results)
The above table shows the frequencies of willingness to pay with respect to the level of education of the head of
the household. The table reveals that as the level of education is higher, willingness to pay also increases. For
example 24% of the households within 0-5 years of schooling are willing to pay. 34% of the households within
5-10 years of schooling are willing to pay. Similarly 85% and 100% of the households within 10-15 and 15-20
years of schooling respectively are willing to pay. So it is clearly evident that years of schooling and willingness
to pay are positively related. That means as the level of education increases chances of being willing to pay also
increases.
Willingness to pay vs. Household size
Table IV
House hold size
Answers
<4 4-6 >6 Total
Num % Num % Num % Num %
Willing to pay 10 91 49 64 8 36 67 61
Unwilling to pay 1 9 28 36 14 64 43 39
Total 11 100 77 100 22 100 110 100
(Source: field survey results)
The above table indicates willingness to pay with respect to the size of household. The households are divided
into three categories depending upon their size. The first category consists of the households whose size is less
than 4. The second category takes into account the households whose size varies from 4 to 6. Finally the third
category consists of households having more than 6 members. From the figures given in the table it is clear that
the smaller the size of the household, the more is the willingness to pay. There are 11 households having
members less than 4. Out of 11 households 10 are willing to pay. So in percentage 91% of the households
having less than 4 members are willing to pay. 64% of the households having 4-6 members are willing to pay.
And 36% of the households having more than 6 members, are willing to pay for a better waste management. So
in a nutshell we can say that as the household size increases willingness to pay decreases. There are many
reasons behind this. But the principal reasons are that most of the large sized households belonged to low
income group so their willingness to pay was 0. Moreover large sized households normally face financial
constraints due to high expenditure with limited income. So they are unwilling to pay.
Valuation Of Environment: A Study…
www.ijhssi.org 97 | Page
Willingness to pay vs. Gender of the respondent
Table V
Gender of
Respondent
Answers
Male Female Total
Num % Num % Num %
Willing to pay 20 54 47 64 67 61
Unwilling to pay 17 46 26 36 43 39
Total 37 100 73 100 110 100
(Source: field survey results)
This table shows the frequency distribution of households depending upon the gender of the respondent. 73
respondents out of 110 were female. Only 37 respondents were male. Out of 73 female respondents, 47 were
willing to pay for an improved waste management. In percentage we can say that 64% female respondents were
willing to pay. In case of male, 20 out of 37 were willing to pay. In percentage 54% male respondents were
willing to pay. So proportionately females’ willingness to pay was higher than males’. The possible reason may
be that as traditionally it is the responsibility of the female head of the household to keep the surrounding clean
so their willingness to pay is positive.
Assessment of WTP range
Table VI
WTP range (in
Rs) per month
Willing to
pay from
High Income
group
Willing to pay
from Middle
income group
Willing to
pay from
Low income
group
Total
<50 12 27 28 67
50-100 8 14 0 22
100-150 5 5 0 10
150-200 3 0 0 3
(Source: field survey results)
The above table depicts the WTP range for households belonging to different income groups. In total 67
households were willing to pay. When the WTP bid was Rs. 0-50 then 67 households were willing to pay. When
the bid was increased to Rs 50-100 then in total 22 households were willing to pay. Similarly 10 households
were agreed to pay between Rs 100-150 and finally between Rs 150-200 only 3 households were willing to pay
and those 3 households belonged to high income group. Above Rs 200 no one was willing to pay. All the 67
households belonging to low income group were agreed to pay if the WTP amount is less than Rs 50. So it is
clear from the table that higher bids were affordable only by some households depending upon their income.
Hence it is clear that willingness to pay amount depends upon ability to pay.
WASTE DISPOSAL HABITS OF HOUSEHOLDS
The respondents were asked about their households’ waste disposal habits through the questionnaire. Some of
them were using only dustbin for waste disposal, some were following crude methods like burying and burning
the waste material and some followed both the crude methods and also were using dustbins. The frequency
distribution regarding waste disposal practices are given in the following table.
Valuation Of Environment: A Study…
www.ijhssi.org 98 | Page
Table showing waste disposal habits
Table VII
Method High income Middle income Low income Total
Num % Num % Num % Num %
Dustbin only 9 64 10 28 7 12 32 29
Dustbin/Burning/Burying 5 36 19 53 37 62 61 55
Burning/Burying only 0 0 7 19 16 26 17 16
Total 14 100 36 100 60 100 110 100
(Source: Field survey results)
The above table shows that 64% of the households belonging to the high income group were using only dustbin
for waste disposal. 36% were using both dustbin and crude methods like burning and burying their waste. In the
middle income group 28% were using dustbin for waste disposal. 53% were using both dustbin and crude
methods. 19% were following only crude methods for disposing their waste. From the low income group 12%
were using only dustbin, 62% were using both dustbin and crude methods and finally 26% were following only
crude methods for disposing their waste. So the above table shows that households belonging to lower income
group use crude methods more than the higher income groups. The possible reason may be that awareness
among the high income group is more than the low income people. So people with high income are aware of the
adverse effects of following crude methods of waste disposal.
RANKING OF WASTE PROBLEMS : During the survey the respondents were given a list of possible waste
problems in their locality and then they were asked to rank those problems according to their intensity. The
responses are given in the following table.
Table showing ranking of waste problems
Table VIII
Rank Problems Frequency
Num %
1 Inadequate collection service 54 49
2 Inadequate disposal of residential waste
water
32 29
3 Inadequate disposal of human excreta 15 14
4 Presence of dust particle in air 9 8
(Source: Field Survey results)
The above table shows that 54 households out of 110 or 49% of the total number of households viewed that
inadequate collection service was the most acute problem in their locality. Then 32 households or 29%
households viewed that inadequate disposal was the most serious problem in their locality. 15 households or
14% of the total households viewed inadequate disposal of human excreta to be the common problem in their
locality. And lastly 9 households or 8% of the total households considered presence of dust particle in air to be
the most serious problem in their locality. Practically the intensity of the above problems differed from place to
place. But the problem of inadequate collection service was common in all the regions. That means the
frequency of collection of garbage from the central bins and dustbins was insufficient. That is why this problem
was voted to be the most serious problem by half of the total number of households. The next three problems
were confined more or less to slum areas. As the slum areas are not provided with drainage and other sanitary
facilities so the problems like inadequate disposal of residential waste water and human excreta prevail in those
regions. Presence of dust particles in the air was a problem to those households which were closer to the plant
area. As the study area i.e. Paradip town is one of the up-coming commercial hub of Odisha so there is a
concentration of industrial units in that region. That’s why the near by households face problems like presence
of coal and dust particles in the air. So in a nutshell we can say that intensity of different waste problems vary
from place to place.
REASONS OF UNWILLINGNESS TO PAY : Those households who were unwilling to pay, were asked to
state the reason of their unwillingness. They were given with a list of possible reasons and then asked to reveal
the particular reason of their unwillingness to pay. The responses are given in the following table.
Valuation Of Environment: A Study…
www.ijhssi.org 99 | Page
Ranking of reasons of unwillingness to pay
Table IX
Rank Reasons Views in % Views in No.
1 Don’t consider the service important enough to pay for 47 18
2 Can’t afford to pay 31 12
3 Believe that general taxes should cover the cost 12 5
4 Don’t believe that the service will be reliable 10 4
(Source: Field survey results)
The above table shows that out of the 39 households who were unwilling to pay, 18 households or 47% of the
households not willing to pay, viewed that they didn’t consider the service important enough to pay for. 12
households or 31% of the total number of households unwilling to pay viewed that they couldn’t afford to pay. 5
households (12%) said that general taxes should cover the cost of waste management so they were not willing to
pay anything. Lastly 4 households (10%) didn’t believe that the service will be reliable so their willingness to
pay was 0. From these data we can conclude that there is a lack of awareness among people as a significant
number of households viewed that they didn’t consider the service important enough to pay for. That means
they still don’t realize the value of a clean environment or in other words they don’t place high value on a clean
environment. So there is a need of creating awareness among people.
VI. REGRESSION ANALYSIS
In this study WTP was taken to be the dependent variable and income, education level, household size were
taken to be the independent variable. Then linear regression was run to establish the relationship between the
dependent and independent variables. The regression results are given in the following table.
Model: α+β1X1+β2X2+ β3X3+β4X4+ε
Regression Results
Table X
variable Co-efficient t-value significance
Income .616 5.676 .000
Education .088 5.788 .000
Gender -0.168 -2.205 .031
Household
size
-0.107 -4.560 .028
(Source: Field survey results)
R2
=0.643
Adjusted R2
=0.615
According to the regression results, 64% of the variation in the dependent variable, WTP, is explained by the
variables included in the model collectively. The regression results show that both income and educational level
are positively related to WTP as expected i.e. β1 and β2 are greater than 0. This is consistent with the theoretical
expectations. Household size is negatively related with the level of WTP.In the model the coefficient of income
is 0.616 which shows a highly positive relationship between WTP and income level. The t value of income is
found to be 5.676 which is statistically significant even at 1%. The coefficient of education was found to be
0.088 which again shows a positive relationship between WTP and level of education. The t value of education
is found to be 5.788 which is statistically significant at 1%. The coefficient of the dummy variable gender is
found to be -2.205 which means women are more willing to pay than men. It was statistically significant at 5%
level of significance. Household size is negatively related with the level of WTP as shown by the negative
coefficient -0.107. It was also found to be significant at 5% level of significance. All these findings are
consistent with the theory.
EXPECTED AGGREGATE REVENUE : The survey covered one hundred and ten (110) households out of
13116 households in Paradip town. This means that the survey covered only 0.84% of the households in
Paradip. The results of the study show that on aggregate 61% of the households are willing to pay for garbage.
Despite the smallness of the sample relative to the population, for the sake of argument assuming that the
sample is nevertheless representative, it means that 7776 households are willing to pay for waste collection.
Expected revenue can be calculated using cross sectional data i.e. by income groups. These calculations are
shown in the following table.
Valuation Of Environment: A Study…
www.ijhssi.org 100 | Page
Expected Aggregate Revenue
Table XI
Income
Group
% of Hhs from
sample willing to
pay
Total no. of Hhs
in population
No. on Hhs from
population(willing
to pay)
Mean WTP
(in Rs) per
month
Expected
Revenue (in
Rs)
High 86 1426 1226 62.50 67430
Middle 75 3772 2829 31 113160
Low 47 7918 3721 12 55815
Total - - - - 236405
(Author’s own calculation)
This table reports on % of households from sample willing to pay by income group established by this study, the
corresponding total number of households in the population by income group, the number of households from
population willing to pay by income group, mean WTP by income group and then the amount of expected
revenue (in Rs) by income group. For example, to obtain aggregate monthly revenue of Rs 67,430 for the high
income group, firstly we calculate the 86% of the total number of households in population from that particular
income group (since the study itself reveals that 86% of the households from high income group are willing to
pay). Then we multiply that number with the mean WTP of that income group. In the present study 1426
households belong to high income group and 86% of 1426 is 1226. It means that 1226 households from high
income group are willing to pay if we consider the total population. Then multiplying this number i.e. 1226 with
the mean WTP i.e Rs 62.50 we get the monthly expected revenue from that income group i.e Rs 67,430. In this
way we can calculate the expected revenue from other income groups. Then taking the sum of the expected
revenues from 3 different income groups we get the aggregate revenue to be Rs 2,36,405 .Since households are
not charged for waste disposal per se, the estimated aggregate monthly revenue is a proxy for the potential
revenue that can be realized from user charges. Policy makers can compare the aggregate monthly revenue to
the actual cost of waste disposal. If the revenue falls short of the cost, it is plausible that waste disposal entails
some subsidy element. It is also quite possible that waste disposal has some characteristics of a public good. It is
a ‘bad’ when it is not collected. Furthermore, net negative earnings from waste disposal may discourage private
companies from participating in the privatization of waste disposal. On the other hand, net positive returns from
waste disposal may be an inducement to private sector to provide this service and thereby reduce the public cost
of a clean environment.
VII. CONCLUSIONS OF THE STUDY
The study aimed at generating information on the willingness to pay for improved waste disposal
services in Paradeep town. The data gathered through this study showed the level of peoples’ willingness to pay
for an improved waste disposal service by income groups. It was noted that generally people are willing to pay
and their willingness to pay depends on their ability to pay. That is, those earning high incomes are willing to
pay more than those with lower income (86% of households in high income group, 75% in the middle income
group are willing to pay as compared to 47% in the low income group).The study also established that if bids
per income group are used, the revenue that could be collected will amount to Rs 2, 36,405.00. Hence bids per
income group should be used to raise the revenue because it is based on the ability to pay principle.The study
also suggests that income and education are the significant factors that determine the level of WTP of a
household. The analysis of the data shows that as income and level of education rises, WTP also rises. So WTP
has a positive relationship with both income and education.
The study suggests that there are various types of waste problems throughout the different regions and
their intensity varies from place to place. Inadequate collection service is the most serious problem in the study
area. Besides it there are also some other problems like inadequate disposal of residential waste water,
inadequate disposal of human excreta and presence of dust particle in the air.The study reveals that a significant
portion of the households still use crude methods of waste disposal. Although they are provided with dustbins
and central bins still they are following crude methods of waste disposal because of their unawareness and lack
of knowledge about a clean environment. Moreover, since frequency of collection is very less so people are
disposing their waste by themselves in open lands, in drains etc. Such disposal methods are unsustainable.Some
respondents also viewed that there are some seasonal waste problems. For example- in winter normally the wind
blows from the north and since most of the plants are situated towards the northern side of the residential area so
the presence of dust and coal particles is comparatively more in winter. Similarly in the rainy season the slums
are flooded with rain water because of inadequate drainage and water disposal facility. So these are some of the
seasonal waste problems faced by the households in the study area.
Valuation Of Environment: A Study…
www.ijhssi.org 101 | Page
POLICY RECOMMENDATIONS
 The WTP study establishes that a fair amount of tax or service levy can be imposed on households
depending upon their income. The policy makers can take the amount of estimated revenue as a proxy for
the potential revenue and can compare the aggregate monthly revenue to the actual cost of waste disposal.
 The slums should be provided better waste disposal facilities because those areas are the main source of
waste generation. But the number of dustbins and central bins are not sufficient in those areas. Moreover
those regions are deprived of good sanitation. So if the authority takes a keen interest in an improvement of
waste management especially in those areas then it will go a long way in solving the waste problem in the
study area.
 The frequency of collection of waste from the dustbins and central bins should be increased. It may reduce
illegal piles of waste in open lands and crude methods of waste disposal.
LIMITATIONS OF THE STUDY
 Time and cost constraints were the main limitations of the study.
 There was a problem of hypothetical bias in the study. Because in the study of WTP a hypothetical market
is constructed and WTP bids are collected from the respondents. But in reality there is no market for that.
 Most of the respondents were reluctant to reveal their income. Some respondents also understated their
income.
 There was a problem of strategic bias in the study. Normally WTP studies conducted through CVM method
face this problem. If the respondent feels that the amount of WTP that he is revealing now, he has to pay it
later on then he will understate the preference and the amount of WTP will be lower. But if the respondent
feels that he has nothing to pay but just only to state an amount orally then for moral satisfaction he will
overstate his preference and the amount of WTP will be higher. In such conditions it is not easy to extract
the exact amount of WTP from the respondent.
These are the limitations of the present study.
REFERENCES
[1]. Niringiye, Aggrey (2010): Determinants of willingness to pay for solid waste management in Kampala city, Current Research
Journal of Economic Theory, 2(3): 119-123
[2]. Yedla, Sudhakar & Sarika Kansal (2003): Economic insight into Municipal Solid Waste Management in Mumbai: A Critical
Analysis, International Journal of Environment and Pollution, 19(5): 516-527
[3]. Omortor G, Douglason (2010): Households willingness to pay for improved solid waste management: The case of Mekelle city,
Ethiopia, www.epa.gov, Accessed on 27th
August 2011
[4]. Paradip Brochure (2010); www.paradipport.gov.in, Accessed on 17th
March 2011
[5]. Levine, Sandra Cointreau (2000): Demand Assessment & Willingness to pay survey for solid waste collection and disposal services,
Guidance Pack: Private sector participation in Municipal solid waste management, Swiss Centre for development co-operation in
Technology and Management
[6]. AEC Baa Atoll Project on Willingness to pay for waste management; www.atolls.gov, Accessed on 3rd
July 2011
[7]. Long, E.O , O.O. Longe & E.F. Ukpebar (2009): People’s perception on household solid waste management in Ojo Local
government Area in Nigeria, Iran. J. Environ. Health. Sci. Eng, 6(3): 201-208
[8]. Khee, Pek Chuen & Jamal Othman (2010): Household Demand for solid waste disposal options in Malaysia, World Academy of
Science, Engineering & Technology (66) 2010, 1153-1158
[9]. Post, Jeniffer L. (2007): Solid waste management in Jamaica: An investigation into waste reduction strategies, www.unep.or.jp,
Accessed on 12th
July, 2011
[10]. Lal. Padma, Margaret Tabuna Kawai & Sandeep K. Singh (2007): Economics of rural waste management in the Rewa province and
development of a rural solid waste management policy for Fiji, IWP- Pacific Technical Report (International Waters Project) no. 57;
www.sprep.org, Accessed on 28th
September 2011
[11]. Marchand, Rogier (1998): Marketing of waste management services in Tinology, the Philippines, A study on affordability and
willingness to pay, UWEP working document 9, www.waste.nl, Accessed on 22nd
May 2011
[12]. Wedgwood, Alison & Kevin Sansom (2003): Willingness to pay surveys – A streamlined approach,
www.iboro.ac.uk/wedc/publications/wtps.htm, Accessed on 3rd
March 2011
[13]. Amiga, Aklilu (2002): Households’ willingness to pay for improved solid waste management: The case of Addis Ababa, A thesis
submitted to the school of graduate studies of Addis Ababa University for partial fulfillment of the degree of Master of Science in
Economics
[14]. Altaf, Mir Anjum & J. R. Deshazo (1996): Household demand for improved solid waste management: A case study study of
Gujranwala, Pakistan, World Development, 24(5), 857-868
[15]. Shogren & White: Introduction to Environmental Economics, Chapter – 3 (Valuing the Environment & Natural Resources, pp 34-
65
[16]. Murad, M. W. (2007): Willingness to pay for improved access to solid waste collection and disposal services, The journal of
Environment & Development, 4(1), 84-101
[17]. Gujrati, D.N. (1995): Basic Econometrics (3rd
Edition). McGraw Hill International Editions

Mais conteúdo relacionado

Mais procurados

China Urban Water Blueprint
China Urban Water BlueprintChina Urban Water Blueprint
China Urban Water BlueprintXinying Zeng
 
London Urban Water Management Workshop
London Urban Water Management WorkshopLondon Urban Water Management Workshop
London Urban Water Management WorkshopCaBASupport
 
Environmental Concerns of developing and developed countries
Environmental Concerns of developing and developed countriesEnvironmental Concerns of developing and developed countries
Environmental Concerns of developing and developed countrieskrishnadutt1819
 
Integrated Urban Water Management, by Kala Vairavamoorthy
Integrated Urban Water Management, by Kala VairavamoorthyIntegrated Urban Water Management, by Kala Vairavamoorthy
Integrated Urban Water Management, by Kala VairavamoorthyGlobal Water Partnership
 
Environmental problems in urban areas
Environmental problems in urban areasEnvironmental problems in urban areas
Environmental problems in urban areasMohammed Aslam
 
Municipal solid waste: A strategic resource
Municipal solid waste: A strategic resource Municipal solid waste: A strategic resource
Municipal solid waste: A strategic resource sajjalp
 
Solid &amp; hazardous waste management
Solid &amp; hazardous waste managementSolid &amp; hazardous waste management
Solid &amp; hazardous waste managementSHASHANKKUMAR426
 
Integrated Urban Water Management - Tools and Training. By Kalanithy Vairavam...
Integrated Urban Water Management - Tools and Training. By Kalanithy Vairavam...Integrated Urban Water Management - Tools and Training. By Kalanithy Vairavam...
Integrated Urban Water Management - Tools and Training. By Kalanithy Vairavam...Global Water Partnership
 
Pune’s Trash Solution: A Zero Waste City (by Kunal Kumar, Municipal Commissio...
Pune’s Trash Solution: A Zero Waste City (by Kunal Kumar, Municipal Commissio...Pune’s Trash Solution: A Zero Waste City (by Kunal Kumar, Municipal Commissio...
Pune’s Trash Solution: A Zero Waste City (by Kunal Kumar, Municipal Commissio...NITI Aayog
 
Local Governance and Sustainability in Municipal Waste Management in the Mfou...
Local Governance and Sustainability in Municipal Waste Management in the Mfou...Local Governance and Sustainability in Municipal Waste Management in the Mfou...
Local Governance and Sustainability in Municipal Waste Management in the Mfou...ijtsrd
 
Urbanization on environment
Urbanization on environmentUrbanization on environment
Urbanization on environmentMuhammad Yasir
 
Sanitation: what's the real problem?
Sanitation: what's the real problem?Sanitation: what's the real problem?
Sanitation: what's the real problem?STEPS Centre
 
[Challenge:Future] Fresh water going down the drain
[Challenge:Future] Fresh water going down the drain[Challenge:Future] Fresh water going down the drain
[Challenge:Future] Fresh water going down the drainChallenge:Future
 

Mais procurados (20)

SustSan workshop: Integrated Urban Water Management by Ankur Gupta
SustSan workshop:  Integrated Urban Water Management by Ankur GuptaSustSan workshop:  Integrated Urban Water Management by Ankur Gupta
SustSan workshop: Integrated Urban Water Management by Ankur Gupta
 
China Urban Water Blueprint
China Urban Water BlueprintChina Urban Water Blueprint
China Urban Water Blueprint
 
London Urban Water Management Workshop
London Urban Water Management WorkshopLondon Urban Water Management Workshop
London Urban Water Management Workshop
 
Environmental Concerns of developing and developed countries
Environmental Concerns of developing and developed countriesEnvironmental Concerns of developing and developed countries
Environmental Concerns of developing and developed countries
 
Integrated Urban Water Management, by Kala Vairavamoorthy
Integrated Urban Water Management, by Kala VairavamoorthyIntegrated Urban Water Management, by Kala Vairavamoorthy
Integrated Urban Water Management, by Kala Vairavamoorthy
 
Environmental problems in urban areas
Environmental problems in urban areasEnvironmental problems in urban areas
Environmental problems in urban areas
 
Municipal solid waste: A strategic resource
Municipal solid waste: A strategic resource Municipal solid waste: A strategic resource
Municipal solid waste: A strategic resource
 
Priyadharsan
PriyadharsanPriyadharsan
Priyadharsan
 
ICSD final paper.koski
ICSD final paper.koskiICSD final paper.koski
ICSD final paper.koski
 
Solid &amp; hazardous waste management
Solid &amp; hazardous waste managementSolid &amp; hazardous waste management
Solid &amp; hazardous waste management
 
Integrated Urban Water Management - Tools and Training. By Kalanithy Vairavam...
Integrated Urban Water Management - Tools and Training. By Kalanithy Vairavam...Integrated Urban Water Management - Tools and Training. By Kalanithy Vairavam...
Integrated Urban Water Management - Tools and Training. By Kalanithy Vairavam...
 
Pune’s Trash Solution: A Zero Waste City (by Kunal Kumar, Municipal Commissio...
Pune’s Trash Solution: A Zero Waste City (by Kunal Kumar, Municipal Commissio...Pune’s Trash Solution: A Zero Waste City (by Kunal Kumar, Municipal Commissio...
Pune’s Trash Solution: A Zero Waste City (by Kunal Kumar, Municipal Commissio...
 
Local Governance and Sustainability in Municipal Waste Management in the Mfou...
Local Governance and Sustainability in Municipal Waste Management in the Mfou...Local Governance and Sustainability in Municipal Waste Management in the Mfou...
Local Governance and Sustainability in Municipal Waste Management in the Mfou...
 
BizIT 2007 Case
BizIT 2007 CaseBizIT 2007 Case
BizIT 2007 Case
 
Urbanization on environment
Urbanization on environmentUrbanization on environment
Urbanization on environment
 
Seeding the City Land Use Policies to Promote Urban Agriculture
Seeding the City Land Use Policies to Promote Urban AgricultureSeeding the City Land Use Policies to Promote Urban Agriculture
Seeding the City Land Use Policies to Promote Urban Agriculture
 
Sanitation: what's the real problem?
Sanitation: what's the real problem?Sanitation: what's the real problem?
Sanitation: what's the real problem?
 
MSW FAQ
MSW FAQMSW FAQ
MSW FAQ
 
[Challenge:Future] Fresh water going down the drain
[Challenge:Future] Fresh water going down the drain[Challenge:Future] Fresh water going down the drain
[Challenge:Future] Fresh water going down the drain
 
Solid waste management
Solid waste managementSolid waste management
Solid waste management
 

Semelhante a Valuation of Environment: A Study on Willingness to Pay for Improved Solid Waste Management in Paradip Town, Odisha Economic

Household willingness to pay for improved solid waste management in akinyele ...
Household willingness to pay for improved solid waste management in akinyele ...Household willingness to pay for improved solid waste management in akinyele ...
Household willingness to pay for improved solid waste management in akinyele ...Alexander Decker
 
case study in ecology,about waste management
case study in ecology,about waste managementcase study in ecology,about waste management
case study in ecology,about waste managementChristine Joy Ruiz
 
Economic Implications on the Composition of Municipal Solid Waste and its Man...
Economic Implications on the Composition of Municipal Solid Waste and its Man...Economic Implications on the Composition of Municipal Solid Waste and its Man...
Economic Implications on the Composition of Municipal Solid Waste and its Man...Dr. Amarjeet Singh
 
Waste management strategies in India.
Waste management strategies in India.Waste management strategies in India.
Waste management strategies in India.Siddhi Sharma
 
Policy Brief- MSW Management in Rhode Island
Policy Brief- MSW Management in Rhode IslandPolicy Brief- MSW Management in Rhode Island
Policy Brief- MSW Management in Rhode IslandCatherine Willett
 
INTRODUCTION TO MUNICIPAL SOLID WASTE
INTRODUCTION TO MUNICIPAL SOLID WASTEINTRODUCTION TO MUNICIPAL SOLID WASTE
INTRODUCTION TO MUNICIPAL SOLID WASTEGARYCRUSH
 
Solid Waste Management
Solid Waste ManagementSolid Waste Management
Solid Waste Managementmihretdananto
 
Solid Waste Management in Gazipur, Bangladesh
Solid Waste Management in Gazipur, BangladeshSolid Waste Management in Gazipur, Bangladesh
Solid Waste Management in Gazipur, Bangladesha989work
 
Ecological Foot Print Analysis-A Sustainable Environmental Management Tool fo...
Ecological Foot Print Analysis-A Sustainable Environmental Management Tool fo...Ecological Foot Print Analysis-A Sustainable Environmental Management Tool fo...
Ecological Foot Print Analysis-A Sustainable Environmental Management Tool fo...IDES Editor
 
De cycle 150 case study
De cycle 150 case studyDe cycle 150 case study
De cycle 150 case studycjankowski
 
Efficiency of Municipal Solid Waste Management Service Delivery System and Po...
Efficiency of Municipal Solid Waste Management Service Delivery System and Po...Efficiency of Municipal Solid Waste Management Service Delivery System and Po...
Efficiency of Municipal Solid Waste Management Service Delivery System and Po...Premier Publishers
 

Semelhante a Valuation of Environment: A Study on Willingness to Pay for Improved Solid Waste Management in Paradip Town, Odisha Economic (20)

Household willingness to pay for improved solid waste management in akinyele ...
Household willingness to pay for improved solid waste management in akinyele ...Household willingness to pay for improved solid waste management in akinyele ...
Household willingness to pay for improved solid waste management in akinyele ...
 
statement.docx
statement.docxstatement.docx
statement.docx
 
case study in ecology,about waste management
case study in ecology,about waste managementcase study in ecology,about waste management
case study in ecology,about waste management
 
Future2020Glasses
Future2020GlassesFuture2020Glasses
Future2020Glasses
 
Economic Implications on the Composition of Municipal Solid Waste and its Man...
Economic Implications on the Composition of Municipal Solid Waste and its Man...Economic Implications on the Composition of Municipal Solid Waste and its Man...
Economic Implications on the Composition of Municipal Solid Waste and its Man...
 
Waste management strategies in India.
Waste management strategies in India.Waste management strategies in India.
Waste management strategies in India.
 
Waste management project
Waste management  projectWaste management  project
Waste management project
 
Onsite Proper Solid Waste Handling Practices and Associated Factors Among Con...
Onsite Proper Solid Waste Handling Practices and Associated Factors Among Con...Onsite Proper Solid Waste Handling Practices and Associated Factors Among Con...
Onsite Proper Solid Waste Handling Practices and Associated Factors Among Con...
 
Policy Brief- MSW Management in Rhode Island
Policy Brief- MSW Management in Rhode IslandPolicy Brief- MSW Management in Rhode Island
Policy Brief- MSW Management in Rhode Island
 
Zero waste doc
Zero waste docZero waste doc
Zero waste doc
 
INTRODUCTION TO MUNICIPAL SOLID WASTE
INTRODUCTION TO MUNICIPAL SOLID WASTEINTRODUCTION TO MUNICIPAL SOLID WASTE
INTRODUCTION TO MUNICIPAL SOLID WASTE
 
Solid Waste Management
Solid Waste ManagementSolid Waste Management
Solid Waste Management
 
Solid Waste Management in Gazipur, Bangladesh
Solid Waste Management in Gazipur, BangladeshSolid Waste Management in Gazipur, Bangladesh
Solid Waste Management in Gazipur, Bangladesh
 
Ecological Foot Print Analysis-A Sustainable Environmental Management Tool fo...
Ecological Foot Print Analysis-A Sustainable Environmental Management Tool fo...Ecological Foot Print Analysis-A Sustainable Environmental Management Tool fo...
Ecological Foot Print Analysis-A Sustainable Environmental Management Tool fo...
 
ULBs-WM-PPP
ULBs-WM-PPPULBs-WM-PPP
ULBs-WM-PPP
 
De cycle 150 case study
De cycle 150 case studyDe cycle 150 case study
De cycle 150 case study
 
ieschintan321
ieschintan321ieschintan321
ieschintan321
 
Green agenda vs brown agenda
Green agenda vs brown agendaGreen agenda vs brown agenda
Green agenda vs brown agenda
 
Efficiency of Municipal Solid Waste Management Service Delivery System and Po...
Efficiency of Municipal Solid Waste Management Service Delivery System and Po...Efficiency of Municipal Solid Waste Management Service Delivery System and Po...
Efficiency of Municipal Solid Waste Management Service Delivery System and Po...
 
Swachh bharat
Swachh bharatSwachh bharat
Swachh bharat
 

Último

Call Girls Alandi Call Me 7737669865 Budget Friendly No Advance Booking
Call Girls Alandi Call Me 7737669865 Budget Friendly No Advance BookingCall Girls Alandi Call Me 7737669865 Budget Friendly No Advance Booking
Call Girls Alandi Call Me 7737669865 Budget Friendly No Advance Bookingroncy bisnoi
 
STS-UNIT 4 CLIMATE CHANGE POWERPOINT PRESENTATION
STS-UNIT 4 CLIMATE CHANGE POWERPOINT PRESENTATIONSTS-UNIT 4 CLIMATE CHANGE POWERPOINT PRESENTATION
STS-UNIT 4 CLIMATE CHANGE POWERPOINT PRESENTATIONrouseeyyy
 
SCIENCE-4-QUARTER4-WEEK-4-PPT-1 (1).pptx
SCIENCE-4-QUARTER4-WEEK-4-PPT-1 (1).pptxSCIENCE-4-QUARTER4-WEEK-4-PPT-1 (1).pptx
SCIENCE-4-QUARTER4-WEEK-4-PPT-1 (1).pptxRizalinePalanog2
 
Locating and isolating a gene, FISH, GISH, Chromosome walking and jumping, te...
Locating and isolating a gene, FISH, GISH, Chromosome walking and jumping, te...Locating and isolating a gene, FISH, GISH, Chromosome walking and jumping, te...
Locating and isolating a gene, FISH, GISH, Chromosome walking and jumping, te...Silpa
 
GBSN - Microbiology (Unit 1)
GBSN - Microbiology (Unit 1)GBSN - Microbiology (Unit 1)
GBSN - Microbiology (Unit 1)Areesha Ahmad
 
Module for Grade 9 for Asynchronous/Distance learning
Module for Grade 9 for Asynchronous/Distance learningModule for Grade 9 for Asynchronous/Distance learning
Module for Grade 9 for Asynchronous/Distance learninglevieagacer
 
9999266834 Call Girls In Noida Sector 22 (Delhi) Call Girl Service
9999266834 Call Girls In Noida Sector 22 (Delhi) Call Girl Service9999266834 Call Girls In Noida Sector 22 (Delhi) Call Girl Service
9999266834 Call Girls In Noida Sector 22 (Delhi) Call Girl Servicenishacall1
 
COMPUTING ANTI-DERIVATIVES (Integration by SUBSTITUTION)
COMPUTING ANTI-DERIVATIVES(Integration by SUBSTITUTION)COMPUTING ANTI-DERIVATIVES(Integration by SUBSTITUTION)
COMPUTING ANTI-DERIVATIVES (Integration by SUBSTITUTION)AkefAfaneh2
 
Zoology 5th semester notes( Sumit_yadav).pdf
Zoology 5th semester notes( Sumit_yadav).pdfZoology 5th semester notes( Sumit_yadav).pdf
Zoology 5th semester notes( Sumit_yadav).pdfSumit Kumar yadav
 
Asymmetry in the atmosphere of the ultra-hot Jupiter WASP-76 b
Asymmetry in the atmosphere of the ultra-hot Jupiter WASP-76 bAsymmetry in the atmosphere of the ultra-hot Jupiter WASP-76 b
Asymmetry in the atmosphere of the ultra-hot Jupiter WASP-76 bSérgio Sacani
 
PSYCHOSOCIAL NEEDS. in nursing II sem pptx
PSYCHOSOCIAL NEEDS. in nursing II sem pptxPSYCHOSOCIAL NEEDS. in nursing II sem pptx
PSYCHOSOCIAL NEEDS. in nursing II sem pptxSuji236384
 
Biogenic Sulfur Gases as Biosignatures on Temperate Sub-Neptune Waterworlds
Biogenic Sulfur Gases as Biosignatures on Temperate Sub-Neptune WaterworldsBiogenic Sulfur Gases as Biosignatures on Temperate Sub-Neptune Waterworlds
Biogenic Sulfur Gases as Biosignatures on Temperate Sub-Neptune WaterworldsSérgio Sacani
 
Dopamine neurotransmitter determination using graphite sheet- graphene nano-s...
Dopamine neurotransmitter determination using graphite sheet- graphene nano-s...Dopamine neurotransmitter determination using graphite sheet- graphene nano-s...
Dopamine neurotransmitter determination using graphite sheet- graphene nano-s...Mohammad Khajehpour
 
Forensic Biology & Its biological significance.pdf
Forensic Biology & Its biological significance.pdfForensic Biology & Its biological significance.pdf
Forensic Biology & Its biological significance.pdfrohankumarsinghrore1
 
GBSN - Biochemistry (Unit 1)
GBSN - Biochemistry (Unit 1)GBSN - Biochemistry (Unit 1)
GBSN - Biochemistry (Unit 1)Areesha Ahmad
 
Chemical Tests; flame test, positive and negative ions test Edexcel Internati...
Chemical Tests; flame test, positive and negative ions test Edexcel Internati...Chemical Tests; flame test, positive and negative ions test Edexcel Internati...
Chemical Tests; flame test, positive and negative ions test Edexcel Internati...ssuser79fe74
 
module for grade 9 for distance learning
module for grade 9 for distance learningmodule for grade 9 for distance learning
module for grade 9 for distance learninglevieagacer
 
IDENTIFICATION OF THE LIVING- forensic medicine
IDENTIFICATION OF THE LIVING- forensic medicineIDENTIFICATION OF THE LIVING- forensic medicine
IDENTIFICATION OF THE LIVING- forensic medicinesherlingomez2
 

Último (20)

CELL -Structural and Functional unit of life.pdf
CELL -Structural and Functional unit of life.pdfCELL -Structural and Functional unit of life.pdf
CELL -Structural and Functional unit of life.pdf
 
Call Girls Alandi Call Me 7737669865 Budget Friendly No Advance Booking
Call Girls Alandi Call Me 7737669865 Budget Friendly No Advance BookingCall Girls Alandi Call Me 7737669865 Budget Friendly No Advance Booking
Call Girls Alandi Call Me 7737669865 Budget Friendly No Advance Booking
 
STS-UNIT 4 CLIMATE CHANGE POWERPOINT PRESENTATION
STS-UNIT 4 CLIMATE CHANGE POWERPOINT PRESENTATIONSTS-UNIT 4 CLIMATE CHANGE POWERPOINT PRESENTATION
STS-UNIT 4 CLIMATE CHANGE POWERPOINT PRESENTATION
 
Site Acceptance Test .
Site Acceptance Test                    .Site Acceptance Test                    .
Site Acceptance Test .
 
SCIENCE-4-QUARTER4-WEEK-4-PPT-1 (1).pptx
SCIENCE-4-QUARTER4-WEEK-4-PPT-1 (1).pptxSCIENCE-4-QUARTER4-WEEK-4-PPT-1 (1).pptx
SCIENCE-4-QUARTER4-WEEK-4-PPT-1 (1).pptx
 
Locating and isolating a gene, FISH, GISH, Chromosome walking and jumping, te...
Locating and isolating a gene, FISH, GISH, Chromosome walking and jumping, te...Locating and isolating a gene, FISH, GISH, Chromosome walking and jumping, te...
Locating and isolating a gene, FISH, GISH, Chromosome walking and jumping, te...
 
GBSN - Microbiology (Unit 1)
GBSN - Microbiology (Unit 1)GBSN - Microbiology (Unit 1)
GBSN - Microbiology (Unit 1)
 
Module for Grade 9 for Asynchronous/Distance learning
Module for Grade 9 for Asynchronous/Distance learningModule for Grade 9 for Asynchronous/Distance learning
Module for Grade 9 for Asynchronous/Distance learning
 
9999266834 Call Girls In Noida Sector 22 (Delhi) Call Girl Service
9999266834 Call Girls In Noida Sector 22 (Delhi) Call Girl Service9999266834 Call Girls In Noida Sector 22 (Delhi) Call Girl Service
9999266834 Call Girls In Noida Sector 22 (Delhi) Call Girl Service
 
COMPUTING ANTI-DERIVATIVES (Integration by SUBSTITUTION)
COMPUTING ANTI-DERIVATIVES(Integration by SUBSTITUTION)COMPUTING ANTI-DERIVATIVES(Integration by SUBSTITUTION)
COMPUTING ANTI-DERIVATIVES (Integration by SUBSTITUTION)
 
Zoology 5th semester notes( Sumit_yadav).pdf
Zoology 5th semester notes( Sumit_yadav).pdfZoology 5th semester notes( Sumit_yadav).pdf
Zoology 5th semester notes( Sumit_yadav).pdf
 
Asymmetry in the atmosphere of the ultra-hot Jupiter WASP-76 b
Asymmetry in the atmosphere of the ultra-hot Jupiter WASP-76 bAsymmetry in the atmosphere of the ultra-hot Jupiter WASP-76 b
Asymmetry in the atmosphere of the ultra-hot Jupiter WASP-76 b
 
PSYCHOSOCIAL NEEDS. in nursing II sem pptx
PSYCHOSOCIAL NEEDS. in nursing II sem pptxPSYCHOSOCIAL NEEDS. in nursing II sem pptx
PSYCHOSOCIAL NEEDS. in nursing II sem pptx
 
Biogenic Sulfur Gases as Biosignatures on Temperate Sub-Neptune Waterworlds
Biogenic Sulfur Gases as Biosignatures on Temperate Sub-Neptune WaterworldsBiogenic Sulfur Gases as Biosignatures on Temperate Sub-Neptune Waterworlds
Biogenic Sulfur Gases as Biosignatures on Temperate Sub-Neptune Waterworlds
 
Dopamine neurotransmitter determination using graphite sheet- graphene nano-s...
Dopamine neurotransmitter determination using graphite sheet- graphene nano-s...Dopamine neurotransmitter determination using graphite sheet- graphene nano-s...
Dopamine neurotransmitter determination using graphite sheet- graphene nano-s...
 
Forensic Biology & Its biological significance.pdf
Forensic Biology & Its biological significance.pdfForensic Biology & Its biological significance.pdf
Forensic Biology & Its biological significance.pdf
 
GBSN - Biochemistry (Unit 1)
GBSN - Biochemistry (Unit 1)GBSN - Biochemistry (Unit 1)
GBSN - Biochemistry (Unit 1)
 
Chemical Tests; flame test, positive and negative ions test Edexcel Internati...
Chemical Tests; flame test, positive and negative ions test Edexcel Internati...Chemical Tests; flame test, positive and negative ions test Edexcel Internati...
Chemical Tests; flame test, positive and negative ions test Edexcel Internati...
 
module for grade 9 for distance learning
module for grade 9 for distance learningmodule for grade 9 for distance learning
module for grade 9 for distance learning
 
IDENTIFICATION OF THE LIVING- forensic medicine
IDENTIFICATION OF THE LIVING- forensic medicineIDENTIFICATION OF THE LIVING- forensic medicine
IDENTIFICATION OF THE LIVING- forensic medicine
 

Valuation of Environment: A Study on Willingness to Pay for Improved Solid Waste Management in Paradip Town, Odisha Economic

  • 1. International Journal of Humanities and Social Science Invention ISSN (Online): 2319 – 7722, ISSN (Print): 2319 – 7714 www.ijhssi.org Volume 4 Issue 1 ǁ January. 2015 ǁ PP.92-101 www.ijhssi.org 92 | Page Valuation of Environment: A Study on Willingness to Pay for Improved Solid Waste Management in Paradip Town, Odisha Economic Simashree Subhadarsini NCDS, Bhubaneswar ABSTRACT : Economic valuation of environment is not an easy but controversial task. Because putting a price tag on environment seems to be impossible. But economists are busy valuing everything in terms of money. From economic point of view valuation studies are much more required now days to find out the priorities of the people. Similarly this study has tried to find out how much value people put on a clean environment in terms of their willingness to pay for improved waste management. This study uses a contingent valuation method to estimate the willingness to pay of the households living in the township of Paradip Port Trust, Odisha. It also uses a multiple linear regression model to find out the factors which influence the willingness to pay of the households. The study reveals that almost 63% of the households are willing to pay which establishes a good quantum of expected revenue from the public in the form of a fee or tax. KEYWORDS: willingness to pay, waste, Paradip Port, waste management I. INTRODUCTION Environment and economic systems are closely interlinked. Basically environment provides four services to the economy as a source of energy and inputs to production, as a source of amenity, as a provider of global life support services and as a waste sink. But there is a limit to which environment can provide resources and assimilate waste. This limit is known as carrying capacity of environment. But with the increase in population this carrying capacity is adversely affected. There are so many reasons responsible for this ecological imbalance. One of those reasons is waste generation and its management. This problem is more acute in developing countries like India because waste generation is high in these countries due to high population. Moreover the waste collection and disposal habits are also crude in developing countries. So it leads to problems like accumulation of waste in open lands, in drains, in rivers etc. It also leads to pollution problems like air pollution, water pollution, soil pollution etc. So there is a timely need for proper management of these waste items. But in reality proper attention is not paid to this problem. Because normally developing countries are more focused on developmental activities like creation of infrastructure, business expansion etc. So they neither pay attention nor spend money on the issues like waste management. If we see from the other side then it is also a fact that normally developing countries have financial constraint on their side that is why they can’t spend much on the head like waste management. So it is the role of the society or the community to actively participate and contribute towards the solution of the problem. If people place value on a clean environment but the authority is unable to provide it due to financial constraint then it is the responsibility of the community itself to pay for the solution of the problem. That means they should be willing to pay to overcome the money problem. Here comes the role of community. People’s participation in social and environmental activities is necessary to resolve such socially undermining and environmentally degrading problems. In fact, tackling such a problem would require massive investment schemes by local governments. However, the governments of developing nations usually suffer from heavily burdened and stretched financial and economic resources and a high opportunity cost of funds. Therefore, society’s participation is logically and realistically needed for widening infrastructure and environmental service provisions. So households should pay for collection and disposal of waste. But how much the households will pay that depends on how much value they place on environment. If an environmental good is valued then households will be willing to pay more for it. This amount indicates their willingness to pay (WTP). Hence WTP is the amount a person would be willing to pay to obtain a good or service. In the above case households’ WTP measures the benefits to them of the increase in waste management quality. An objection that could be made straightaway is that, if WTP is used as a measure of value to an Individual, then this measure depends not just on their preferences but also on their income. A rich household, with the same preferences,
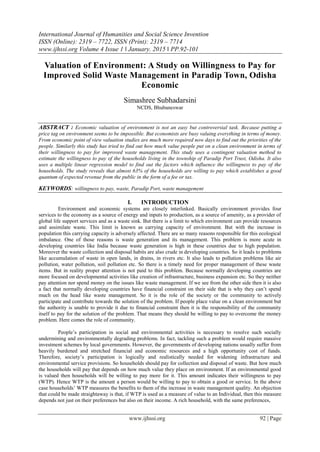
  • 2. Valuation Of Environment: A Study… www.ijhssi.org 93 | Page could clearly afford to pay more than a poor household. Economic values based on WTP would therefore always be biased in favor of the rich. Hence WTP concept is meaningless unless backed up by ability to pay. At the level of the economy as a whole, we clearly cannot give up more than we actually have or expect to earn. Avoiding the temptation of making the somewhat dubious assumption that the existing distribution of income is optimal, we are therefore left with the position that value as measured by WTP, is a function of the existing income distribution, and may change as this distribution changes.In recent years since waste management is becoming unmanageable so most of the governments in various countries found it necessary to engage the private sector in waste management. A willingness to pay study can generate data of interest to both the government and the private sector. For the private sector, WTP can indicate the economic charges for waste collection and disposal. One way the partnership between households and waste management authorities can be forged is by first understanding the value households place on a clean environment. Therefore there is an urgent need to motivate the households to contribute to activities such as waste collection. This paper aims at estimating the value households place on a clean environment as well as the factors that determine the household’s WTP for a clean environment. II. OBJECTIVES The objectives of the study are  To assess the existing waste management practices in the study area,  To estimate the WTP of households for improved waste management,  To find out the factors those determine households’ WTP,  To make policy recommendations for a sustainable waste management. III. WASTE GNERATION IN PARADEEP In recent years there has been mushroom growth of many slums within port area, like slums at Sandhakud, Bangalipada, Noliasahi, Phandi Colony, Bhimabhoi colony etc. Most of the municipal solid waste generated is coming from the above areas from all drains, roads, medicals, hotels and restaurant, fruits and vegetable markets, fish and meat market, households, offices and shops and above all, the slums. Rapid population growth, urbanization and industrial growth have led to severe problems of SWM. The management of large quantity of solid waste requires proper system of collection, transportation and disposal, besides proper knowledge of what the wastes are made up of, how they need to be collected and disposed off. Basing upon the population and standard it is estimated that about 48.00 M.T. of solid waste is being generated per day from various sectors like industry, household, market, commercial establishments and hospital waste etc. There are three nos. of fish markets where quantity of waste generated is estimated to be 6 M.T. per day. There are 3 hospitals with 70 beds, 17520 households, shops, offices, and other institutions around 30 nos. THE WARD WISE ROAD LENGTHS FOR STREET SWEEPING Figure 1 (Source: Detail Project Report by Paradeep Municipality on ICZM) THE WARD WISE GENERATION OF SOLID WASTE
  • 3. Valuation Of Environment: A Study… www.ijhssi.org 94 | Page Figure 2 (Source: Detail Project Report by Paradeep Municipality on ICZM) The above figure shows quantity of solid waste generated by different wards. The horizontal axis shows the ward number and vertical axis shows the generated waste amount. IV. PRESENT PRACTICE OF SOLID WASTE MANAGEMENT AT PARADEEP It is said that out of nothing comes nothing. Since Paradeep Municipality has already completed 25 years of its existence, it has done a lot of things on SWM. The collection, transportation of solid waste to the dumping ground is the main thrust areas of the present practice Basing upon the population and standard it is estimated that about 48 M.T. of solid waste is being generated per day from various sector like industry, household, market, marine and hospital waste etc. Paradeep Municipality attaches highest priority to conservancy, related to public health. It has employed 110 nos. full time and part time sanitary staffs for this purpose to collect solid waste within a covered area of 32.40 Sq. Km. Besides this 7 nos. of vehicles have been pressed into service i.e. one mini truck, one tipper, three tractor trailer, one J.C.B for lifting of solid waste and carrying to the waste disposal point. Presently, central bins/ dust bins have been placed in residential, market and commercial areas for dumping of wastes from households. Street sweeping is done through sweepers for collection of solid waste. This is the prevalent practice of Collection of solid waste. 5 wards have been privatized for collection and transportation of waste.Then the solid waste is transported to the dumping ground at ward no. 10 in Bangalipada by dint of auto tippers, tractors, mini trucks, and dumpers from Central bins. They are dumped at Landfill site at Bangalipada. At Bangalipada, a proposal was mooted to set up a processing plant for disposal of garbage and MOU was signed with NGO VIKASH. The authorization had been also obtained from State Pollution Control Board. The facility operated in about 2.00 acres of area. Both processing as well as land filling is done in the same time. The wastes were mainly composted aerobically and rejects were sorted out. The compost is dried and sieved and packed for sealing. The rejects were used for land filling. But inadequate resources handicapped the project. Now, only dumping is done at Bangalipada. SHORT COMINGS IN PRESENT PRACTICE The routine and mechanical handling of solid waste suffer from numerous deficiencies such as institutional weakness, lack of strategic planning, shortage of financial and human resources, inefficient managerial practices, improper choice of technology etc. The service levels are far from satisfactory.  Though wastes are collected through bun at source, most of the people have not abandoned the practice of depositing it in open space, drains, main storm water drains, water channels etc. It poses a serious hazard for health and sanitation.  There is no system of door to door collection.  The dust bins are not sufficient.  No arrangement of primary collection from hotels and restaurants.  Vegetable, fruit, fish markets do not have adequate storage facility.  Concrete bins have been placed which are unhygienic and unscientific.  Slum areas are not provided with adequate services.
  • 4. Valuation Of Environment: A Study… www.ijhssi.org 95 | Page  The Municipality does not have adequate men power and machinery for solid waste disposal.  The land fill site is only two acres which is inadequate.  Monitoring and evaluation process is not efficient. V. ANALYSIS OF DATA AND EMPIRICAL FINDINGS SAMPLE DETAILS This section discusses the empirical findings and interpretation of the survey data. The section is sub- divided into two sections dealing with descriptive and regression analyses. For the descriptive analysis, frequencies and cross tables were run to establish the relationship between willingness to pay and other socio- economic variables. For the study, one hundred and ten households were interviewed. Sixty households from the low income group, thirty six from the middle income group and fourteen from the high income group were interviewed. A high proportion of households was interviewed from the low income category because most of the people in Paradip Town belong to this category. To draw the sample firstly the study area was divided into three different regions. In the study area residential facility has been geographically segregated depending upon income. So in a particular region households belonging to a specific income group reside. But of course there are exceptions. For example in this study, there are three regions. Region one or namely ‘Madhuban’ region consists of households belonging to high income group. The second region namely ‘Nuabazar’ region consists of households belonging to both middle income group and low income group. Because in that area both slums and residential quarters are present. The region three or namely ‘Noliasahi’ is a slum area. So households belonging to that region come under low income group.After dividing the study area into three regions, secondary data was collected regarding the type and number of quarters in each region. The number of households belonging to the slum area was also collected. Then number of households from each category to be interviewed was determined through equal proportionate sampling. Then the sample units were interviewed through structured questionnaire method. The detailed numbers of sample units from different type of quarters are given below in the table. Table I List of Households (from quarters & Slums) (Source: field survey results) DESCRIPTIVE ANALYSIS OF DATA : In this section frequency distribution tables and cross-tables were drawn to establish the relationship between willingness to pay and other socio-economic variables such as income, years of schooling or educational level, gender and household size. These results are shown in the following tables. Willingness to pay vs. Income level Table II Income groups Answers High Income Middle Income Low Income Total Number % Numb er % Number % Number % Willing to pay 12 86 27 75 28 47 67 61 Unwilling to pay 2 14 9 25 32 53 43 39 Total 14 100 36 100 60 100 110 100 (Source: field survey results) Income group Type of quarter with total number Units drawn as sample units(1% of total) Total number of sample units High ‘D’ Type-71 ‘C’ Type-402 ‘3R-B’ type-952 ‘D’ Type-1 ‘C’ Type-4 ‘3R-B’ Type-9 14 Middle ‘2R-B’ Type-337 ‘A’ Type-2574 Bachelor-861 ‘2R-B’ Type-3 ‘A’ Type-25 Bachelor-8 36 Low Slum-6120 60 60
  • 5. Valuation Of Environment: A Study… www.ijhssi.org 96 | Page The above table depicts the responses regarding willingness to pay of households from different income groups. It is clear from the table that willingness to pay and income level are positively related. Because as income level increases percentages of households willing to pay also increase. 86% of the households belonging to high income group are willing to pay for improved waste management. Similarly 75% of the households belonging to the middle income group are willing to pay. Finally 47% from the low income group are willing to pay. In total 61% of the total households are willing to pay for an improvement in waste collection and disposal services in Paradip town. In the above table the figures are given both in numbers and in percentages. Willingness to pay vs. Years of schooling Table III Years of schooling Answers 0-5 5-10 10-15 15-20 Total Num % Num % Num % Num % Num % Willing to pay 4 24 12 34 40 85 11 100 67 61 Unwilling to pay 13 76 23 66 7 15 0 0 43 39 Total 17 100 35 100 47 100 11 100 110 100 (Source: field survey results) The above table shows the frequencies of willingness to pay with respect to the level of education of the head of the household. The table reveals that as the level of education is higher, willingness to pay also increases. For example 24% of the households within 0-5 years of schooling are willing to pay. 34% of the households within 5-10 years of schooling are willing to pay. Similarly 85% and 100% of the households within 10-15 and 15-20 years of schooling respectively are willing to pay. So it is clearly evident that years of schooling and willingness to pay are positively related. That means as the level of education increases chances of being willing to pay also increases. Willingness to pay vs. Household size Table IV House hold size Answers <4 4-6 >6 Total Num % Num % Num % Num % Willing to pay 10 91 49 64 8 36 67 61 Unwilling to pay 1 9 28 36 14 64 43 39 Total 11 100 77 100 22 100 110 100 (Source: field survey results) The above table indicates willingness to pay with respect to the size of household. The households are divided into three categories depending upon their size. The first category consists of the households whose size is less than 4. The second category takes into account the households whose size varies from 4 to 6. Finally the third category consists of households having more than 6 members. From the figures given in the table it is clear that the smaller the size of the household, the more is the willingness to pay. There are 11 households having members less than 4. Out of 11 households 10 are willing to pay. So in percentage 91% of the households having less than 4 members are willing to pay. 64% of the households having 4-6 members are willing to pay. And 36% of the households having more than 6 members, are willing to pay for a better waste management. So in a nutshell we can say that as the household size increases willingness to pay decreases. There are many reasons behind this. But the principal reasons are that most of the large sized households belonged to low income group so their willingness to pay was 0. Moreover large sized households normally face financial constraints due to high expenditure with limited income. So they are unwilling to pay.
  • 6. Valuation Of Environment: A Study… www.ijhssi.org 97 | Page Willingness to pay vs. Gender of the respondent Table V Gender of Respondent Answers Male Female Total Num % Num % Num % Willing to pay 20 54 47 64 67 61 Unwilling to pay 17 46 26 36 43 39 Total 37 100 73 100 110 100 (Source: field survey results) This table shows the frequency distribution of households depending upon the gender of the respondent. 73 respondents out of 110 were female. Only 37 respondents were male. Out of 73 female respondents, 47 were willing to pay for an improved waste management. In percentage we can say that 64% female respondents were willing to pay. In case of male, 20 out of 37 were willing to pay. In percentage 54% male respondents were willing to pay. So proportionately females’ willingness to pay was higher than males’. The possible reason may be that as traditionally it is the responsibility of the female head of the household to keep the surrounding clean so their willingness to pay is positive. Assessment of WTP range Table VI WTP range (in Rs) per month Willing to pay from High Income group Willing to pay from Middle income group Willing to pay from Low income group Total <50 12 27 28 67 50-100 8 14 0 22 100-150 5 5 0 10 150-200 3 0 0 3 (Source: field survey results) The above table depicts the WTP range for households belonging to different income groups. In total 67 households were willing to pay. When the WTP bid was Rs. 0-50 then 67 households were willing to pay. When the bid was increased to Rs 50-100 then in total 22 households were willing to pay. Similarly 10 households were agreed to pay between Rs 100-150 and finally between Rs 150-200 only 3 households were willing to pay and those 3 households belonged to high income group. Above Rs 200 no one was willing to pay. All the 67 households belonging to low income group were agreed to pay if the WTP amount is less than Rs 50. So it is clear from the table that higher bids were affordable only by some households depending upon their income. Hence it is clear that willingness to pay amount depends upon ability to pay. WASTE DISPOSAL HABITS OF HOUSEHOLDS The respondents were asked about their households’ waste disposal habits through the questionnaire. Some of them were using only dustbin for waste disposal, some were following crude methods like burying and burning the waste material and some followed both the crude methods and also were using dustbins. The frequency distribution regarding waste disposal practices are given in the following table.
  • 7. Valuation Of Environment: A Study… www.ijhssi.org 98 | Page Table showing waste disposal habits Table VII Method High income Middle income Low income Total Num % Num % Num % Num % Dustbin only 9 64 10 28 7 12 32 29 Dustbin/Burning/Burying 5 36 19 53 37 62 61 55 Burning/Burying only 0 0 7 19 16 26 17 16 Total 14 100 36 100 60 100 110 100 (Source: Field survey results) The above table shows that 64% of the households belonging to the high income group were using only dustbin for waste disposal. 36% were using both dustbin and crude methods like burning and burying their waste. In the middle income group 28% were using dustbin for waste disposal. 53% were using both dustbin and crude methods. 19% were following only crude methods for disposing their waste. From the low income group 12% were using only dustbin, 62% were using both dustbin and crude methods and finally 26% were following only crude methods for disposing their waste. So the above table shows that households belonging to lower income group use crude methods more than the higher income groups. The possible reason may be that awareness among the high income group is more than the low income people. So people with high income are aware of the adverse effects of following crude methods of waste disposal. RANKING OF WASTE PROBLEMS : During the survey the respondents were given a list of possible waste problems in their locality and then they were asked to rank those problems according to their intensity. The responses are given in the following table. Table showing ranking of waste problems Table VIII Rank Problems Frequency Num % 1 Inadequate collection service 54 49 2 Inadequate disposal of residential waste water 32 29 3 Inadequate disposal of human excreta 15 14 4 Presence of dust particle in air 9 8 (Source: Field Survey results) The above table shows that 54 households out of 110 or 49% of the total number of households viewed that inadequate collection service was the most acute problem in their locality. Then 32 households or 29% households viewed that inadequate disposal was the most serious problem in their locality. 15 households or 14% of the total households viewed inadequate disposal of human excreta to be the common problem in their locality. And lastly 9 households or 8% of the total households considered presence of dust particle in air to be the most serious problem in their locality. Practically the intensity of the above problems differed from place to place. But the problem of inadequate collection service was common in all the regions. That means the frequency of collection of garbage from the central bins and dustbins was insufficient. That is why this problem was voted to be the most serious problem by half of the total number of households. The next three problems were confined more or less to slum areas. As the slum areas are not provided with drainage and other sanitary facilities so the problems like inadequate disposal of residential waste water and human excreta prevail in those regions. Presence of dust particles in the air was a problem to those households which were closer to the plant area. As the study area i.e. Paradip town is one of the up-coming commercial hub of Odisha so there is a concentration of industrial units in that region. That’s why the near by households face problems like presence of coal and dust particles in the air. So in a nutshell we can say that intensity of different waste problems vary from place to place. REASONS OF UNWILLINGNESS TO PAY : Those households who were unwilling to pay, were asked to state the reason of their unwillingness. They were given with a list of possible reasons and then asked to reveal the particular reason of their unwillingness to pay. The responses are given in the following table.
  • 8. Valuation Of Environment: A Study… www.ijhssi.org 99 | Page Ranking of reasons of unwillingness to pay Table IX Rank Reasons Views in % Views in No. 1 Don’t consider the service important enough to pay for 47 18 2 Can’t afford to pay 31 12 3 Believe that general taxes should cover the cost 12 5 4 Don’t believe that the service will be reliable 10 4 (Source: Field survey results) The above table shows that out of the 39 households who were unwilling to pay, 18 households or 47% of the households not willing to pay, viewed that they didn’t consider the service important enough to pay for. 12 households or 31% of the total number of households unwilling to pay viewed that they couldn’t afford to pay. 5 households (12%) said that general taxes should cover the cost of waste management so they were not willing to pay anything. Lastly 4 households (10%) didn’t believe that the service will be reliable so their willingness to pay was 0. From these data we can conclude that there is a lack of awareness among people as a significant number of households viewed that they didn’t consider the service important enough to pay for. That means they still don’t realize the value of a clean environment or in other words they don’t place high value on a clean environment. So there is a need of creating awareness among people. VI. REGRESSION ANALYSIS In this study WTP was taken to be the dependent variable and income, education level, household size were taken to be the independent variable. Then linear regression was run to establish the relationship between the dependent and independent variables. The regression results are given in the following table. Model: α+β1X1+β2X2+ β3X3+β4X4+ε Regression Results Table X variable Co-efficient t-value significance Income .616 5.676 .000 Education .088 5.788 .000 Gender -0.168 -2.205 .031 Household size -0.107 -4.560 .028 (Source: Field survey results) R2 =0.643 Adjusted R2 =0.615 According to the regression results, 64% of the variation in the dependent variable, WTP, is explained by the variables included in the model collectively. The regression results show that both income and educational level are positively related to WTP as expected i.e. β1 and β2 are greater than 0. This is consistent with the theoretical expectations. Household size is negatively related with the level of WTP.In the model the coefficient of income is 0.616 which shows a highly positive relationship between WTP and income level. The t value of income is found to be 5.676 which is statistically significant even at 1%. The coefficient of education was found to be 0.088 which again shows a positive relationship between WTP and level of education. The t value of education is found to be 5.788 which is statistically significant at 1%. The coefficient of the dummy variable gender is found to be -2.205 which means women are more willing to pay than men. It was statistically significant at 5% level of significance. Household size is negatively related with the level of WTP as shown by the negative coefficient -0.107. It was also found to be significant at 5% level of significance. All these findings are consistent with the theory. EXPECTED AGGREGATE REVENUE : The survey covered one hundred and ten (110) households out of 13116 households in Paradip town. This means that the survey covered only 0.84% of the households in Paradip. The results of the study show that on aggregate 61% of the households are willing to pay for garbage. Despite the smallness of the sample relative to the population, for the sake of argument assuming that the sample is nevertheless representative, it means that 7776 households are willing to pay for waste collection. Expected revenue can be calculated using cross sectional data i.e. by income groups. These calculations are shown in the following table.
  • 9. Valuation Of Environment: A Study… www.ijhssi.org 100 | Page Expected Aggregate Revenue Table XI Income Group % of Hhs from sample willing to pay Total no. of Hhs in population No. on Hhs from population(willing to pay) Mean WTP (in Rs) per month Expected Revenue (in Rs) High 86 1426 1226 62.50 67430 Middle 75 3772 2829 31 113160 Low 47 7918 3721 12 55815 Total - - - - 236405 (Author’s own calculation) This table reports on % of households from sample willing to pay by income group established by this study, the corresponding total number of households in the population by income group, the number of households from population willing to pay by income group, mean WTP by income group and then the amount of expected revenue (in Rs) by income group. For example, to obtain aggregate monthly revenue of Rs 67,430 for the high income group, firstly we calculate the 86% of the total number of households in population from that particular income group (since the study itself reveals that 86% of the households from high income group are willing to pay). Then we multiply that number with the mean WTP of that income group. In the present study 1426 households belong to high income group and 86% of 1426 is 1226. It means that 1226 households from high income group are willing to pay if we consider the total population. Then multiplying this number i.e. 1226 with the mean WTP i.e Rs 62.50 we get the monthly expected revenue from that income group i.e Rs 67,430. In this way we can calculate the expected revenue from other income groups. Then taking the sum of the expected revenues from 3 different income groups we get the aggregate revenue to be Rs 2,36,405 .Since households are not charged for waste disposal per se, the estimated aggregate monthly revenue is a proxy for the potential revenue that can be realized from user charges. Policy makers can compare the aggregate monthly revenue to the actual cost of waste disposal. If the revenue falls short of the cost, it is plausible that waste disposal entails some subsidy element. It is also quite possible that waste disposal has some characteristics of a public good. It is a ‘bad’ when it is not collected. Furthermore, net negative earnings from waste disposal may discourage private companies from participating in the privatization of waste disposal. On the other hand, net positive returns from waste disposal may be an inducement to private sector to provide this service and thereby reduce the public cost of a clean environment. VII. CONCLUSIONS OF THE STUDY The study aimed at generating information on the willingness to pay for improved waste disposal services in Paradeep town. The data gathered through this study showed the level of peoples’ willingness to pay for an improved waste disposal service by income groups. It was noted that generally people are willing to pay and their willingness to pay depends on their ability to pay. That is, those earning high incomes are willing to pay more than those with lower income (86% of households in high income group, 75% in the middle income group are willing to pay as compared to 47% in the low income group).The study also established that if bids per income group are used, the revenue that could be collected will amount to Rs 2, 36,405.00. Hence bids per income group should be used to raise the revenue because it is based on the ability to pay principle.The study also suggests that income and education are the significant factors that determine the level of WTP of a household. The analysis of the data shows that as income and level of education rises, WTP also rises. So WTP has a positive relationship with both income and education. The study suggests that there are various types of waste problems throughout the different regions and their intensity varies from place to place. Inadequate collection service is the most serious problem in the study area. Besides it there are also some other problems like inadequate disposal of residential waste water, inadequate disposal of human excreta and presence of dust particle in the air.The study reveals that a significant portion of the households still use crude methods of waste disposal. Although they are provided with dustbins and central bins still they are following crude methods of waste disposal because of their unawareness and lack of knowledge about a clean environment. Moreover, since frequency of collection is very less so people are disposing their waste by themselves in open lands, in drains etc. Such disposal methods are unsustainable.Some respondents also viewed that there are some seasonal waste problems. For example- in winter normally the wind blows from the north and since most of the plants are situated towards the northern side of the residential area so the presence of dust and coal particles is comparatively more in winter. Similarly in the rainy season the slums are flooded with rain water because of inadequate drainage and water disposal facility. So these are some of the seasonal waste problems faced by the households in the study area.
  • 10. Valuation Of Environment: A Study… www.ijhssi.org 101 | Page POLICY RECOMMENDATIONS  The WTP study establishes that a fair amount of tax or service levy can be imposed on households depending upon their income. The policy makers can take the amount of estimated revenue as a proxy for the potential revenue and can compare the aggregate monthly revenue to the actual cost of waste disposal.  The slums should be provided better waste disposal facilities because those areas are the main source of waste generation. But the number of dustbins and central bins are not sufficient in those areas. Moreover those regions are deprived of good sanitation. So if the authority takes a keen interest in an improvement of waste management especially in those areas then it will go a long way in solving the waste problem in the study area.  The frequency of collection of waste from the dustbins and central bins should be increased. It may reduce illegal piles of waste in open lands and crude methods of waste disposal. LIMITATIONS OF THE STUDY  Time and cost constraints were the main limitations of the study.  There was a problem of hypothetical bias in the study. Because in the study of WTP a hypothetical market is constructed and WTP bids are collected from the respondents. But in reality there is no market for that.  Most of the respondents were reluctant to reveal their income. Some respondents also understated their income.  There was a problem of strategic bias in the study. Normally WTP studies conducted through CVM method face this problem. If the respondent feels that the amount of WTP that he is revealing now, he has to pay it later on then he will understate the preference and the amount of WTP will be lower. But if the respondent feels that he has nothing to pay but just only to state an amount orally then for moral satisfaction he will overstate his preference and the amount of WTP will be higher. In such conditions it is not easy to extract the exact amount of WTP from the respondent. These are the limitations of the present study. REFERENCES [1]. Niringiye, Aggrey (2010): Determinants of willingness to pay for solid waste management in Kampala city, Current Research Journal of Economic Theory, 2(3): 119-123 [2]. Yedla, Sudhakar & Sarika Kansal (2003): Economic insight into Municipal Solid Waste Management in Mumbai: A Critical Analysis, International Journal of Environment and Pollution, 19(5): 516-527 [3]. Omortor G, Douglason (2010): Households willingness to pay for improved solid waste management: The case of Mekelle city, Ethiopia, www.epa.gov, Accessed on 27th August 2011 [4]. Paradip Brochure (2010); www.paradipport.gov.in, Accessed on 17th March 2011 [5]. Levine, Sandra Cointreau (2000): Demand Assessment & Willingness to pay survey for solid waste collection and disposal services, Guidance Pack: Private sector participation in Municipal solid waste management, Swiss Centre for development co-operation in Technology and Management [6]. AEC Baa Atoll Project on Willingness to pay for waste management; www.atolls.gov, Accessed on 3rd July 2011 [7]. Long, E.O , O.O. Longe & E.F. Ukpebar (2009): People’s perception on household solid waste management in Ojo Local government Area in Nigeria, Iran. J. Environ. Health. Sci. Eng, 6(3): 201-208 [8]. Khee, Pek Chuen & Jamal Othman (2010): Household Demand for solid waste disposal options in Malaysia, World Academy of Science, Engineering & Technology (66) 2010, 1153-1158 [9]. Post, Jeniffer L. (2007): Solid waste management in Jamaica: An investigation into waste reduction strategies, www.unep.or.jp, Accessed on 12th July, 2011 [10]. Lal. Padma, Margaret Tabuna Kawai & Sandeep K. Singh (2007): Economics of rural waste management in the Rewa province and development of a rural solid waste management policy for Fiji, IWP- Pacific Technical Report (International Waters Project) no. 57; www.sprep.org, Accessed on 28th September 2011 [11]. Marchand, Rogier (1998): Marketing of waste management services in Tinology, the Philippines, A study on affordability and willingness to pay, UWEP working document 9, www.waste.nl, Accessed on 22nd May 2011 [12]. Wedgwood, Alison & Kevin Sansom (2003): Willingness to pay surveys – A streamlined approach, www.iboro.ac.uk/wedc/publications/wtps.htm, Accessed on 3rd March 2011 [13]. Amiga, Aklilu (2002): Households’ willingness to pay for improved solid waste management: The case of Addis Ababa, A thesis submitted to the school of graduate studies of Addis Ababa University for partial fulfillment of the degree of Master of Science in Economics [14]. Altaf, Mir Anjum & J. R. Deshazo (1996): Household demand for improved solid waste management: A case study study of Gujranwala, Pakistan, World Development, 24(5), 857-868 [15]. Shogren & White: Introduction to Environmental Economics, Chapter – 3 (Valuing the Environment & Natural Resources, pp 34- 65 [16]. Murad, M. W. (2007): Willingness to pay for improved access to solid waste collection and disposal services, The journal of Environment & Development, 4(1), 84-101 [17]. Gujrati, D.N. (1995): Basic Econometrics (3rd Edition). McGraw Hill International Editions